1/n I& #39;ve been talking for a bit about uncertainty with the Ontario COVID-19 data over the new testing system.
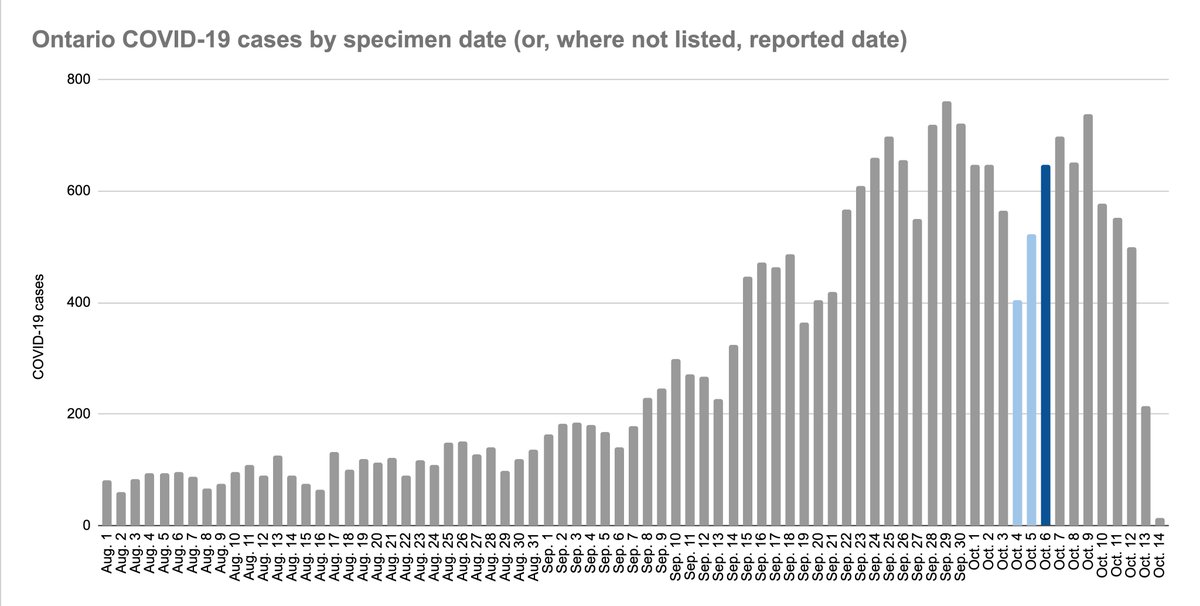
Here& #39;s a chart that illustrates my caution: This is cases by the day a patient& #39;s sample was collected:
A steep slope up to a peak on Sept. 29.
Then a *big* dip.
Here& #39;s a chart that illustrates my caution: This is cases by the day a patient& #39;s sample was collected:
A steep slope up to a peak on Sept. 29.
Then a *big* dip.
2/n That dip itself is very easy to explain:
Dark blue is the day appointments started.
Light blue are the days some centres were closed to prepare. Before that, there were a few days of extremely long wait times.
It& #39;s what& #39;s happened *after* the dip that I& #39;m not clear on.
Dark blue is the day appointments started.
Light blue are the days some centres were closed to prepare. Before that, there were a few days of extremely long wait times.
It& #39;s what& #39;s happened *after* the dip that I& #39;m not clear on.
3/n My question: Is the new testing regime equally as good at catching cases as it was in late Sept.?
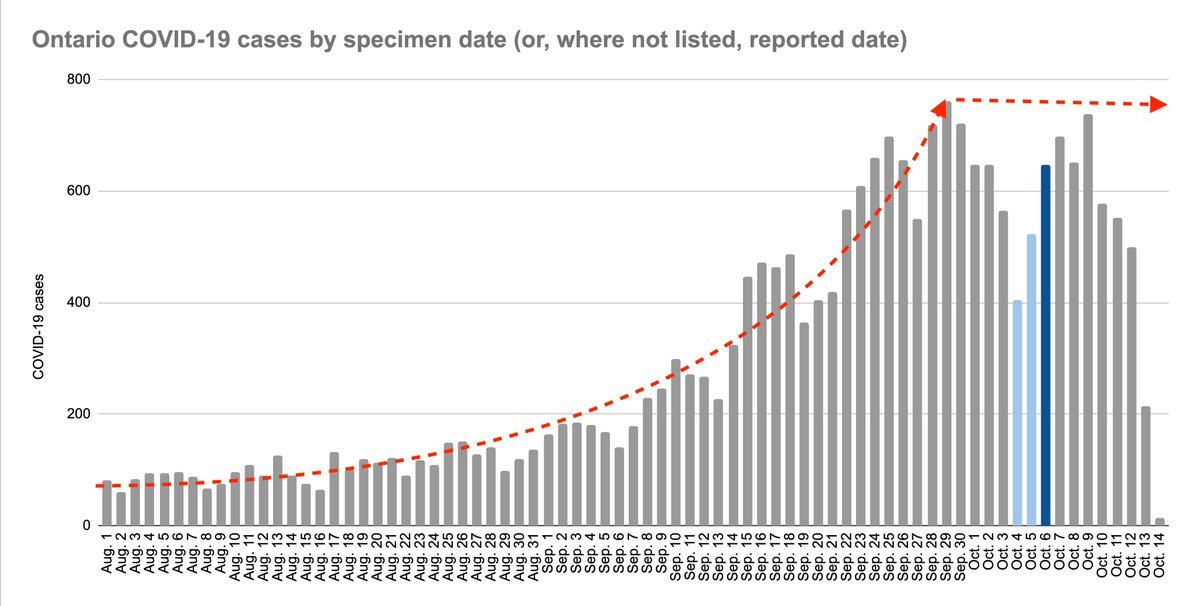
If it is, then the data is evidence cases have actually been falling since hitting a peak in late Sept. — maybe they *have* plateaued.
The signal would be something like this:
If it is, then the data is evidence cases have actually been falling since hitting a peak in late Sept. — maybe they *have* plateaued.
The signal would be something like this:
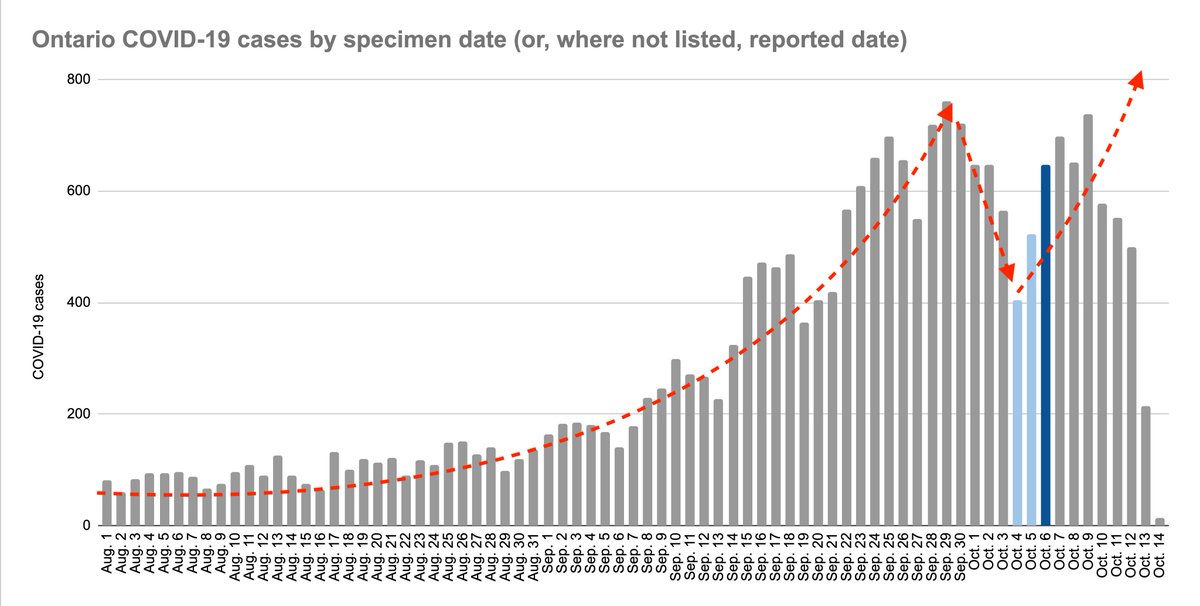
4/n But what if the new test regime is worse at catching cases? Maybe w. lower volume or some other factor.
If that were true, infections since the switchover *could* still be rising at a quick pace, just after resetting to a new baseline.
ie: This signal could be plausible:
If that were true, infections since the switchover *could* still be rising at a quick pace, just after resetting to a new baseline.
ie: This signal could be plausible:

 Read on Twitter


