Loading up some charts --
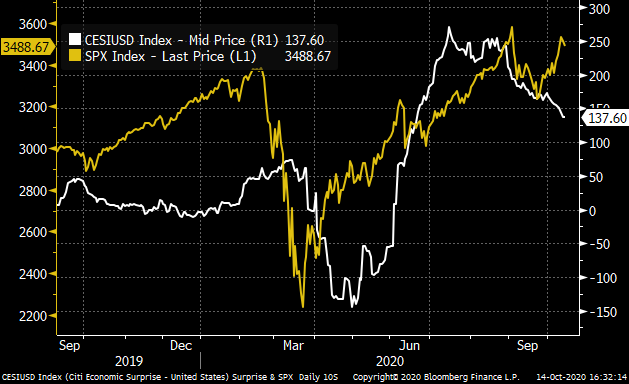
(1) US Data Surprise (Yellow) vs $SPX. YES, stocks attention on stimulus (post-Election/Biden breeze view) + shortage of financial assets + sector shifts ...and less on momentum of economy ...
@Callum_Thomas @sunchartist $MACRO
(1) US Data Surprise (Yellow) vs $SPX. YES, stocks attention on stimulus (post-Election/Biden breeze view) + shortage of financial assets + sector shifts ...and less on momentum of economy ...
@Callum_Thomas @sunchartist $MACRO
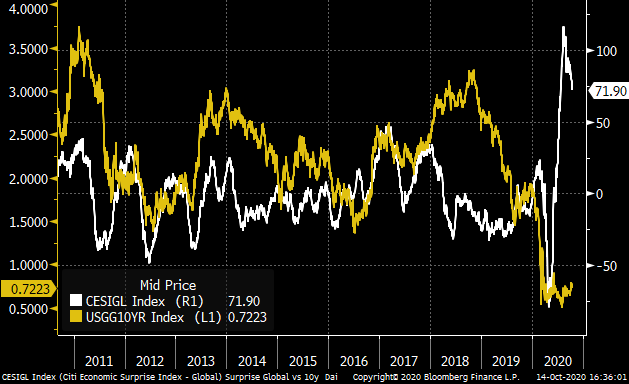
(2) Global Data Surprise (White) vs US 10yr -- this also looks probably like growth -- > divot, policy response + surge, and next chapter a retrace/loss momentum until early 2021/22. The 10y range is pegged; should stay pegged
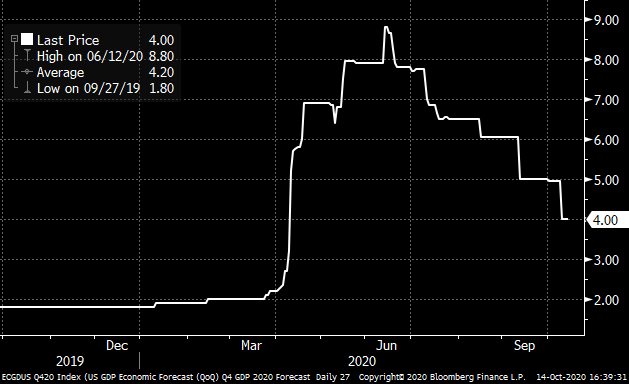
(3) Q3 GDP on Oct 29, but that& #39;s old new and in the price(s). More of interest is momentum into 2021, and could Q4 GDP (estimates below) be negative? Given quarterly swings in GDP in 2020, why not; and what does that mean for assets & policy response(s).
(4) Biden win/sweep fever has infected markets past few weeks --- I actually believe the polls, just have some uncertainty about the days/weeks post Election and how markets handle that. I understood $SPX Sept to the June high. Now 3400 and that low also matter most
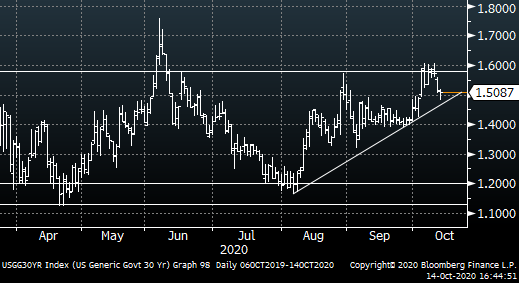
(5) Biden win/sweep fever met the supply-set-up last week in rates, right to top of range, and now comes the squeeze around that. Ie. 30y to Aug highs (below), 5s/30s to range support, and the bounce. How crowded is this?
(6) Well, if CFTC data is a proxy, there& #39;s a decent short-base (altho not really tested/squeezed) should risk/Election get messy. Below is combined Spec Net position in US +WN futs (US futs more pronounced selling past few weeks) vs 5s/30s curve (blue). I like $TLT calls.
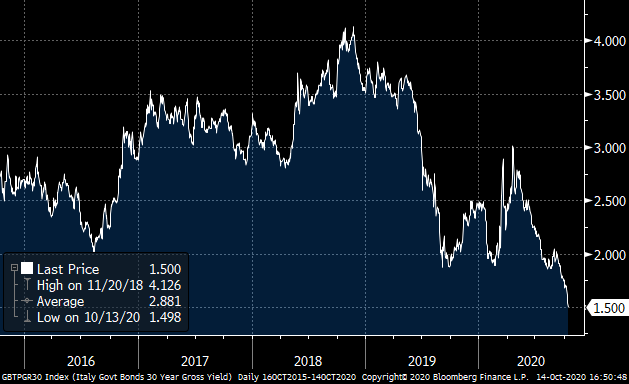
(7) US long duration also helped by the grabfest in long-end of Europe -- Italy, Spain, Austria etc. ECB QE expansion + rising COVID + much further from inflation targets, etc. Here is Italy 30yr
(8) Which brings to "chart of the week" nomination, courtesy of the fine people @DeutscheBank .... Italian yields to 1310...
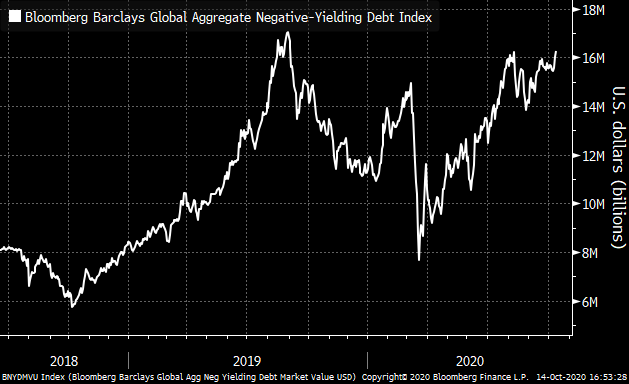
(9) The reach for duration is upticking the $ Value of Negative Yielding debt (below), which has broader implications for global rates/curves, nominal and real rates, alternatives ($XAU $XBT) etc, and risk. Also just reminds that rates are here for a reason.
(11) Also shows in $XLE (White) and Banks ($KBE, Orange) --- I still dislike banks (low for longer, more credit issues, flat(ter) curves, pegged rates and 2021-22 regulatory risks from Biden etc).
(12) sticking a thumb at the banks and $KBE further (below), the long term chart is bearish until proven otherwise, and aims to <$20 into next year. Feel like a lot of bottom feeding has gone into financials; likewise $SX7E which seems poised for another run to the 2020 lows
(13) EM FX also fits the same bucket of poor performing despite USD tone and general risk-on. Here is JPM EMFX Index (White) vs $SX7E (European fins)
(14) Again on EM, JPM EMFX lagged not just CNH and USD heaviness, but also outright performance of $EEM etf. Maybe that makes sense, and to note EEM/SPY looks similar to FX performance.
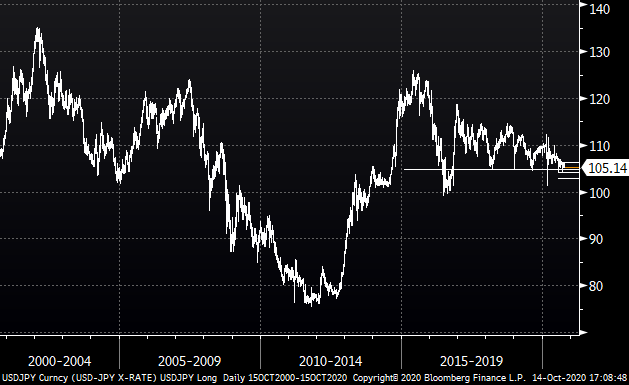
(15) Still like $USDJPY downside into early 2021; get the benefit of US rates (relationship upticking), expected (further) fall in US Real Rates, and risk-off protection around pre or post-Election. 3-month 98 one-touches; sell those after the delta expands
(16) Taking a longer look at $USDJPY, where is the broader "trap-door" on this chart? And what sort of anxiety does that reveal for policymakers, global long-ends etc. Could be a super-interesting mid-2021 topic. $FXY calls
(17) Last chart, longer view around $XAU. As long as we stay above 1800, thinking 2021-22 trade is towards 2500. Obviously the recent wash around shakes the tree a bit, but no long-term structural damage. Would feel better too if/when 1950 is cleared
/ ends
/ ends

 Read on Twitter