BTS Twitter Engagement
(December 2015 – September 2020)
[ Monthly update for #BTS_TwitterMetrics :
thread of data visualizations of @BTS_twt engagements ]
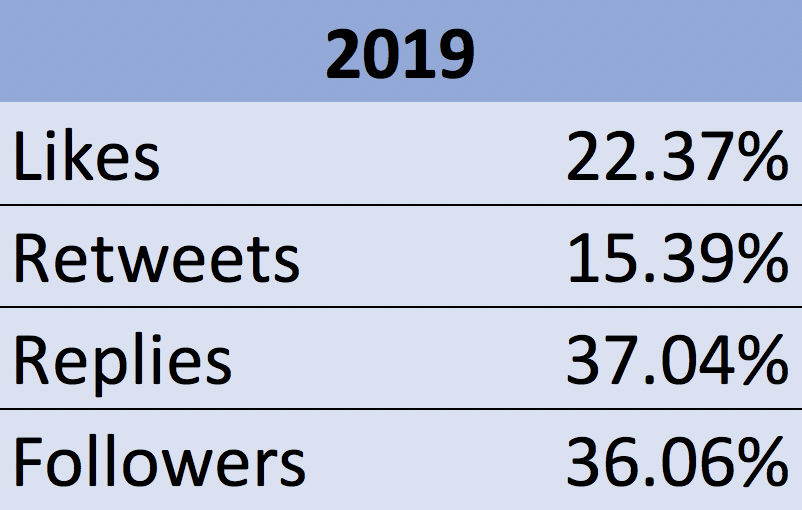
Let’s start with comparisons of likes, retweets and replies between 2019 & 2020
1/x
(December 2015 – September 2020)
[ Monthly update for #BTS_TwitterMetrics :
thread of data visualizations of @BTS_twt engagements ]
Let’s start with comparisons of likes, retweets and replies between 2019 & 2020
1/x
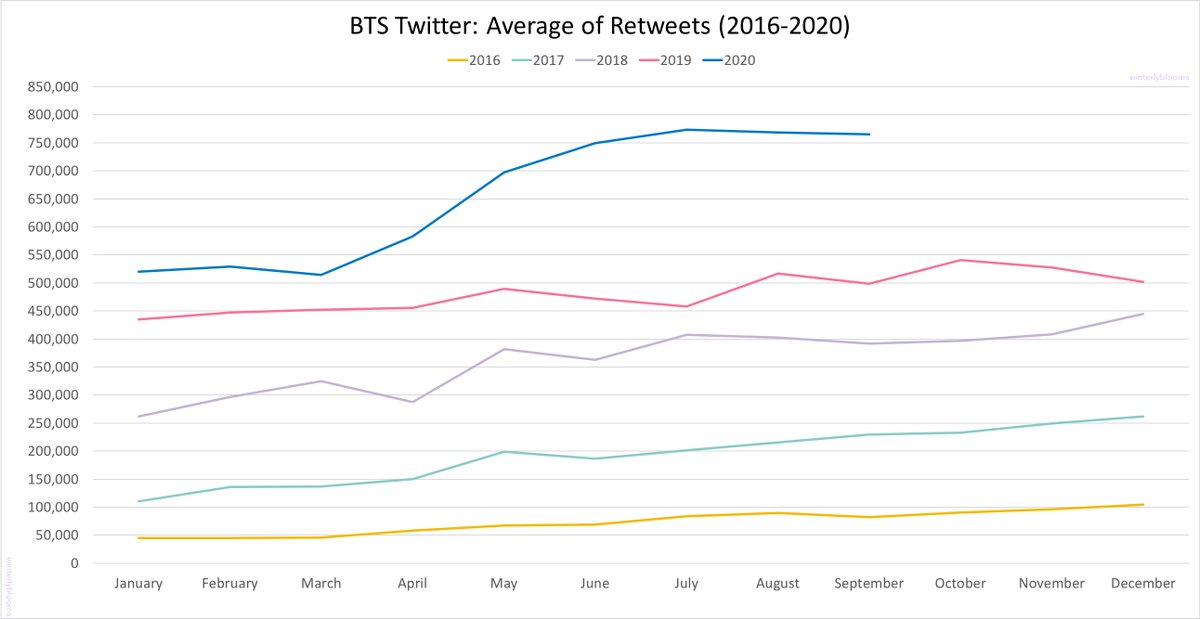
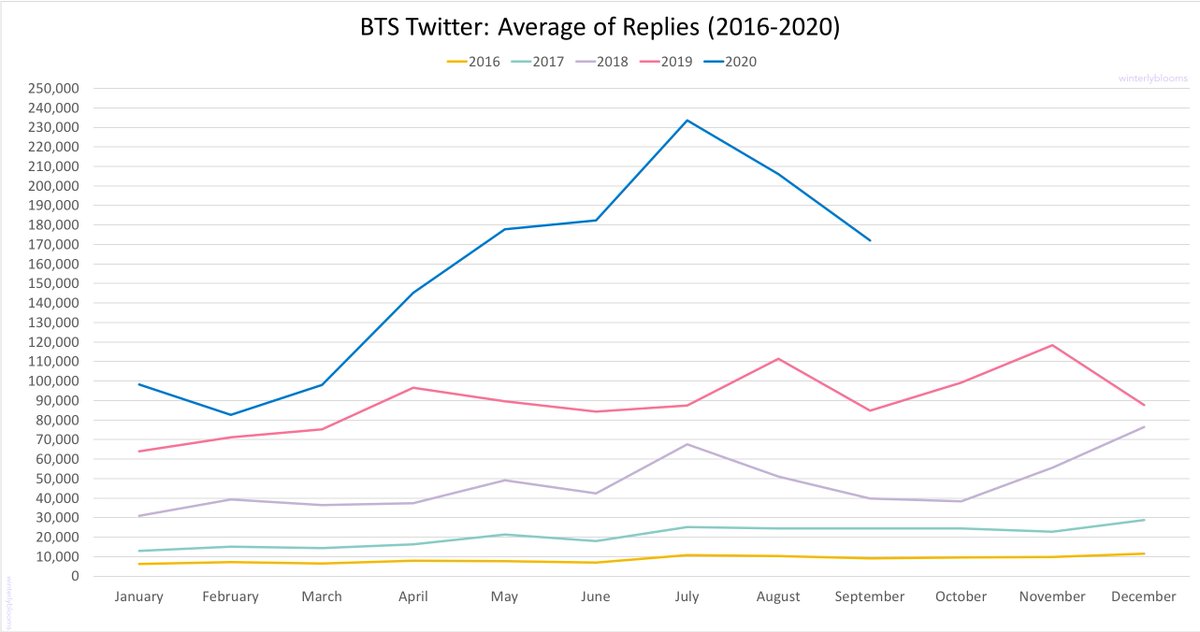
These new graphs show how @BTS_twt engagements have grown across each year and compares each growth to one another.
2/x
2/x
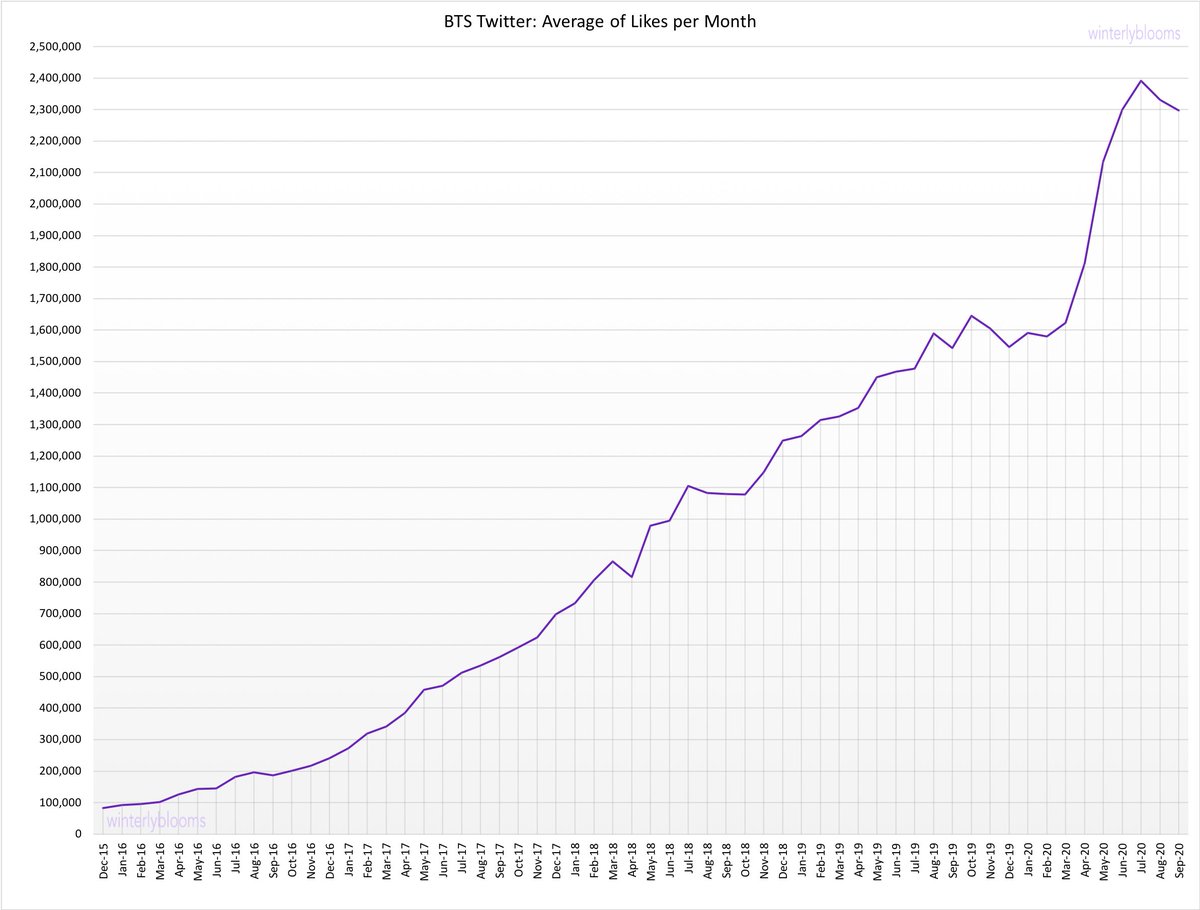
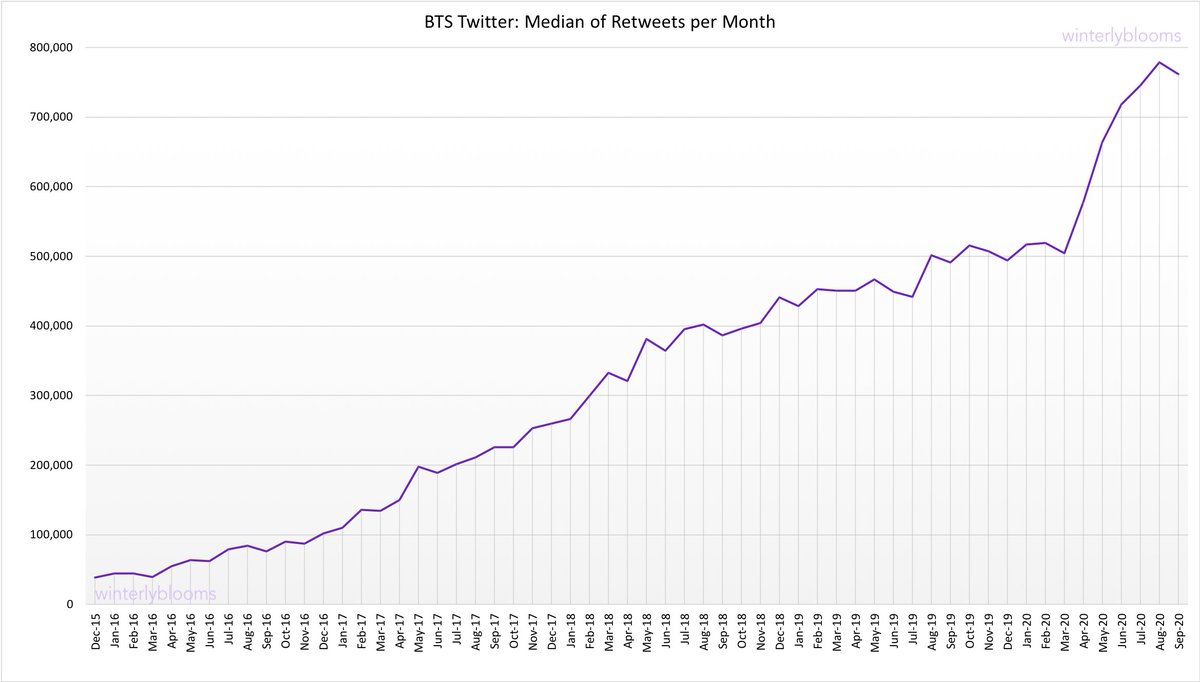
As I had found in previous updates, there was a sudden increase in @BTS_twt engagements after March 2020. This hit a peak in July and has been slowly leveling down since then. I will explain why there is a slight decrease later on.
3/x
3/x
Here is a graph that visualizes @BTS_twt followers since Dec. 2015.
I found that while there is a strong correlation between followers* and engagements, it’s not significant.
4/x
I found that while there is a strong correlation between followers* and engagements, it’s not significant.
4/x
This means that they don’t mutually affect one another and there could be other reasons for their increase.
*the gaps on the line for followers is due to missing data. I couldn’t find info on the number of @BTS_twt followers for those months.
5/x
*the gaps on the line for followers is due to missing data. I couldn’t find info on the number of @BTS_twt followers for those months.
5/x
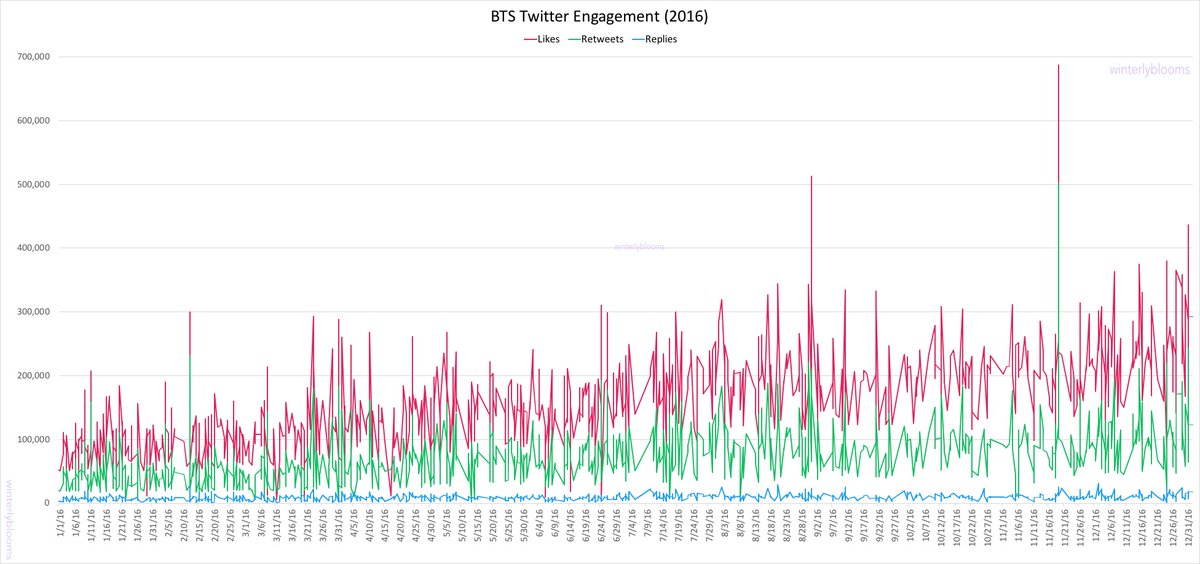
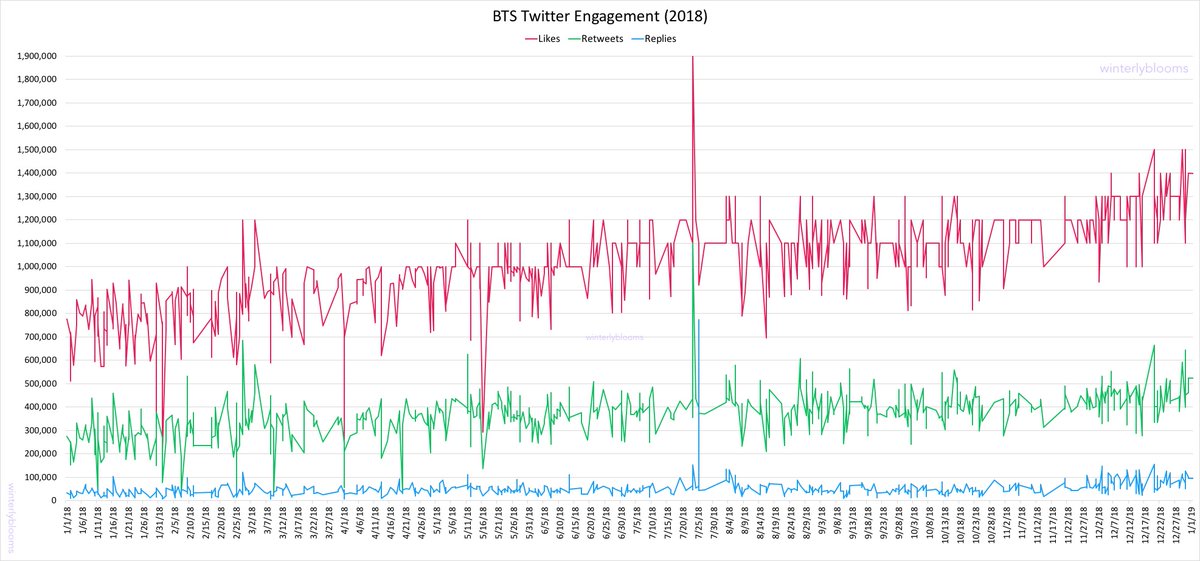
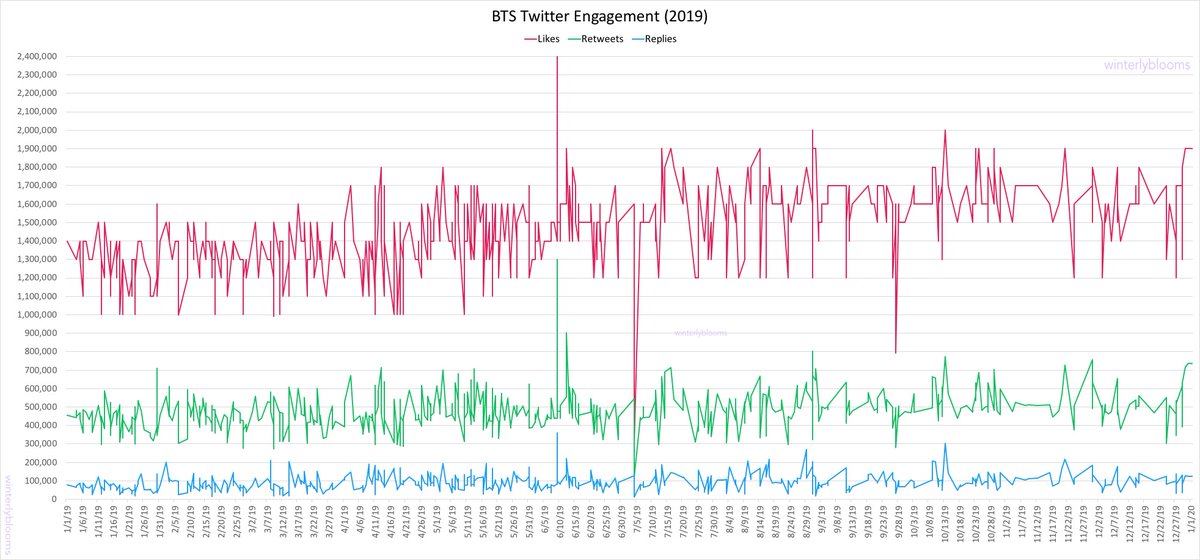
This is what I like to call the Main Graph, which illustrates in detail the likes, retweets and replies for every single @BTS_twt post I’ve collected data on.
6/x
6/x
If you’re curious about the detailed changes in @BTS_twt engagements for past years, then these graphs will help. When you look at them side by side, you can see how much the differences between the likes, retweets and replies have grown.
8/x
8/x
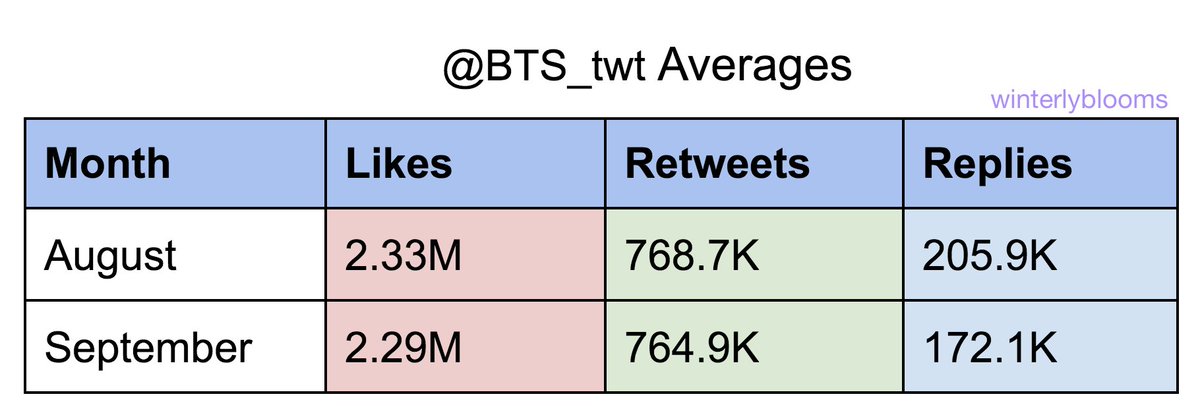
These graphs visualize @BTS_twt likes, retweets and replies averages since December 2015 until September 2020.
Here you can also see the slight decrease in engagements.
10/x
Here you can also see the slight decrease in engagements.
10/x
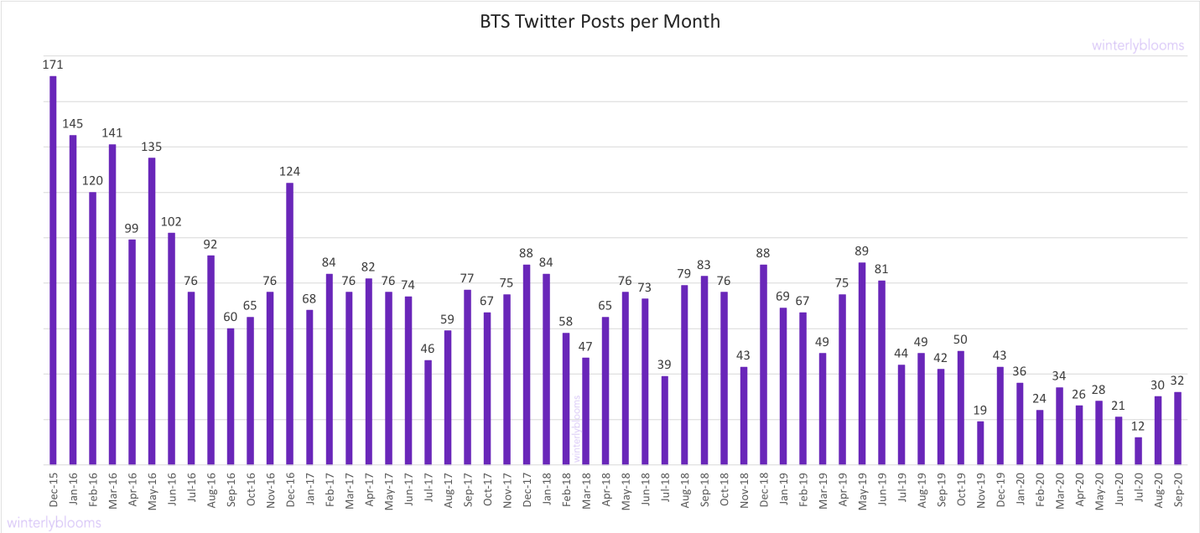
Before I explain why there is a slight decrease in engagements since July, check out this visualization of the number of @BTS_twt posts per month.
12/x
12/x
In July, @BTS_twt tweeted only 12 times. Since then, this has more than doubled. My guess is that there was a peak in July because they posted infrequently. They’ve begun to post more, so ARMY’s engagements are no longer as concentrated as it was in July.
13/x
13/x
While looking at older data, I noticed a noteworthy increase in @BTS_twt engagements between June 2016 and July 2016.
Whereas in previous months the likes would increase by about 20k, between these two months it increased almost 40k.
15/x
Whereas in previous months the likes would increase by about 20k, between these two months it increased almost 40k.
15/x
The only important events I could find that occurred in June were the 2016 KCon stages. It seems then that quite a few ARMYs were gained through these performances.
16/x
16/x
If you have any questions or suggestions, I’m more than happy to discuss!
As usual, I’ll update this thread next month. You can check out previous @BTS_twt updates and analyses here https://abs.twimg.com/emoji/v2/... draggable="false" alt="☺️" title="Lächelndes Gesicht" aria-label="Emoji: Lächelndes Gesicht"> https://twitter.com/winterlyblooms/status/1292732594015043585">https://twitter.com/winterlyb...
As usual, I’ll update this thread next month. You can check out previous @BTS_twt updates and analyses here

 Read on Twitter
![BTS Twitter Engagement (December 2015 – September 2020) [ Monthly update for #BTS_TwitterMetrics : thread of data visualizations of @BTS_twt engagements ]Let’s start with comparisons of likes, retweets and replies between 2019 & 20201/x BTS Twitter Engagement (December 2015 – September 2020) [ Monthly update for #BTS_TwitterMetrics : thread of data visualizations of @BTS_twt engagements ]Let’s start with comparisons of likes, retweets and replies between 2019 & 20201/x](https://pbs.twimg.com/media/EkNQ5bKWAAAcZ68.png)
![BTS Twitter Engagement (December 2015 – September 2020) [ Monthly update for #BTS_TwitterMetrics : thread of data visualizations of @BTS_twt engagements ]Let’s start with comparisons of likes, retweets and replies between 2019 & 20201/x BTS Twitter Engagement (December 2015 – September 2020) [ Monthly update for #BTS_TwitterMetrics : thread of data visualizations of @BTS_twt engagements ]Let’s start with comparisons of likes, retweets and replies between 2019 & 20201/x](https://pbs.twimg.com/media/EkNQ76gWoAAEydu.png)
![BTS Twitter Engagement (December 2015 – September 2020) [ Monthly update for #BTS_TwitterMetrics : thread of data visualizations of @BTS_twt engagements ]Let’s start with comparisons of likes, retweets and replies between 2019 & 20201/x BTS Twitter Engagement (December 2015 – September 2020) [ Monthly update for #BTS_TwitterMetrics : thread of data visualizations of @BTS_twt engagements ]Let’s start with comparisons of likes, retweets and replies between 2019 & 20201/x](https://pbs.twimg.com/media/EkNQ8z3WkAAYX0s.png)

