So I was very curious as to why people are so against transfers in college basketball.
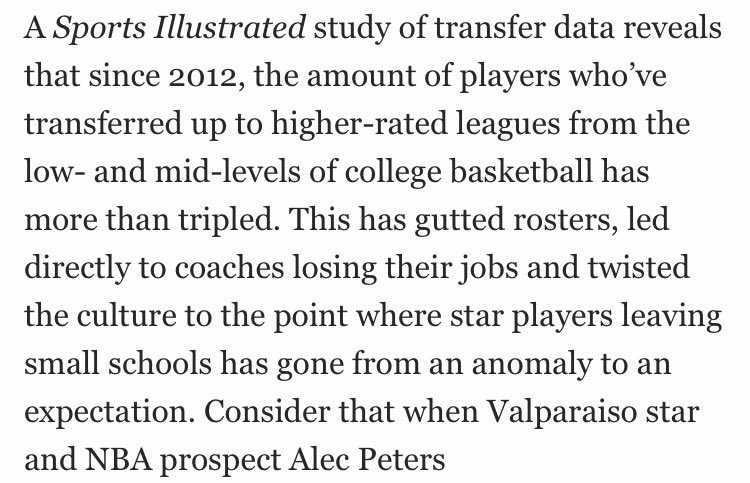
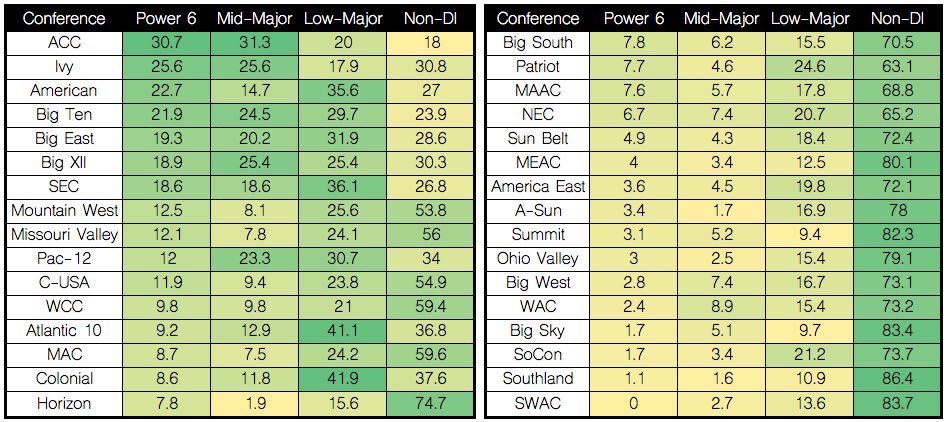
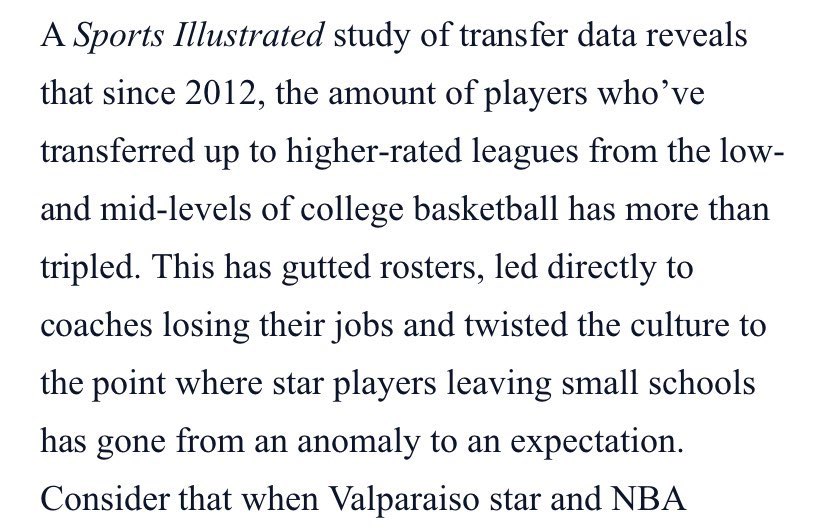
And the consensus I got was people believe that "up-transfers"(meaning athletes who started at mid-majors and went to the Power 5 are gutting rosters https://www.si.com/college/2017/03/14/college-basketball-transfers-cinderella-ncaa-tournament">https://www.si.com/college/2...
And the consensus I got was people believe that "up-transfers"(meaning athletes who started at mid-majors and went to the Power 5 are gutting rosters https://www.si.com/college/2017/03/14/college-basketball-transfers-cinderella-ncaa-tournament">https://www.si.com/college/2...
People believed that if this was allowed to continue that it would drastically affect the competition in College Basketball.
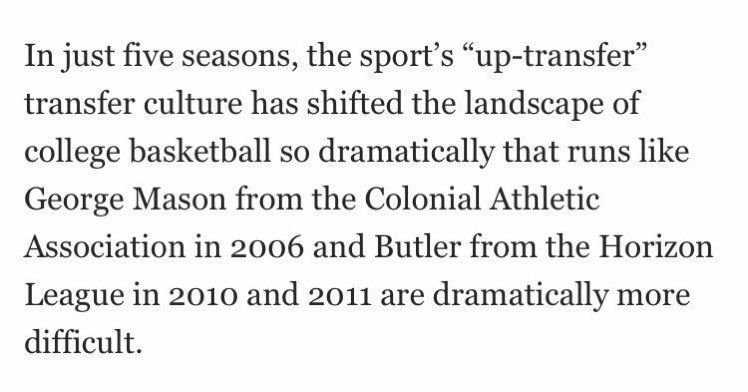
What& #39;s mentioned is that the trend of up-transfers had grown approximately 300% in the last 5 seasons and how could mid-majors survive if this was allowed to continue....
But this made me think. If up-transfers growth was around 300% what did down-transfers look like.
Well Down-transfers grew by about 200% in the same time period.....
And Down-Transfers outnumbered up-transfers by 140%. http://www.verbalcommits.com/transfers/2018 ">https://www.verbalcommits.com/transfers...
Well Down-transfers grew by about 200% in the same time period.....
And Down-Transfers outnumbered up-transfers by 140%. http://www.verbalcommits.com/transfers/2018 ">https://www.verbalcommits.com/transfers...
But since Down-Transfers are outnumbering up-transfers by a significant amount.
Why don& #39;t people believe that they are replenishing rosters? Why do people only believe power 5 schools are stealing talent?
Why don& #39;t people believe that they are replenishing rosters? Why do people only believe power 5 schools are stealing talent?
From 3 years ago. Taking a look at the 1,047 recruits that signed to play Division 1 Men& #39;s college basketball 222 of the Freshmen left their school and 825 continued to play at their original school.
This was 79% of players.
This was 79% of players.
168 players transferred. 16%.
41 players quit school or stayed at school and quit Basketball. 4%.
13 left to go play pro basketball. 1%
41 players quit school or stayed at school and quit Basketball. 4%.
13 left to go play pro basketball. 1%
Of the 168 that transferred.
32% transferred into a Division 1 school.
And 68% transferred out of Division 1 entirely.
18% transferred to Division 2.
2% transferred to Division 3.
49% transferred to Community College or NAIA.
32% transferred into a Division 1 school.
And 68% transferred out of Division 1 entirely.
18% transferred to Division 2.
2% transferred to Division 3.
49% transferred to Community College or NAIA.
In the 2018 season the B1G had 28 transfers from other 4 year Universities on their Men& #39;s Basketball rosters.
These players played a total of 7,316 minutes. This was 7.48% of the total minutes played in B1G.
These players played a total of 7,316 minutes. This was 7.48% of the total minutes played in B1G.
Michigan: 0 minutes/0.0% minutes played
Iowa: 0 minutes/0.0%
Maryland: 0 minutes/0.0%
Michigan State: 13 minutes/0.17%
Wisconsin: 55 minutes/0.79%
Penn State: 82 minutes/1.27%
Purdue: 299 minutes/4.1%
Illinois: 316 minutes/4.73%
Rutgers: 543 minutes/8.69%
Iowa: 0 minutes/0.0%
Maryland: 0 minutes/0.0%
Michigan State: 13 minutes/0.17%
Wisconsin: 55 minutes/0.79%
Penn State: 82 minutes/1.27%
Purdue: 299 minutes/4.1%
Illinois: 316 minutes/4.73%
Rutgers: 543 minutes/8.69%
Minnesota: 615 minutes/8.51%
Indiana: 744 minutes/10.48%
Ohio State: 983 minutes/13.99%
Northwestern: 1786 minutes/27.69%
Nebraska: 1880 minute/26.02%
Indiana: 744 minutes/10.48%
Ohio State: 983 minutes/13.99%
Northwestern: 1786 minutes/27.69%
Nebraska: 1880 minute/26.02%
In the 2018 season the SEC had 18 transfers from other 4 year Universities on their Men& #39;s Basketball rosters.
These players played a total of 8,635 minutes. This was 8.93% of the total minutes played in SEC.
These players played a total of 8,635 minutes. This was 8.93% of the total minutes played in SEC.
Alabama: 0 minutes/0%
Mississippi St: 0 minutes/0%
Georgia: 0 minutes/0%
Tennessee: 0 minutes/0%
Ole Miss: 604 minutes/9.12%
Texas A&M: 589 minutes/9.2%
LSU: 741 minutes/10.33%
Florida: 811 minutes/11.15%
Auburn: 969 minutes/12%
Missouri: 782 minutes/12.12%
Mississippi St: 0 minutes/0%
Georgia: 0 minutes/0%
Tennessee: 0 minutes/0%
Ole Miss: 604 minutes/9.12%
Texas A&M: 589 minutes/9.2%
LSU: 741 minutes/10.33%
Florida: 811 minutes/11.15%
Auburn: 969 minutes/12%
Missouri: 782 minutes/12.12%
Kentucky: 914 minutes/12.27%
South Carolina: 866 minutes/13.48%
Arkansas: 1046 minutes/15.27%
Vanderbilt: 1313 minutes/20.44%
South Carolina: 866 minutes/13.48%
Arkansas: 1046 minutes/15.27%
Vanderbilt: 1313 minutes/20.44%
In the 2018 season the Big 12 had 22 transfers from other 4 year Universities on their Men& #39;s Basketball rosters.
These players played a total of 13,741 minutes. This was 19.33% of the total minutes played in Big 12.
These players played a total of 13,741 minutes. This was 19.33% of the total minutes played in Big 12.
Oklahoma: 0 Minutes/0%
Kansas State: 9 minutes/0.13%
Oklahoma State: 504 minutes/7.84%
West Virginia: 905 minutes/12.4%
TCU: 1290 minutes/17.2%
Texas: 1680 minutes/22.47%
Kansas: 1980 minutes/27.22%
Iowa State: 2152 minutes/30.74%
Kansas State: 9 minutes/0.13%
Oklahoma State: 504 minutes/7.84%
West Virginia: 905 minutes/12.4%
TCU: 1290 minutes/17.2%
Texas: 1680 minutes/22.47%
Kansas: 1980 minutes/27.22%
Iowa State: 2152 minutes/30.74%
Baylor: 2166 minutes/31.74%
Texas Tech: 3055 minutes/39.93%
Texas Tech: 3055 minutes/39.93%
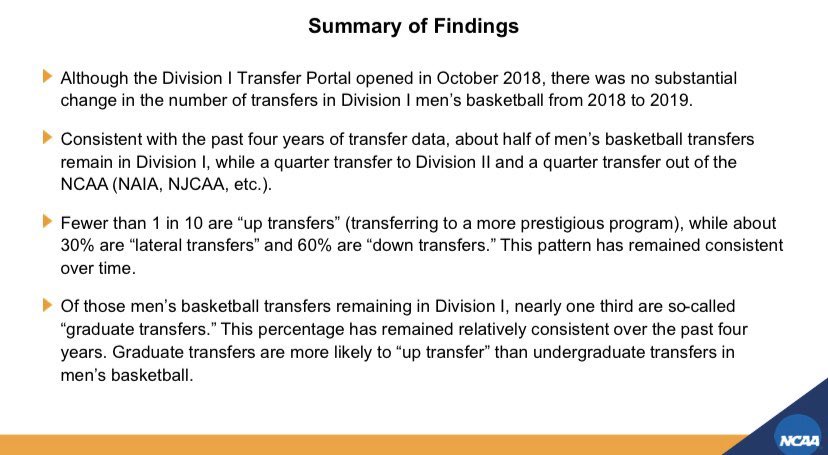
As mentioned previously there is no significant data that had shown us that transfer rates had climbed at any significant rate.
1. There was no significant change in the amount of transfers.
2. About 50% of transfers do so out of Division 1 entirely.
3. About 10% are “up-transfers”
2. About 50% of transfers do so out of Division 1 entirely.
3. About 10% are “up-transfers”
As Mid-Majors continue to sell us that the power 5 schools are stealing or attempting to steal all of their players.
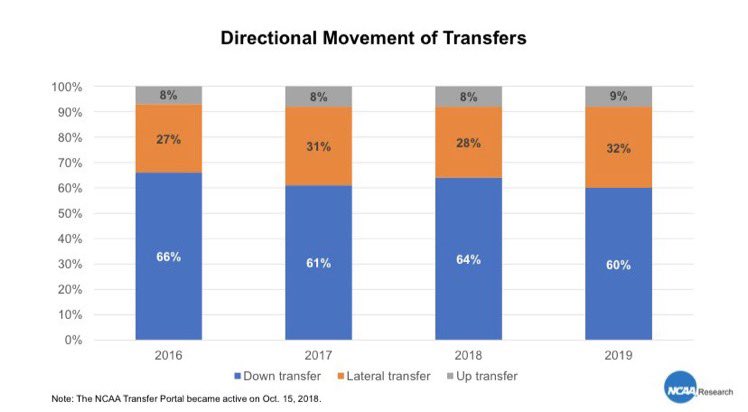
Data shows us that 60% of transfers were down transfers. (With 46% of those transfers being out of Division 1 entirely)
And only 9% were up-transfers.
Data shows us that 60% of transfers were down transfers. (With 46% of those transfers being out of Division 1 entirely)
And only 9% were up-transfers.
In the 2019 season the B1G had 27 transfers from other 4 year Universities on their Men& #39;s Basketball rosters.
These players played a total of 10,685 minutes. This was 12.17% of the total minutes played in B1G.
These players played a total of 10,685 minutes. This was 12.17% of the total minutes played in B1G.
Michigan: 0 minutes/0%
Ohio State: 0 minutes/0%
Maryland: 0 minutes/0%
Michigan State: 12 minutes/0.19%
Illinois: 48 minutes/0.77%
Iowa: 567 minutes/9.15%
Indiana: 627 minutes/9.76%
Wisconsin: 748 minutes/12.02%
Rutgers: 760 minutes/12.16%
Nebraska: 1029 minutes/15.77%
Ohio State: 0 minutes/0%
Maryland: 0 minutes/0%
Michigan State: 12 minutes/0.19%
Illinois: 48 minutes/0.77%
Iowa: 567 minutes/9.15%
Indiana: 627 minutes/9.76%
Wisconsin: 748 minutes/12.02%
Rutgers: 760 minutes/12.16%
Nebraska: 1029 minutes/15.77%
Penn State: 1217 minutes/19.63%
Purdue: 1304 minutes/20.54%
Northwestern: 1641 minutes/26.26%
Minnesota: 2732 minutes/43.71%
Purdue: 1304 minutes/20.54%
Northwestern: 1641 minutes/26.26%
Minnesota: 2732 minutes/43.71%
As we continue to work through transfers, what is continuously sold to us is that mid major programs are hurt significantly by “transfer” culture...
And suggest that schools like Valpo will struggle going forward as Cinderella stories in the tourney become a thing of the past.
And suggest that schools like Valpo will struggle going forward as Cinderella stories in the tourney become a thing of the past.
Though Coaches continue to say that they don’t want players to transfer because they want to see them stay to learn life lessons about “overcoming adversity”...
So let’s use Valpo as an example to see what’s happening at these schools.
So let’s use Valpo as an example to see what’s happening at these schools.
Valpo Men’s Basketball from 2012(the year they used their study from) till 2018 had 9 players transfer out.
2012: None
2013: 1 NAIA school
2014: None
2015: 1 ACC(up Transfer)
2016: 1 Mountain West
2017: 1 JUCO & 1 CAA
2018: 1 SWAC, 1 AAC, 1 Big East & 1 NAIA baseball
2012: None
2013: 1 NAIA school
2014: None
2015: 1 ACC(up Transfer)
2016: 1 Mountain West
2017: 1 JUCO & 1 CAA
2018: 1 SWAC, 1 AAC, 1 Big East & 1 NAIA baseball
3 transferred down, 3 transferred laterally, 2 transferred up and 1 chose to play another sport at a non-NCAA institution.
Since these Coaches and Writers were so against transferring I wanted to see how many transfers they had on their teams on any given year.
Since these Coaches and Writers were so against transferring I wanted to see how many transfers they had on their teams on any given year.
2012: 7 transfers on roster
2013: 7 transfers on roster
2014: 6 transfers on roster
2015: 5 transfers on roster
2016: 4 transfers on roster
2017: 4 transfers on roster
2018: 6 transfers on roster
As Coaches scream from the mountain tops that transfers are bad, they bring them in
2013: 7 transfers on roster
2014: 6 transfers on roster
2015: 5 transfers on roster
2016: 4 transfers on roster
2017: 4 transfers on roster
2018: 6 transfers on roster
As Coaches scream from the mountain tops that transfers are bad, they bring them in
I went out and got 4-4 transfer data over the last 15 years.
For those of you that don’t know what 4-4 means, I will define it.
For those of you that don’t know what 4-4 means, I will define it.
I’ve seen the transfer data for we will use(Football) at 14.7% but this also includes 2-4 data which sits at 10%.
A 2-4 transfer is a player who is coming from community college and going to a 4 year University.
A 4-4 is a player who is going from University to a 4 yr Uni.
A 2-4 transfer is a player who is coming from community college and going to a 4 year University.
A 4-4 is a player who is going from University to a 4 yr Uni.
So I thought we’d see what the trends are.
There are 5 sports with transfer restrictions in Division 1 sports.
Football
M Basketball
W Basketball
Baseball
M Hockey
The current transfer rates of these sports are.
 https://abs.twimg.com/emoji/v2/... draggable="false" alt="🏈" title="American Football" aria-label="Emoji: American Football"> 4.6%
 https://abs.twimg.com/emoji/v2/... draggable="false" alt="🏀" title="Basketball" aria-label="Emoji: Basketball"> 15.3%
 https://abs.twimg.com/emoji/v2/... draggable="false" alt="🏀" title="Basketball" aria-label="Emoji: Basketball"> 11.9%
 https://abs.twimg.com/emoji/v2/... draggable="false" alt="⚾️" title="Baseball" aria-label="Emoji: Baseball"> 2.3%
 https://abs.twimg.com/emoji/v2/... draggable="false" alt="🏒" title="Eishockeyschläger und -puck" aria-label="Emoji: Eishockeyschläger und -puck"> 6.7%
There are 5 sports with transfer restrictions in Division 1 sports.
Football
M Basketball
W Basketball
Baseball
M Hockey
The current transfer rates of these sports are.
The 5 highest transfer sports in Division 1 athletics are
Men’s Soccer: 18.6%
Men’s Basketball: 15.3%
Women’s Tennis: 14.1%
Men’s Tennis: 13.8%
Women’s Basketball: 11.9%
Men’s Soccer: 18.6%
Men’s Basketball: 15.3%
Women’s Tennis: 14.1%
Men’s Tennis: 13.8%
Women’s Basketball: 11.9%
Sports that have had the highest jump in transfers since 2004
Men’s Soccer: 7%
Men’s Basketball: 5.7%
Women’s Basketball: 4.4%
Men’s Hockey: 3%
Softball: 2.9%
Men’s Soccer: 7%
Men’s Basketball: 5.7%
Women’s Basketball: 4.4%
Men’s Hockey: 3%
Softball: 2.9%

 Read on Twitter