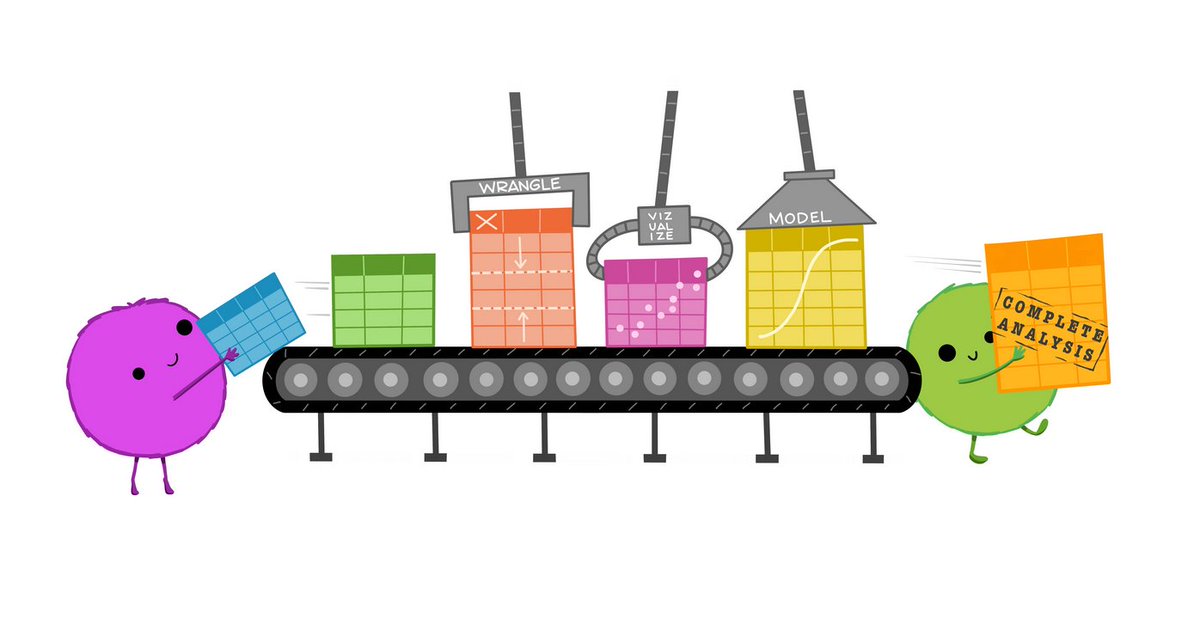
. @allison_horst and I created an illustrated series about tidy data and why it’s such a powerful concept for data analysis. Tidy data helps you be more efficient, reproducible, and collaborative. Why? Thread 1/9:
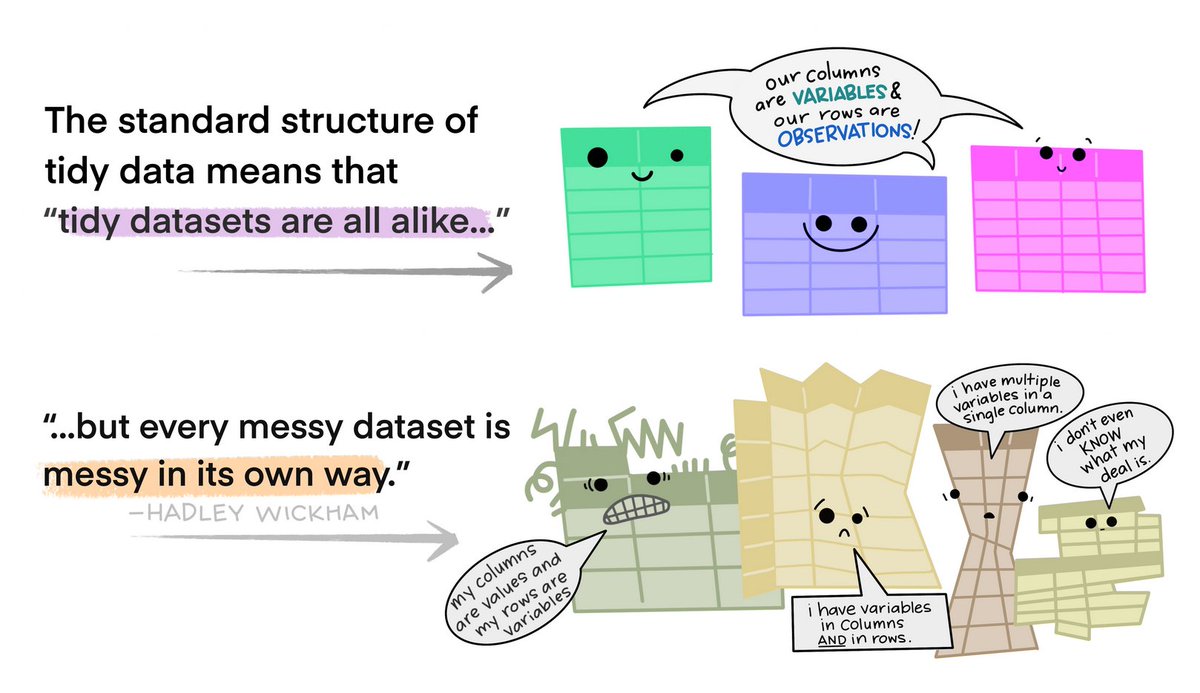
First, what is tidy data? Tidy data is a way to describe data that’s organized with a particular structure – a rectangular structure, where each variable has its own column, and each observation has its own row 2/9
This standard structure of tidy data led Hadley Wickham to describe it the way Leo Tolstoy describes families. Tolstoy says “Happy families are all alike; every unhappy family is unhappy in its own way”. 3/9
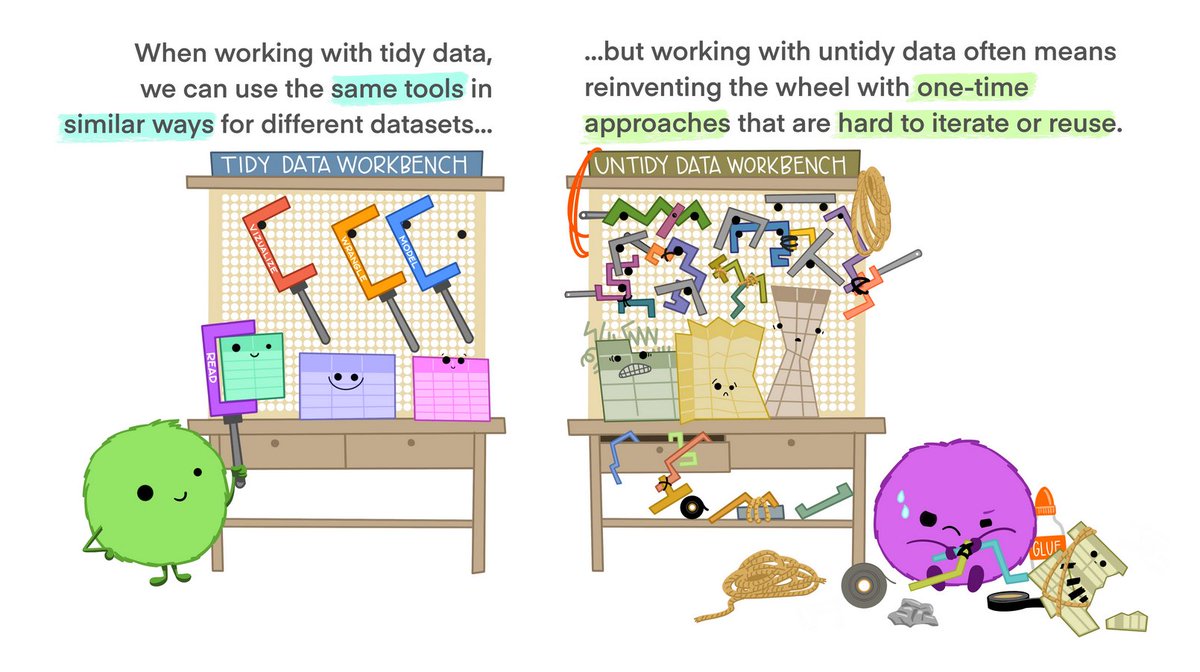
Tidy data allows you to be more efficient by using existing tools deliberately built to do the things you need to do. Using existing tools saves you from building from scratch each time you work with a new dataset. 4/9
Tidy data makes it easier to collaborate bc others can use the same tools in a familiar way. Collaborators can be current teammates, your future self, or future teammates. Organizing & sharing data in a consistent, predictable way means less adjustment, time & effort for all 5/9
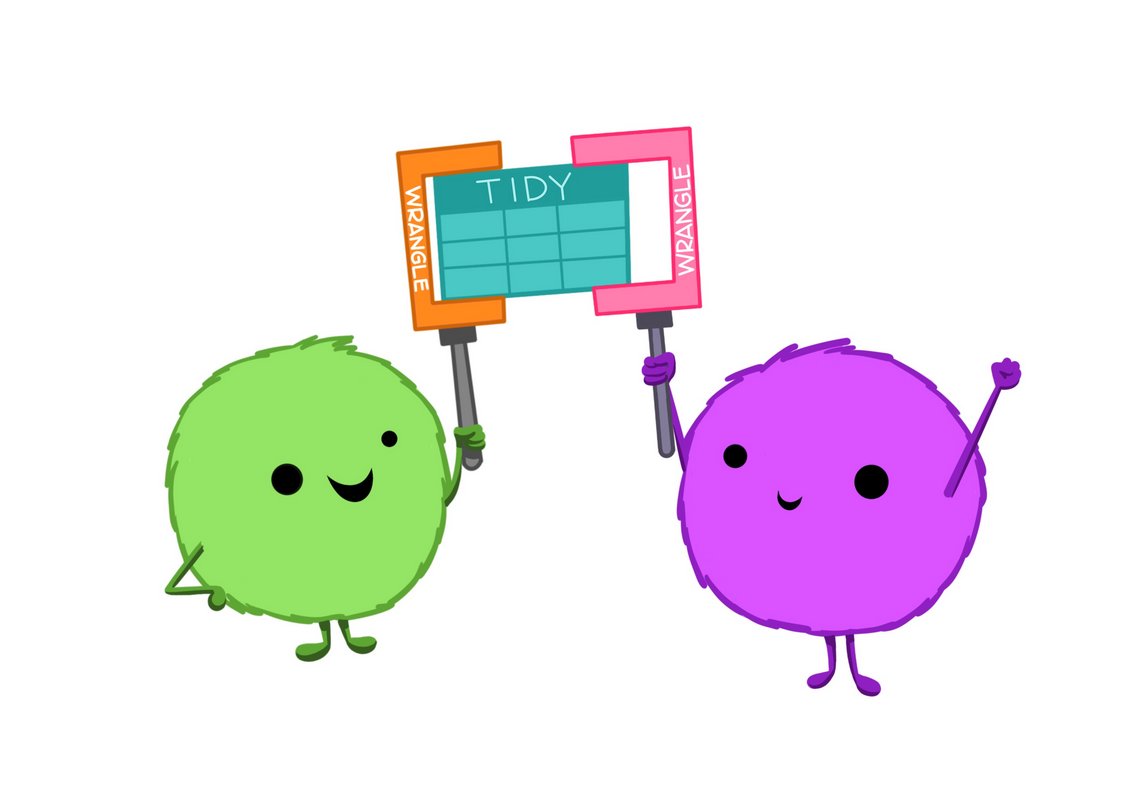
Tidy data also makes it easier to reproduce analyses bc they are easier to understand, update, & reuse. By using tools together that all expect tidy data, you can build really powerful workflows. And when you have additional data entries, it’s no problem to re-run your code! 6/9
Once you are empowered with tools to work with tidy data, it opens up a whole new world of datasets that feel more approachable because you can work using familiar tools. This transferrable confidence and ability to collaborate might just be the best thing about tidy data. 7/9
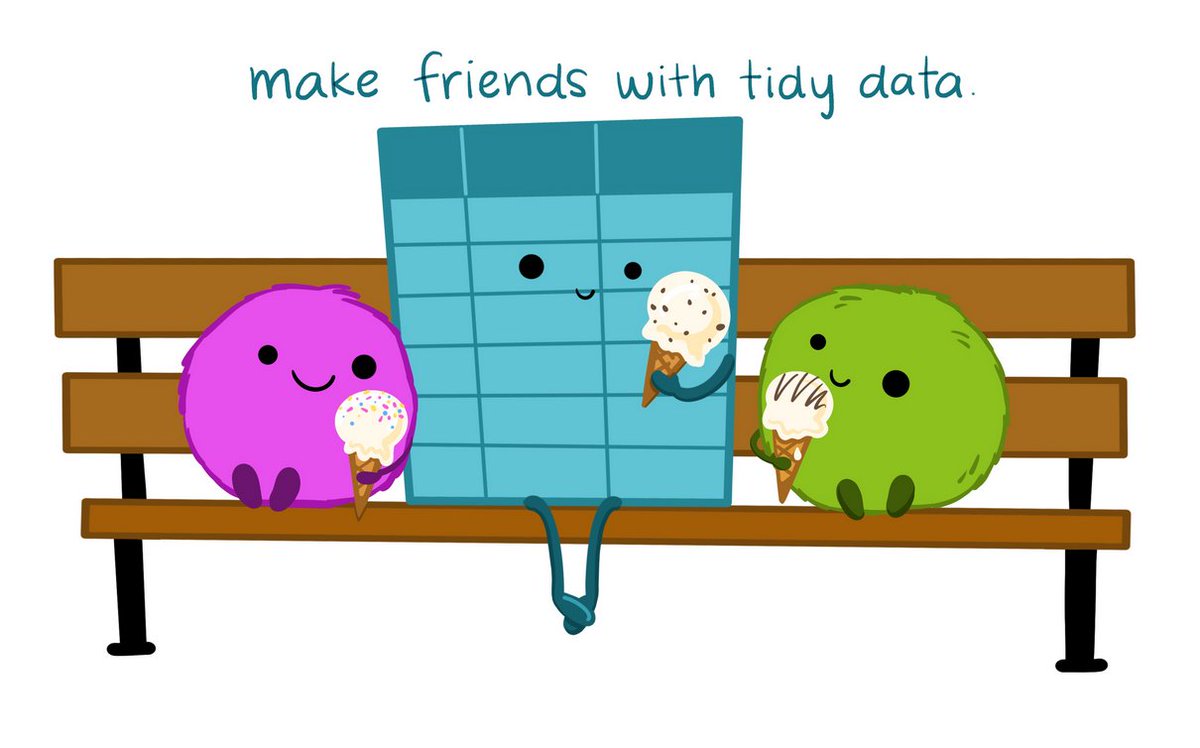
Make friends with tidy data!
@allison_horst’s illustrations are available for reuse: http://github.com/allisonhorst/stats-illustrations">https://github.com/allisonho...
Read this thread on the @openscapes blog: http://openscapes.org/blog/2020/10/12/tidy-data">https://openscapes.org/blog/2020... 8/9
@allison_horst’s illustrations are available for reuse: http://github.com/allisonhorst/stats-illustrations">https://github.com/allisonho...
Read this thread on the @openscapes blog: http://openscapes.org/blog/2020/10/12/tidy-data">https://openscapes.org/blog/2020... 8/9
Learn more about tidy data 9/9:
Wickham (2014). Tidy Data. Journal of Statistical Software. http://jstatsoft.org/v59/i10
Broman">https://jstatsoft.org/v59/i10&q... & Woo (2018). Data Organization in Spreadsheets. https://peerj.com/preprints/3183/
Grolemund">https://peerj.com/preprints... & Wickham (2016). R for Data Science: Ch 12 https://r4ds.had.co.nz"> https://r4ds.had.co.nz
Thanks everyone, yay #tidydata! @allison_horst & I are super happy you like them. Here they are as google slides (with presentation notes) if this is an easier format to remix/reuse: https://docs.google.com/presentation/d/1N7hKepabvl9OrHjvGJWPjUsfzVdB5xzV5AsFndgSwms/edit?usp=sharing">https://docs.google.com/presentat...

 Read on Twitter