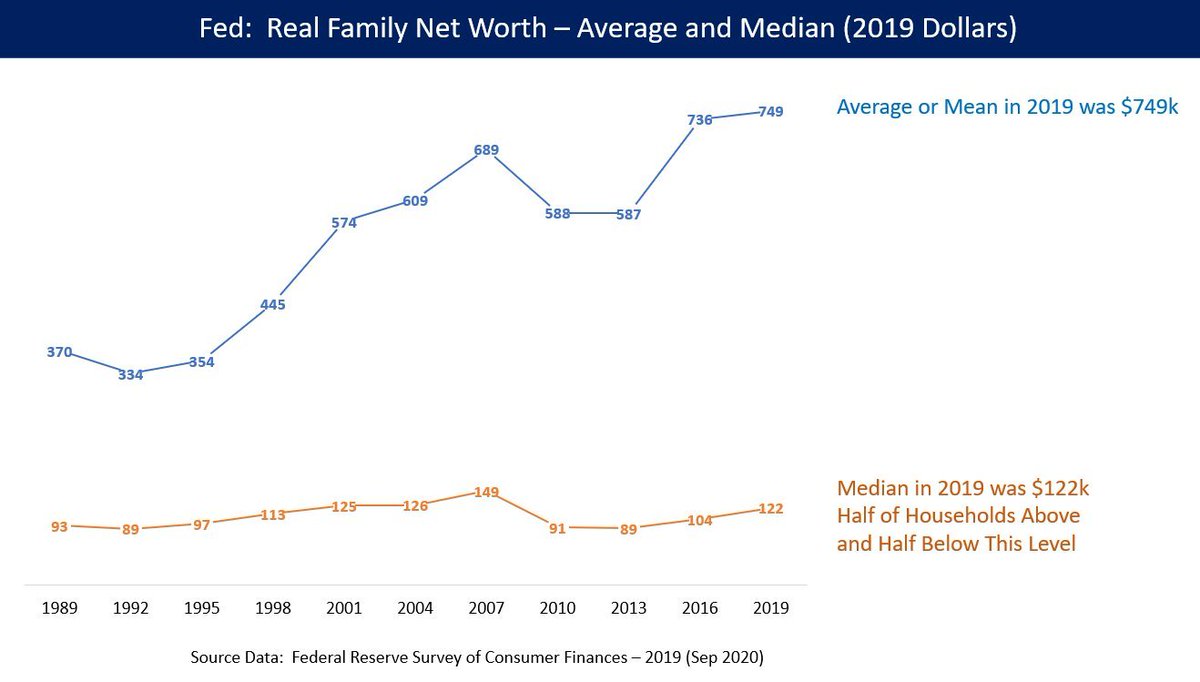
THREAD: Let& #39;s talk wealth inequality. Fed recently reported that avg. U.S. family had $749,000 net worth in 2019, but median family had $122,000.
Median means half of families have more, and half have less. When Bill Gates is in the room, avg. goes up, median doesn& #39;t. 1/
Median means half of families have more, and half have less. When Bill Gates is in the room, avg. goes up, median doesn& #39;t. 1/
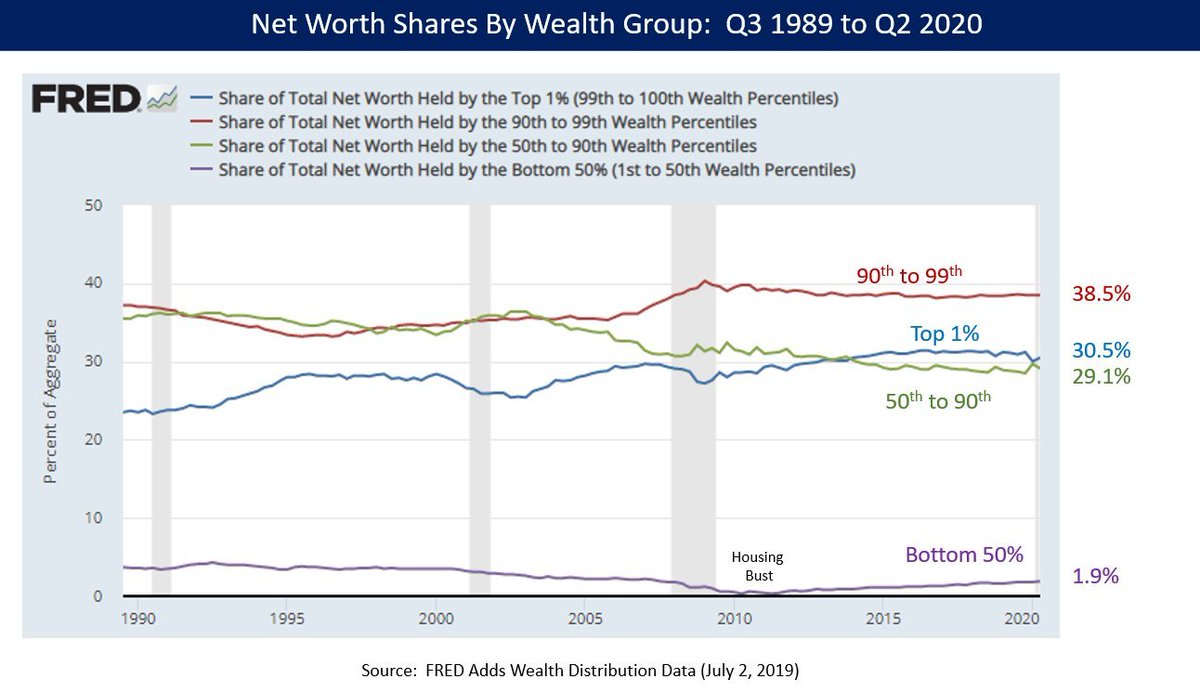
We can see the trends in share of net worth in four wealth groups, from Q3 1989 to Q2 2020:
Top 1% wealthiest has 30.5% of the net worth
90th to 99th has 38.5%
50th to 90th has 29.1%
Bottom 50% has 1.9% 2/
Top 1% wealthiest has 30.5% of the net worth
90th to 99th has 38.5%
50th to 90th has 29.1%
Bottom 50% has 1.9% 2/
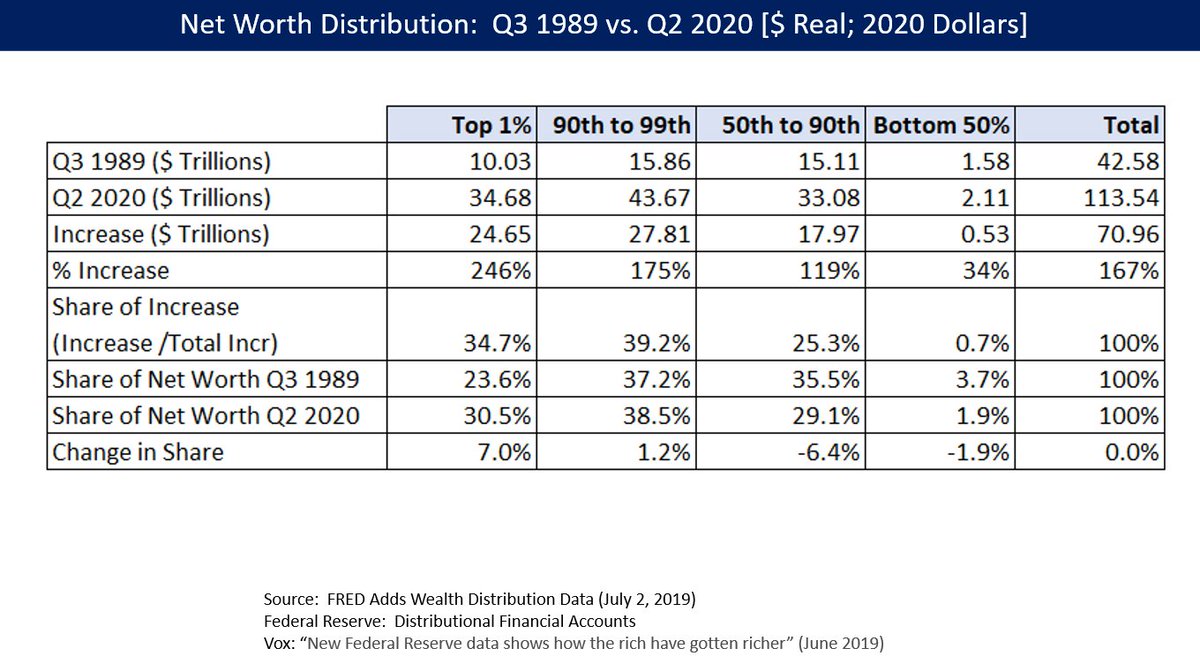
How did share of net worth change 1989-2020?
Top 1% +7.0 percentage points since 1989
90th to 99th +1.2
50th to 90th -6.4
Bottom 50% -1.9
The top 10% saw their share of net worth go up, while the lower 90% lost share.
<1% of the net worth gains went to bottom 50%. 3/
Top 1% +7.0 percentage points since 1989
90th to 99th +1.2
50th to 90th -6.4
Bottom 50% -1.9
The top 10% saw their share of net worth go up, while the lower 90% lost share.
<1% of the net worth gains went to bottom 50%. 3/
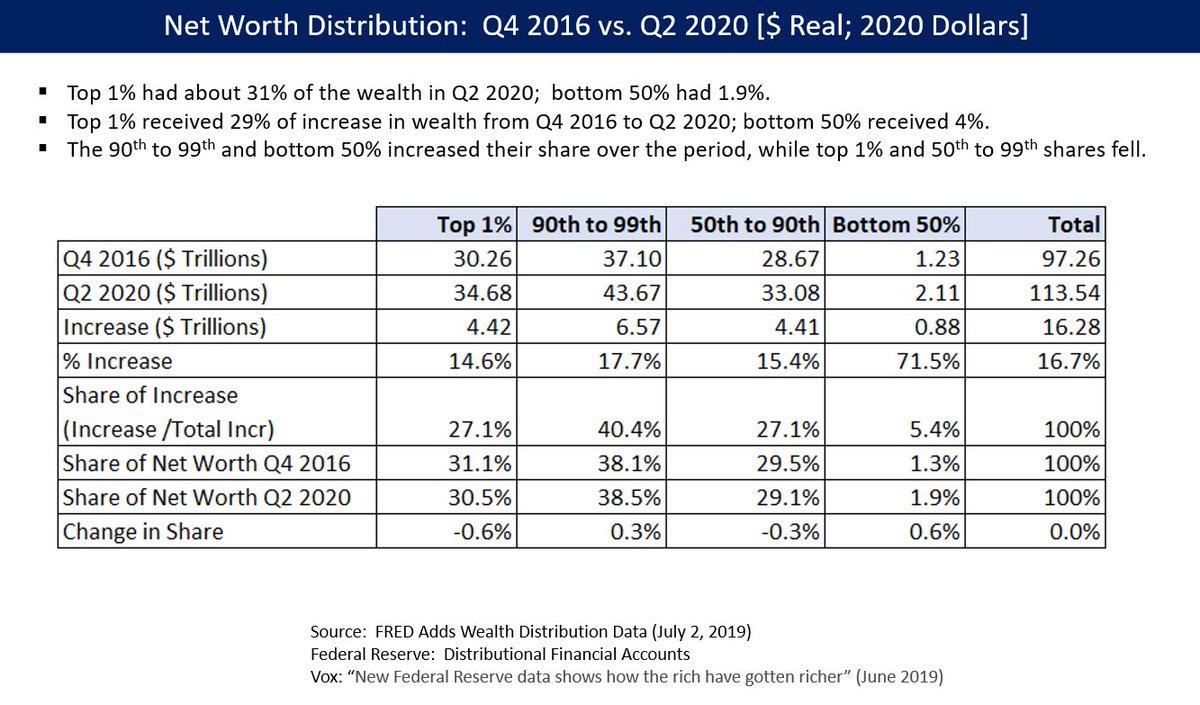
During the Trump era, the 90th to 99th and bottom 50% have seen gains in net worth share. The bottom 50% got 5.4% of increase in U.S. net worth. 4/
Matt Yglesias explained these trends through 2019. The top 10% own about 90% of the stock, and the bottom 50% own almost none. The bottom 50% have their wealth in their homes; they took a big hit from the Great Recession. 5/ https://www.vox.com/policy-and-politics/2019/6/13/18661837/inequality-wealth-federal-reserve-distributional-financial-accounts">https://www.vox.com/policy-an...
I deleted a prior version of this thread as I made an error on one of the tables.

 Read on Twitter


