(1/n) Tweetorial…When people talk about a trial “stopping early”, that implies there is an “on time”. Standard trials really “look late”, and interim analyses bridge the gap. Examples in terms of the current vaccine trials. Based on
https://www.berryconsultants.com/berry-consultants-webinar-on-sars-cov-2-vaccine-trials/">https://www.berryconsultants.com/berry-con...
https://www.berryconsultants.com/berry-consultants-webinar-on-sars-cov-2-vaccine-trials/">https://www.berryconsultants.com/berry-con...
(2/n) Data is noisy…a good therapy can look bad early in a trial, and a null(dud) therapy can look good. A lot of statistical theory is dedicated to quantifying this range. When can we be “sure” the data is good enough the drug isn’t a dud? When can we be “sure” it works?
(3/n) As a wise person once said “Statistics means never saying you’re certain”. This isn’t a rip on statisticians, it’s reality. Everything here is probabilistic. Hence we focus on error rates, often the usual 2.5% type I error, 90% power, or Bayesian posterior probabilities.
(4/n) So let’s start some graphs, show how the usual sample size calculation happens, and show why it’s done REALLY late. It’s a massive insurance policy against bad luck. In most trials the answer is clear before the maximal sample size is reached.
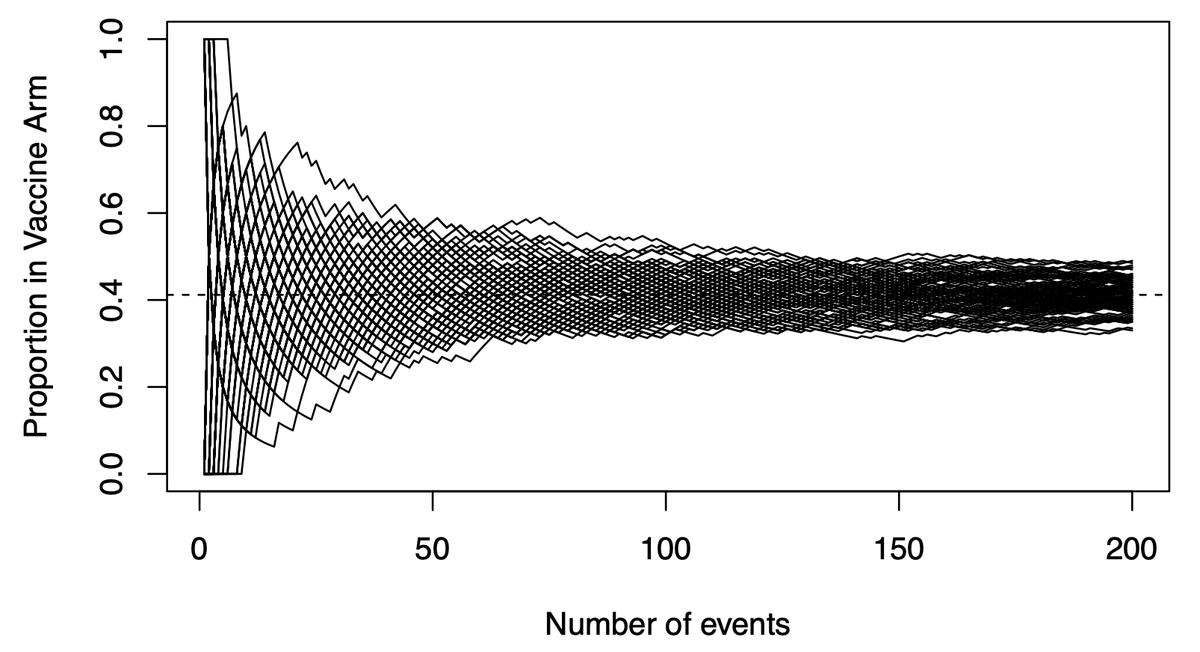
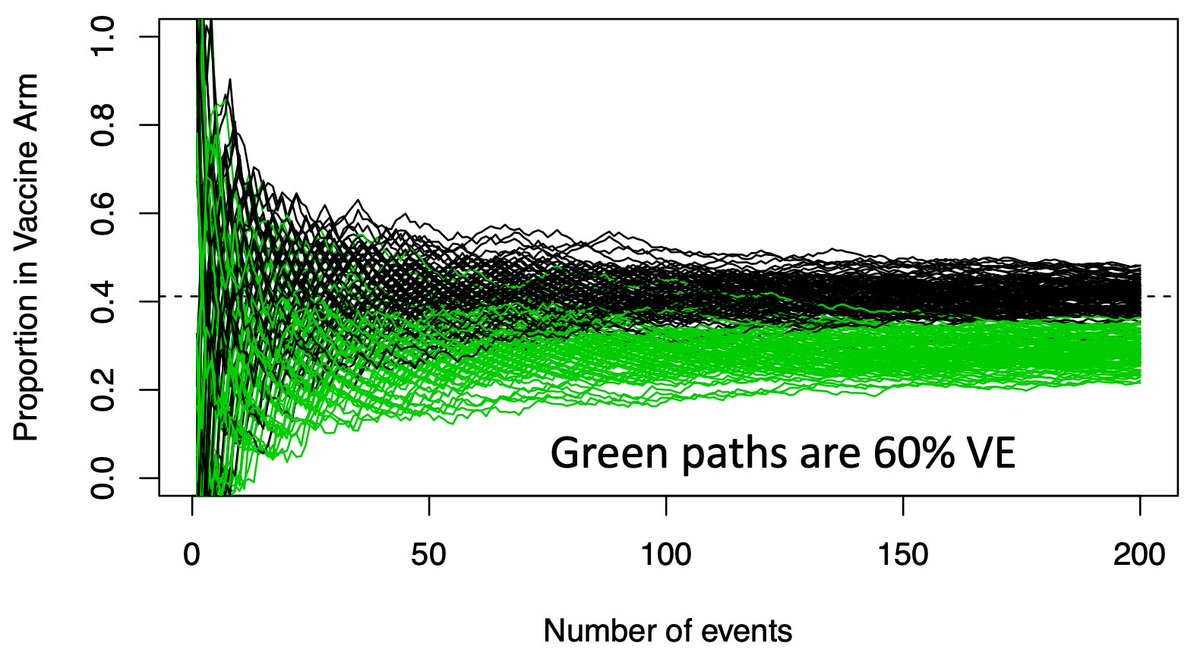
(5/n) This graph shows potential vaccine efficacy (VE) data in the current trials. X-axis is accumulating events (infections), Y-axis is the proportion in the trmt arm. There are 100 paths listed, representing 100 potential paths that might be taken by a null (VE=30%) vaccine.
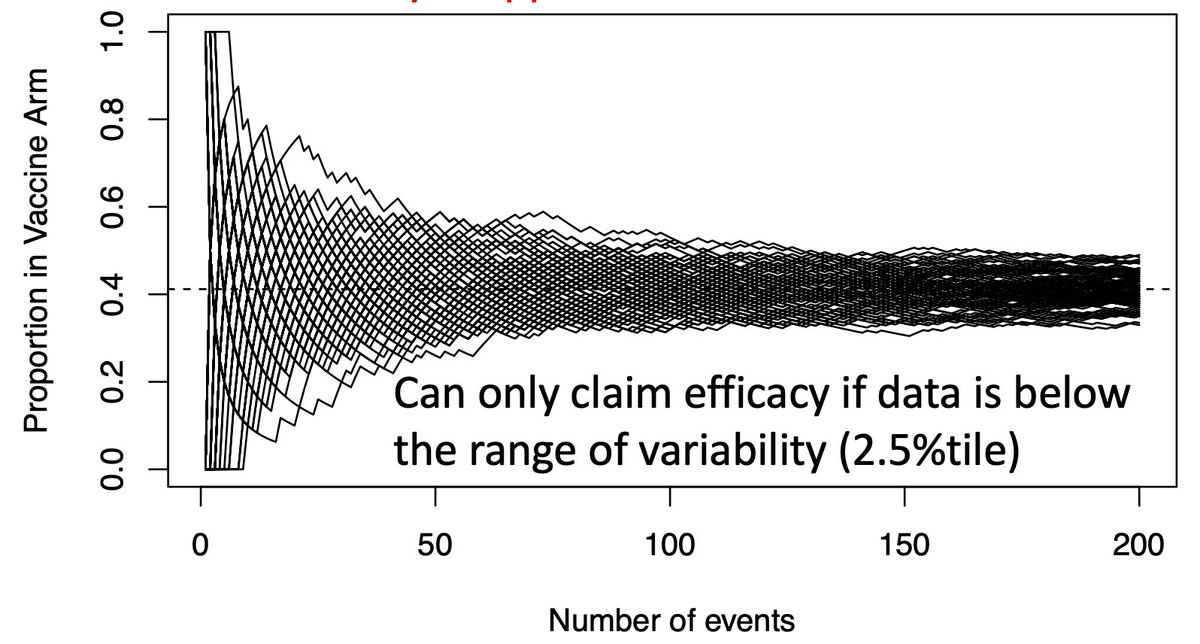
(6/n) To limit our chance of falsely declaring a VE=30% vaccine efficacious (we want 50% or more), we need our observed data to be below the black paths that might be taken by a dud vaccine. Below that we become confident the vaccine actually works.
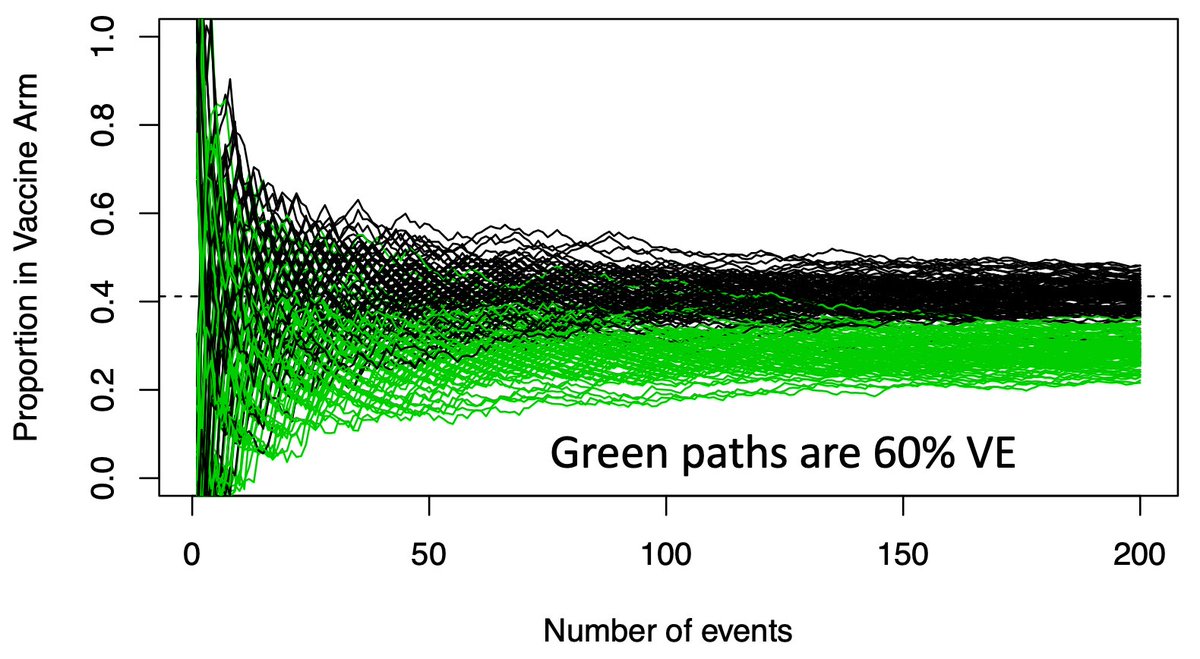
(7/n) Now we overlay the paths a good vaccine (VE=60%) might take in green. Again lots of early variance, with some of these good vaccines looking like duds early, but they eventually all separate from the black paths.
(8/n) If we only look once, when should we look? We wait a long time, until the green and black paths are nearly separated (usually when the 90th %tile of the green is equal the 2.5th %tile of the black, producing our usual error rates). Here that requires about 150-160 events.
(9/n) Why do we wait this long? If we can only look once, we don’t want to end up with data in the overlapping green/black region, where it’s inconclusive. We want an answer…and we wait a long time to get a high probability of obtaining one.
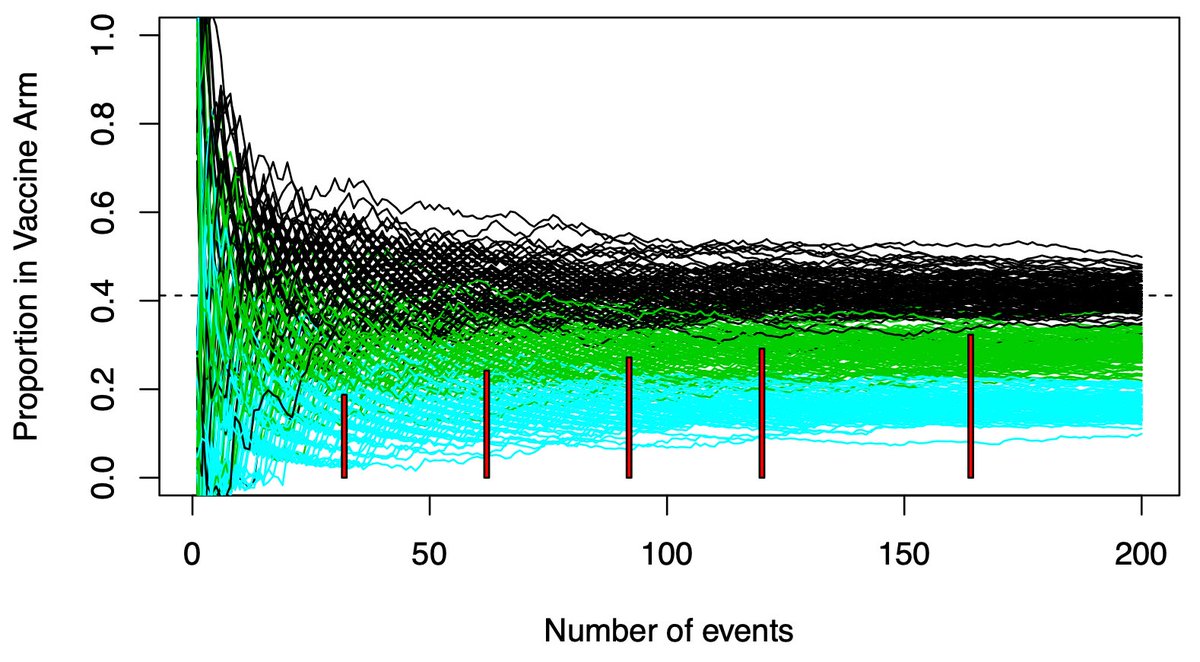
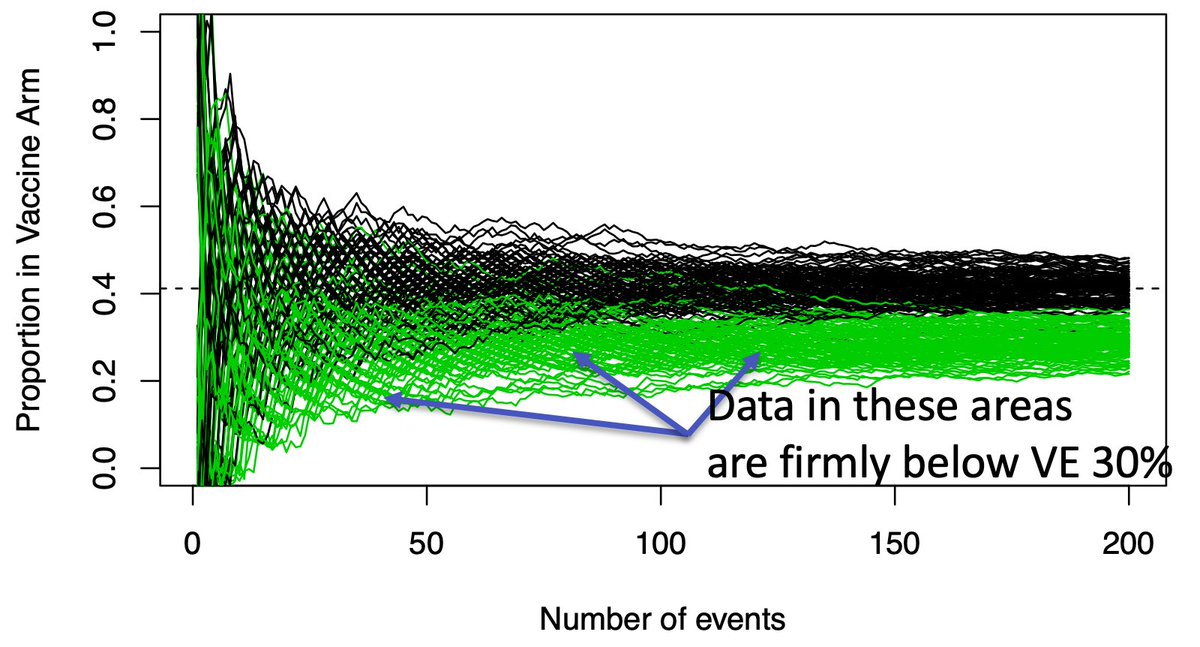
(10/n) Waiting for the overlap to disappear ignores a LOT of paths where the answer is quite clear far earlier. While there is overlap at 50 events, a sizable amount of the green paths are well below the black path range. These are clearly effective vaccines.
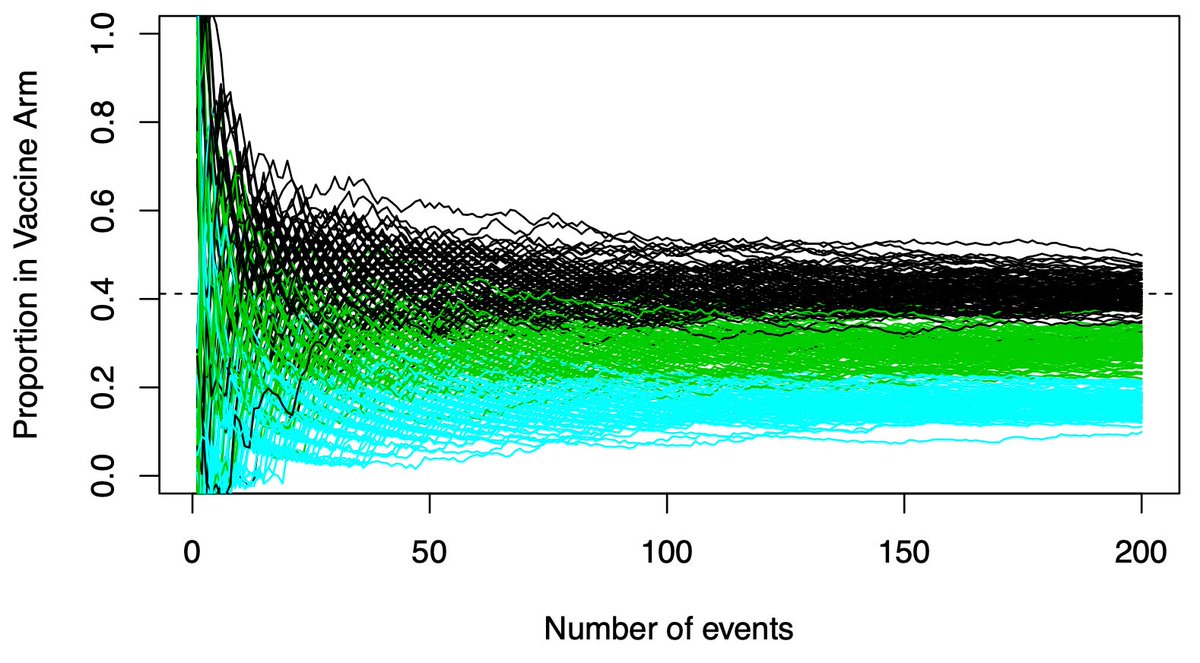
(11/n) Importantly, we don’t know the only possibilities are VE=30% and VE=60%. A VE=80% vaccine would separate much earlier. Those paths are shown in blue. Clear early separation from the black (VE=30%) paths.
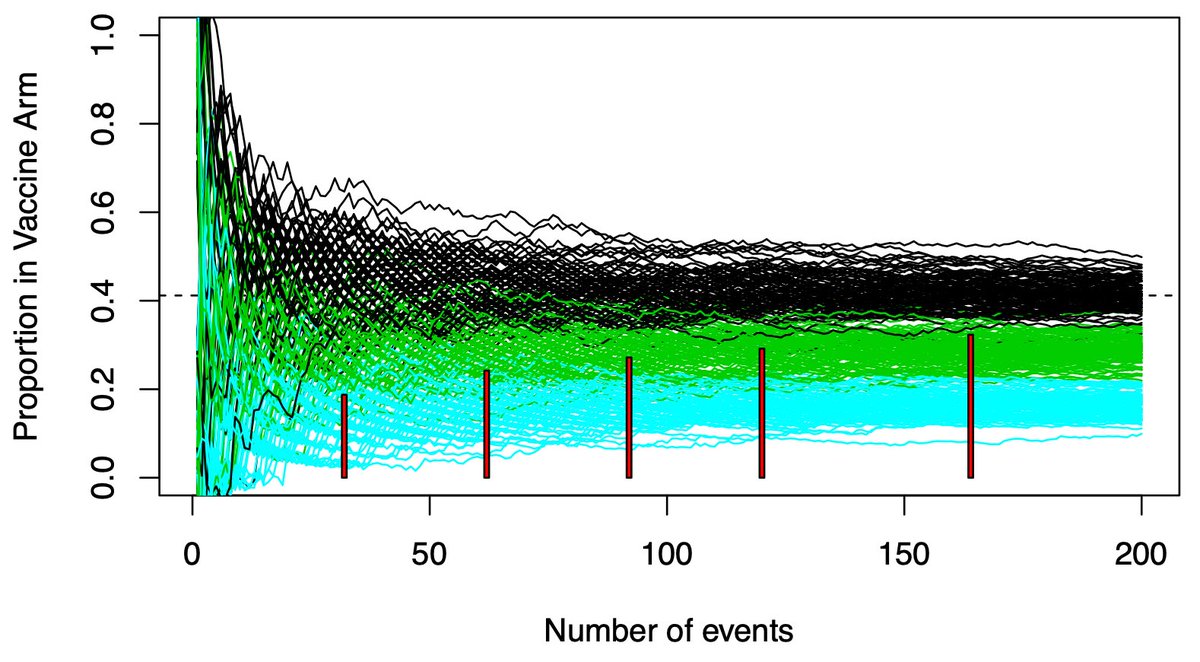
(12/n) We need to have analyses all the way to 150-160 events for those paths that separate late. But we don’t need to wait if the conclusion is clear sooner. Interim analyses for efficacy identify clearly efficacious paths. Futility analyses stop trials that are firmly “duds”.
(13/n) Pfizer’s vaccine trial has 4 interims. The red rectangles show where they will stop the trial. All of them are below the black range of variability. For efficacy, why wait for N=150-160? 150-160 is an insurance policy against bad luck. Bad luck doesn’t always happen.
(14/n) Two big caveats….you need to maintain the overall 2.5% type 1 error rate. Looking multiple times makes that calculation more complex. All the major vaccine trials utilize well established formulas to maintain the same error rate as a trial with no interims.
(15/n) Second caveat is safety. The earliest stops likely come with limited followup data. This is why the FDA is pushing for sufficient 2 month followup. The interims will show efficacy, but you also need safety.
(16/n) Janssen has a nice feature which incorporates both. They allow for weekly interims, but they only start once sufficient 2 month followup is obtained. With FDA putting a stake in the ground, the other trials will need to also place such a constraint on their interims.
(17/n) Summary…our usual sample sizes are likely “late”, not “on time”. We are waiting for the overlap between good/bad therapies to diminish. Interims allow you to conclude efficacy for those many paths which separate prior to the maximal sample size.
(18/18) Looking forward to @ADAlthousePhD & #39;s forthcoming thread on interim analyses, which may address issues related to estimation (I& #39;ve focused exclusively on testing)

 Read on Twitter