Where do I start? Not sure it says 30% of exposure is in pubs bars & restaurants. But also can& #39;t tell what it does actually say as it& #39;s really not clear about what the figures represent. Also note the scientific approach of "other countries are doing it". https://twitter.com/singharj/status/1314179590412271617">https://twitter.com/singharj/...
Do these % exclude the education/work settings that the title has said the gov& #39;t wants to keep open? Is the missing 41% in these figures those settings, or are there other even smaller ones that have been omitted? Also why is "hospitality" work setting still included then?
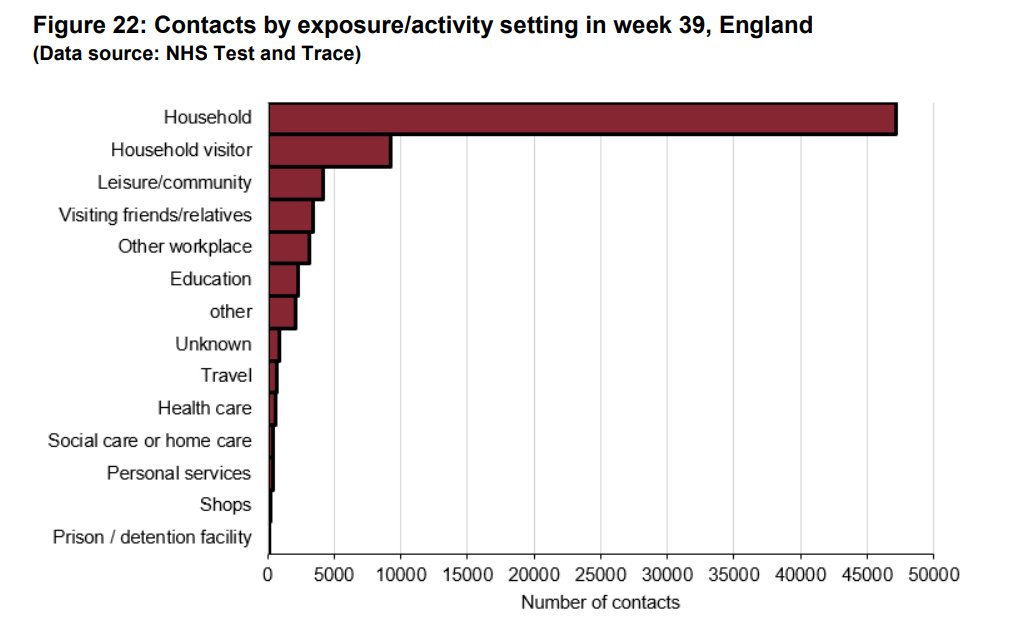
How does it fit with this chart from last week& #39;s surveillance report? Seems like they might have excluded the household numbers as clearly you can& #39;t stop family spreading it (that might be what the "3rd level" footnote is about).
Also note the tiny sample numbers they& #39;re dealing with. An "exposure" is just someone whose contact details have been shared as being in the same place as a person who later tested positive. If that "all ages" column is number of exposures then this could just be a single pub!
Even if it& #39;s number of venues then it& #39;s still not a very large dataset. Then we also have to address whether exposure data is reflective of infections, or the ease of collecting contacts. I think this could just be a table of which venues contact tracing works best in.
Sorry this is a bit of an unstructured rant but it& #39;s hard to perform a proper review of what is on the face of it a very simplistic piece of analysis and presentation. If this is what MPs are deciding their next steps on then I& #39;m very worried.
If MPs walk away from this with the perception from the quoted headline of "30% of exposures are in pubs" then they& #39;re not following a scientific approach. Seems more like "what can we try next" to me.

 Read on Twitter


