You’ve probably heard about test positivity—a powerful metric that can reveal the percentage of COVID-19 tests coming back positive. This metric comes with some pretty big caveats. Let’s break them down: https://covidtracking.com/blog/test-positivity-in-the-us-is-a-mess">https://covidtracking.com/blog/test...
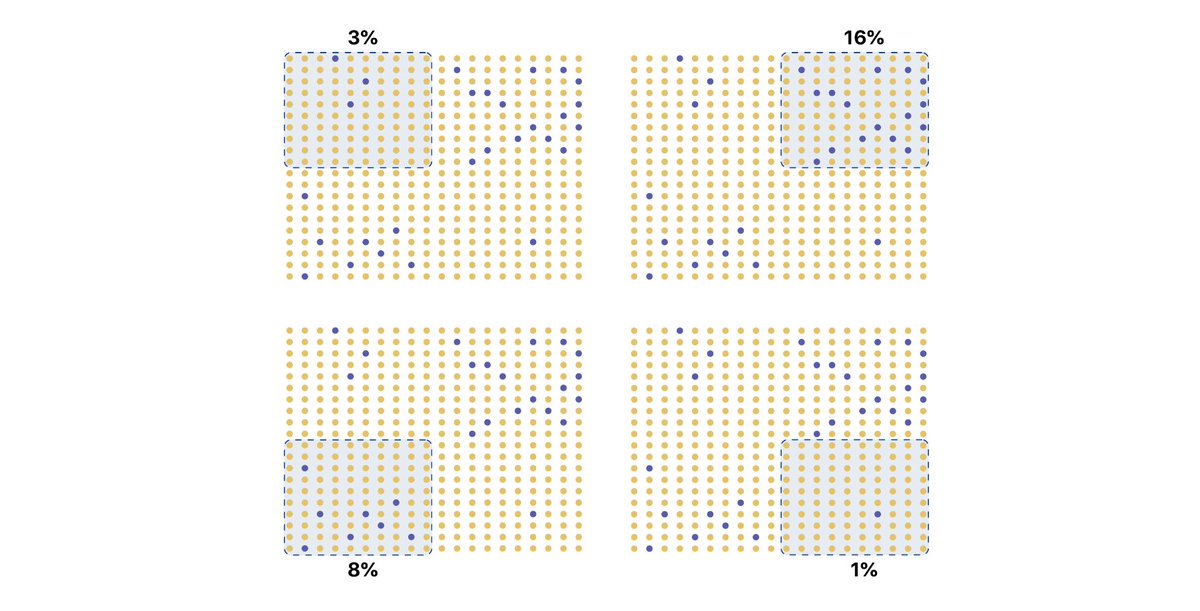
The first disclaimer is that test positivity reflects the % of people tested who have the virus, but not necessarily the % of people in the entire population who have the virus. So this metric only shows a portion of reality. https://covidtracking.com/blog/test-positivity">https://covidtracking.com/blog/test...
This makes it very tricky to make good assumptions based on test positivity, as it changes depending on who gets tested. Here, if different groups of people were tested, our numbers would vary anywhere from 1 to 16%, even though the total number of infections is the same.
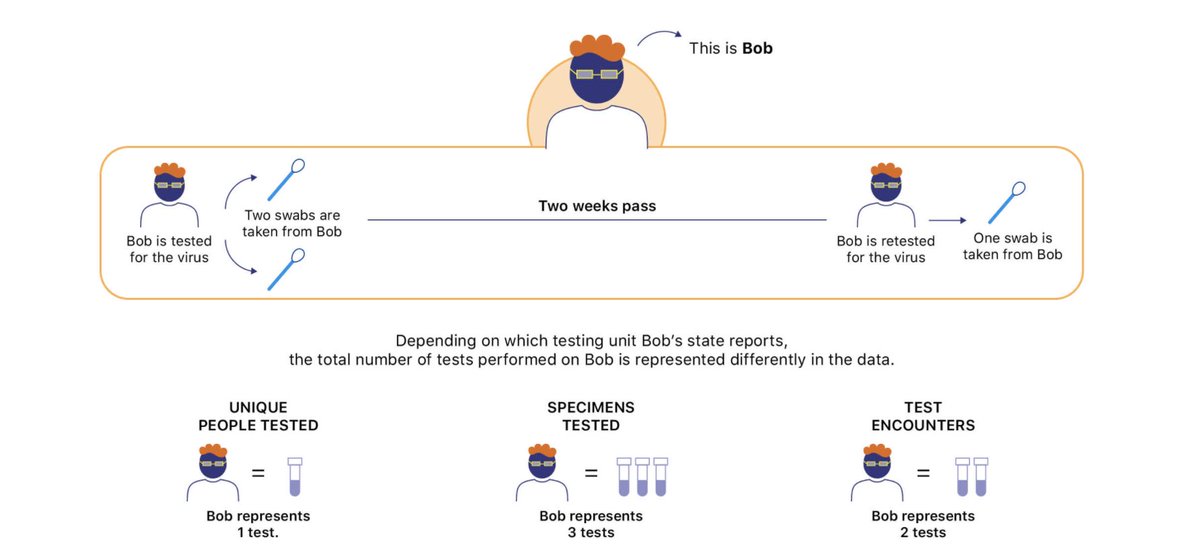
It gets EXTRA complicated when we look at the many ways jurisdictions report total tests (the denominator for test positivity). Each total-tests metric counts people differently in the data, which changes positivity. https://covidtracking.com/blog/test-positivity-in-the-us-is-a-mess">https://covidtracking.com/blog/test...
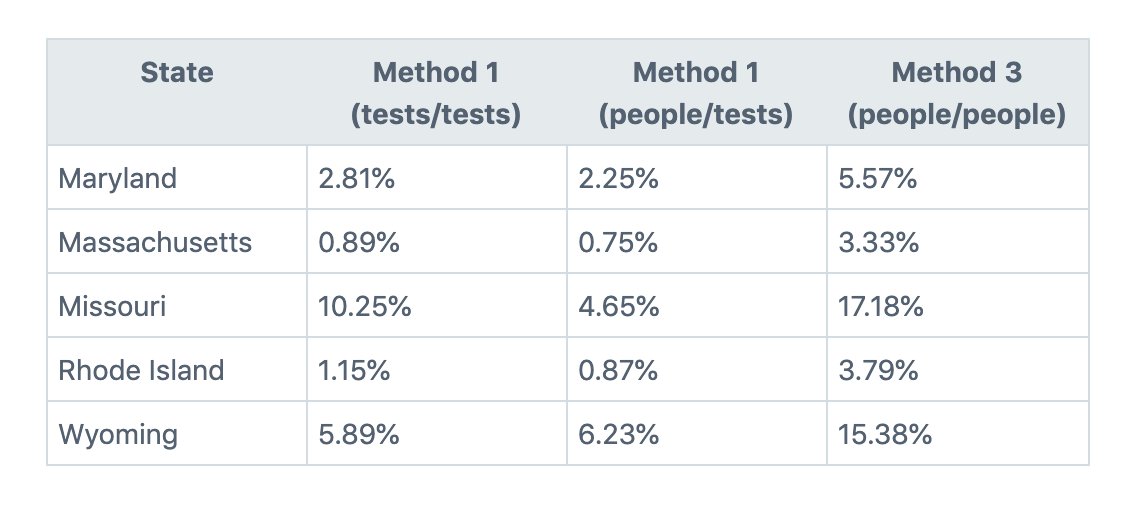
Not only are the units confusing, the formulas for calculating test positivity also vary. We did the math for five states using three methods validated by the CDC and the results are wildly divergent.
Until every state reports this most basic COVID-19 data in the same way, direct test positivity comparisons across states will remain an intractable problem. For that reason—because test positivity rates cannot easily be standardized—we do not currently publish them.
What we can do, however, is bring these complexities and inconsistencies into the light. To that end, we’ve recently made several changes to the way we display and distribute total tests data. We explain these changes here: https://covidtracking.com/blog/counting-covid-19-tests">https://covidtracking.com/blog/coun...
No single measure of the US public health response to COVID-19 should be considered in isolation, and this is especially true of test positivity. We recommend against an over-reliance on test positivity calculations to justify changes in public health responses or policies.

 Read on Twitter


