1/ New paper published. “Timely estimates of India& #39;s annual and monthly fossil CO₂ emissions.”
Short thread.
https://essd.copernicus.org/articles/12/2411/2020/essd-12-2411-2020.html">https://essd.copernicus.org/articles/...
Short thread.
https://essd.copernicus.org/articles/12/2411/2020/essd-12-2411-2020.html">https://essd.copernicus.org/articles/...
2/ India pledged under the Paris Agreement to reduce the emissions intensity of its economic production (GDP) by 33%-35%. But this is difficult to track given that the most recent official emissions estimate is for the year 2013/14.
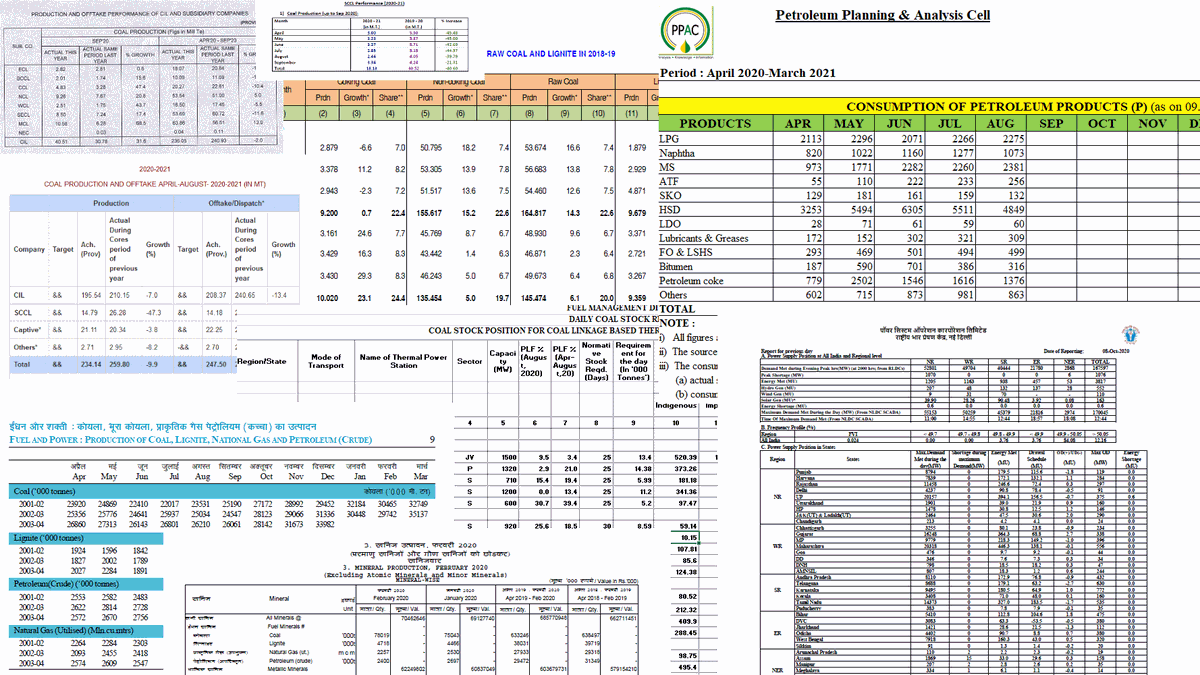
3/ India has both a lack of data and an abundance of data. The country has a decades-long history of publishing data on energy and industry, but much of this is not machine-readable, poorly documented, and widely dispersed.
4/ In this work I have gathered together a lot of the data that India has published and continues to publish that is relevant for estimating its CO₂ emissions. I& #39;ve written numerous scripts to scrape information from tables in PDF files or on web pages.
5/ There& #39;s also been a fair bit of good old-fashioned manual data entry  https://abs.twimg.com/emoji/v2/... draggable="false" alt="🤪" title="Zany face" aria-label="Emoji: Zany face">
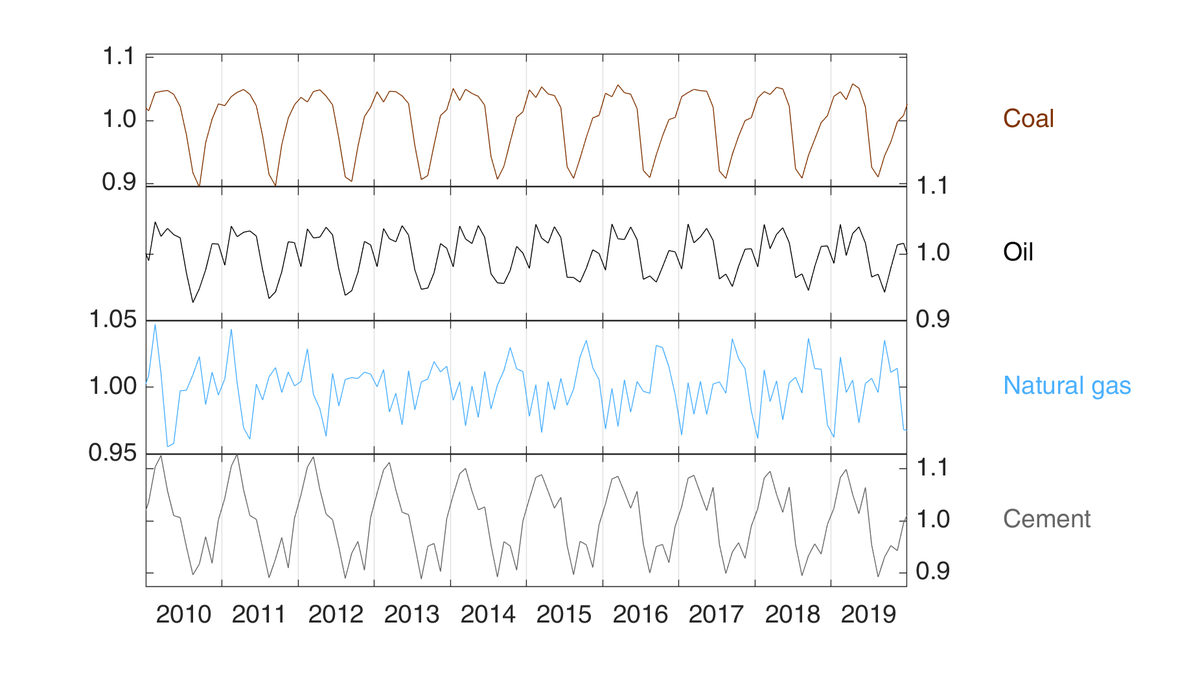
6/ Using this newly assembled dataset, I then calculate CO₂ emissions, giving for the first time bottom-up estimates of India& #39;s emissions by month. An analysis of emissions seasonality gets around a lot of the noise to show some clear patterns.
7/ India& #39;s emissions from coal typically dive during the monsoon season, when hydropower and wind peak, but also industrial demand drops because of the difficult weather conditions.
8/ India& #39;s emissions from oil also dip during the monsoon, again because of the weather effects on transport and industry. Emissions from natural gas appear to be driven by the production of fertiliser, peaking during the monsoon.
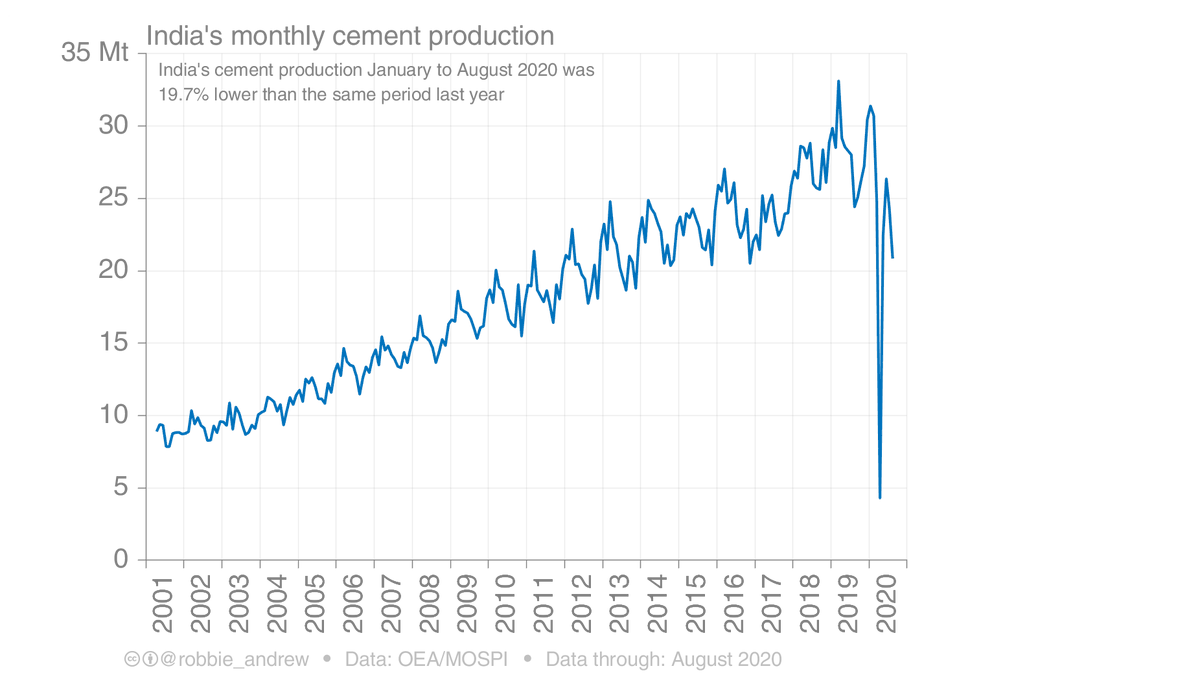
9/ Emissions from India& #39;s cement production are similarly affected by demand from construction activity, which is significantly dampened during the monsoon.
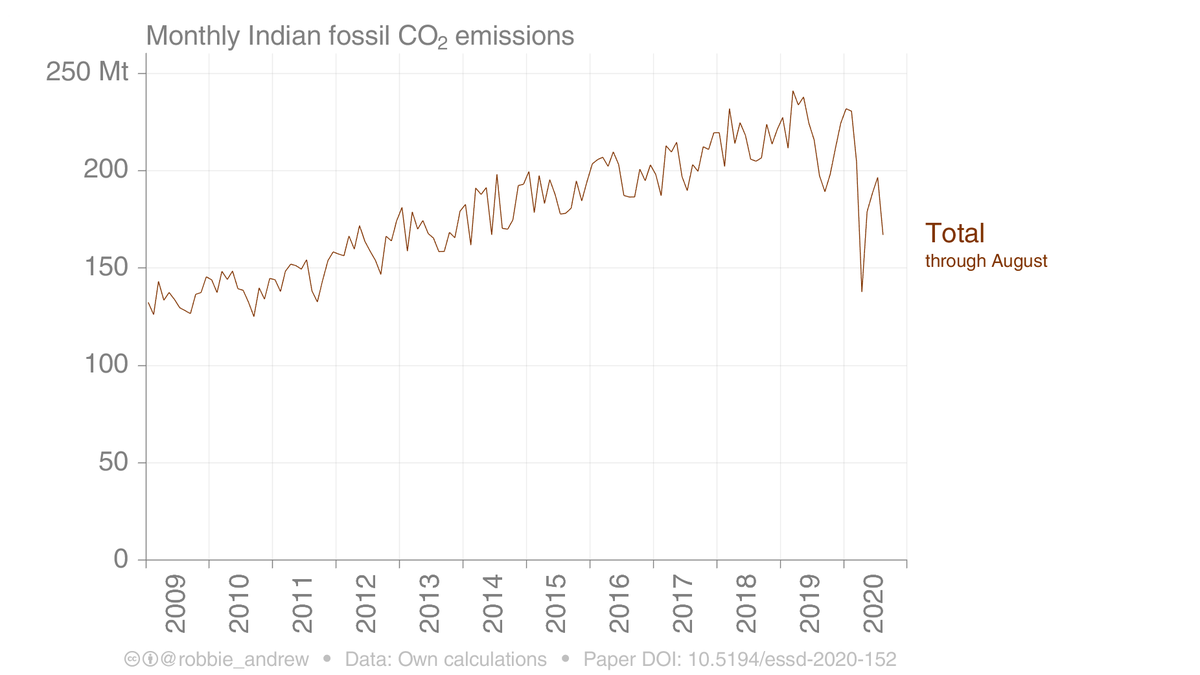
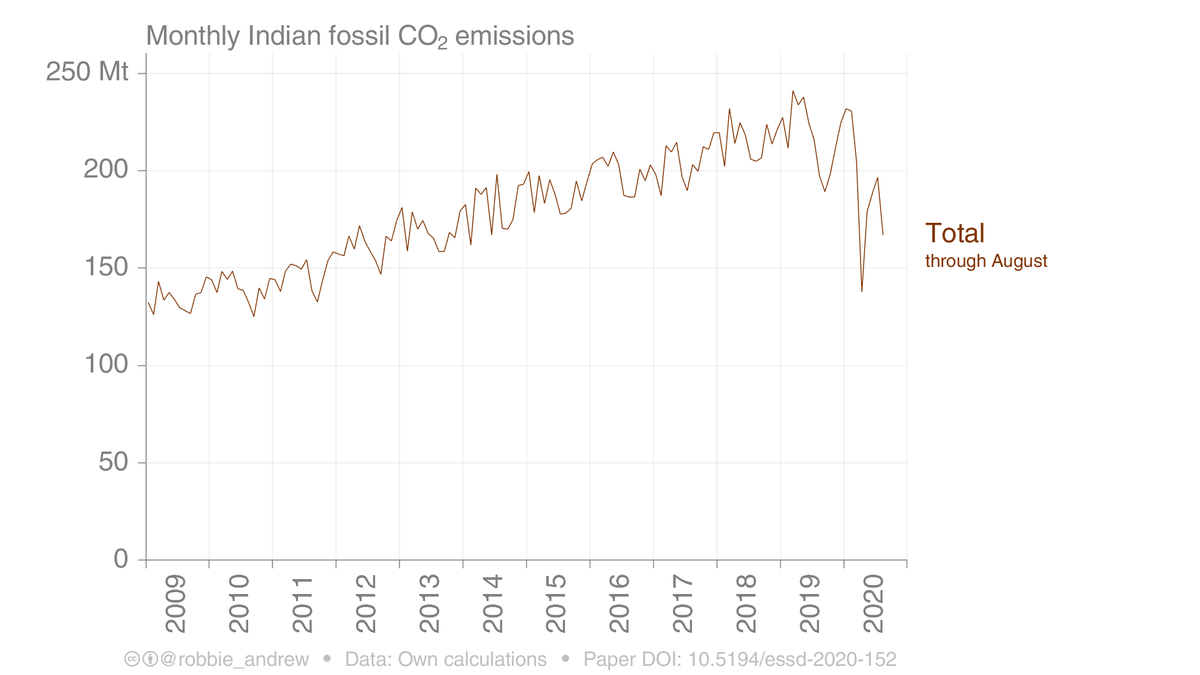
10/ While India& #39;s CO₂ emissions were growing steadily, the worm turned in mid-2019. A credit crunch brought about by significant overreaching, including by the electricity industry, has weighed on the economy.
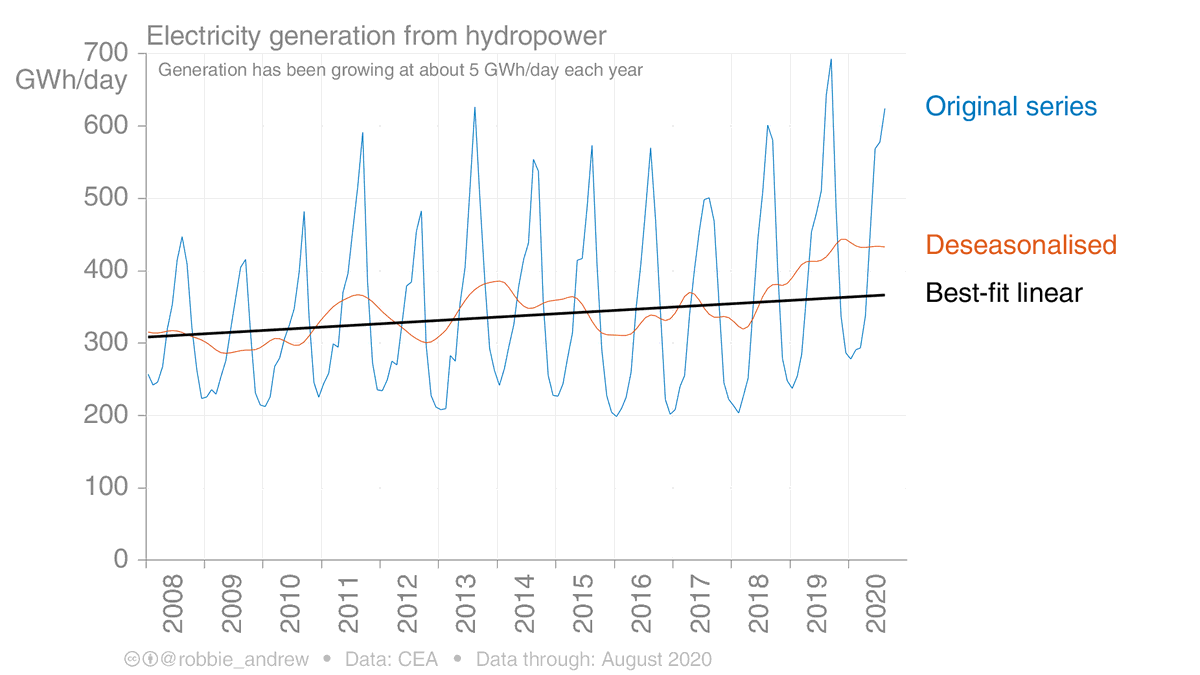
11/ But part of the decline in late 2019 was because of exceptionally high generation from hydropower. Hydro generation in August/September 2019 was 13% higher than in 2018. September& #39;s rainfall was more than 50% higher than normal for the month.
12/ Rubbing salt into the economic wounds of 2019, the COVID-19 pandemic has hit India particularly hard, and this is reflected in the estimates of its CO₂ emissions. In April, India& #39;s emissions were over 40% lower than the same month in 2019.
13/ In late March, India implemented one of the world& #39;s strictest lockdowns. For example, all cement factories were ordered to shut for several weeks, and by the time they were allowed to resume operations, demand was much lower.
https://www.argusmedia.com/en/news/2110966-indias-cement-output-contracts-in-april">https://www.argusmedia.com/en/news/2...
https://www.argusmedia.com/en/news/2110966-indias-cement-output-contracts-in-april">https://www.argusmedia.com/en/news/2...
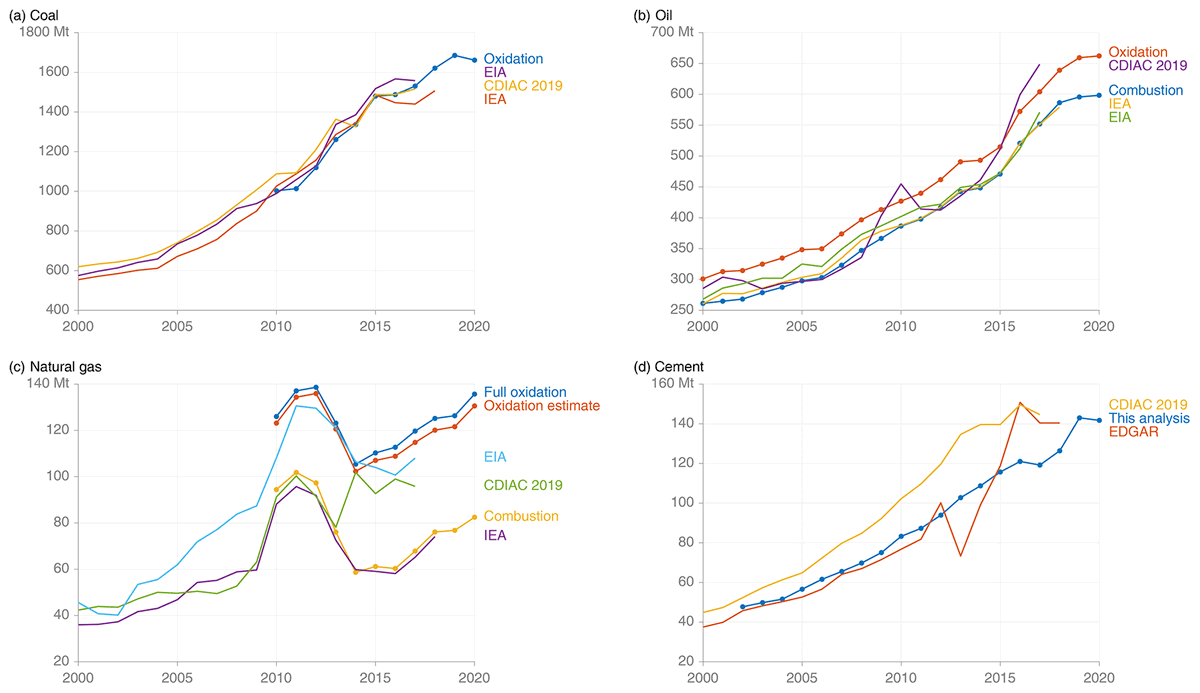
14/ I& #39;ve also compared the annual (fiscal-year) estimates derived from my monthly series to other data sources. I explain some of the deviations in the paper. With monthly estimates we can now generate calendar-year estimates to match most other countries.
https://essd.copernicus.org/articles/12/2411/2020/essd-12-2411-2020-discussion.html">https://essd.copernicus.org/articles/...
https://essd.copernicus.org/articles/12/2411/2020/essd-12-2411-2020-discussion.html">https://essd.copernicus.org/articles/...
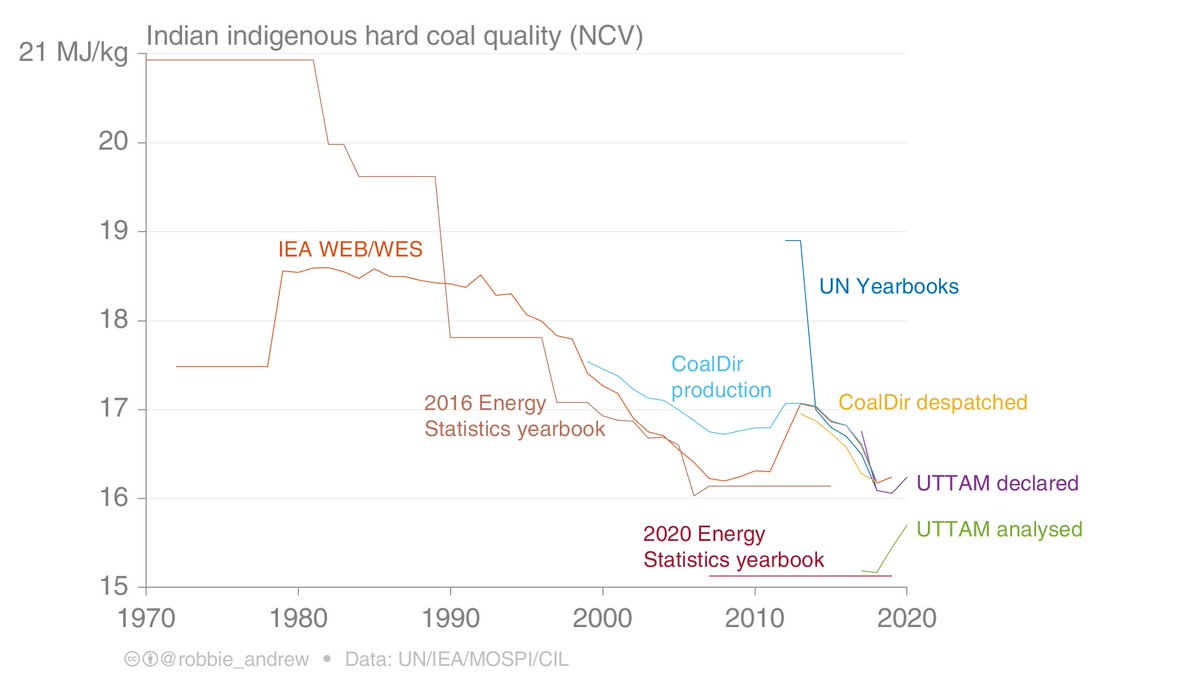
15/ No estimates of national CO₂ emissions are perfect, and mine here are no exception. The largest source of uncertainty is probably in the quality of India& #39;s coal, which has suffered from a lack of measurement.
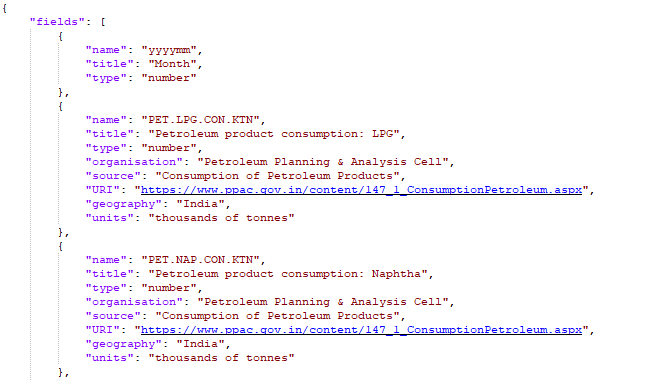
16/ I have tried to make the data I& #39;ve assembled as accessible as possible, with data in plain CSV format and accompanying metadata that is both machine- and human-readable in JSON format.
Available here: https://folk.universitetetioslo.no/roberan/t/india_CO2.shtml">https://folk.universitetetioslo.no/roberan/t...
Available here: https://folk.universitetetioslo.no/roberan/t/india_CO2.shtml">https://folk.universitetetioslo.no/roberan/t...
17/ The dataset is frequently updated with automatic checks of Indian websites for new data.
https://folk.universitetetioslo.no/roberan/t/india_CO2.shtml">https://folk.universitetetioslo.no/roberan/t...
https://folk.universitetetioslo.no/roberan/t/india_CO2.shtml">https://folk.universitetetioslo.no/roberan/t...
18/ Lastly, I would like to thank the three reviewers who provided very useful comments that improved the paper, including @ThomasASpencer and @CWorringham  https://abs.twimg.com/emoji/v2/... draggable="false" alt="🙏" title="Folded hands" aria-label="Emoji: Folded hands">.
END/ This was a huge amount of work, so it& #39;s nice to see a published paper as something tangible to show for it! Be my guest and take a look. https://essd.copernicus.org/articles/12/2411/2020/essd-12-2411-2020-discussion.html">https://essd.copernicus.org/articles/...

 Read on Twitter

