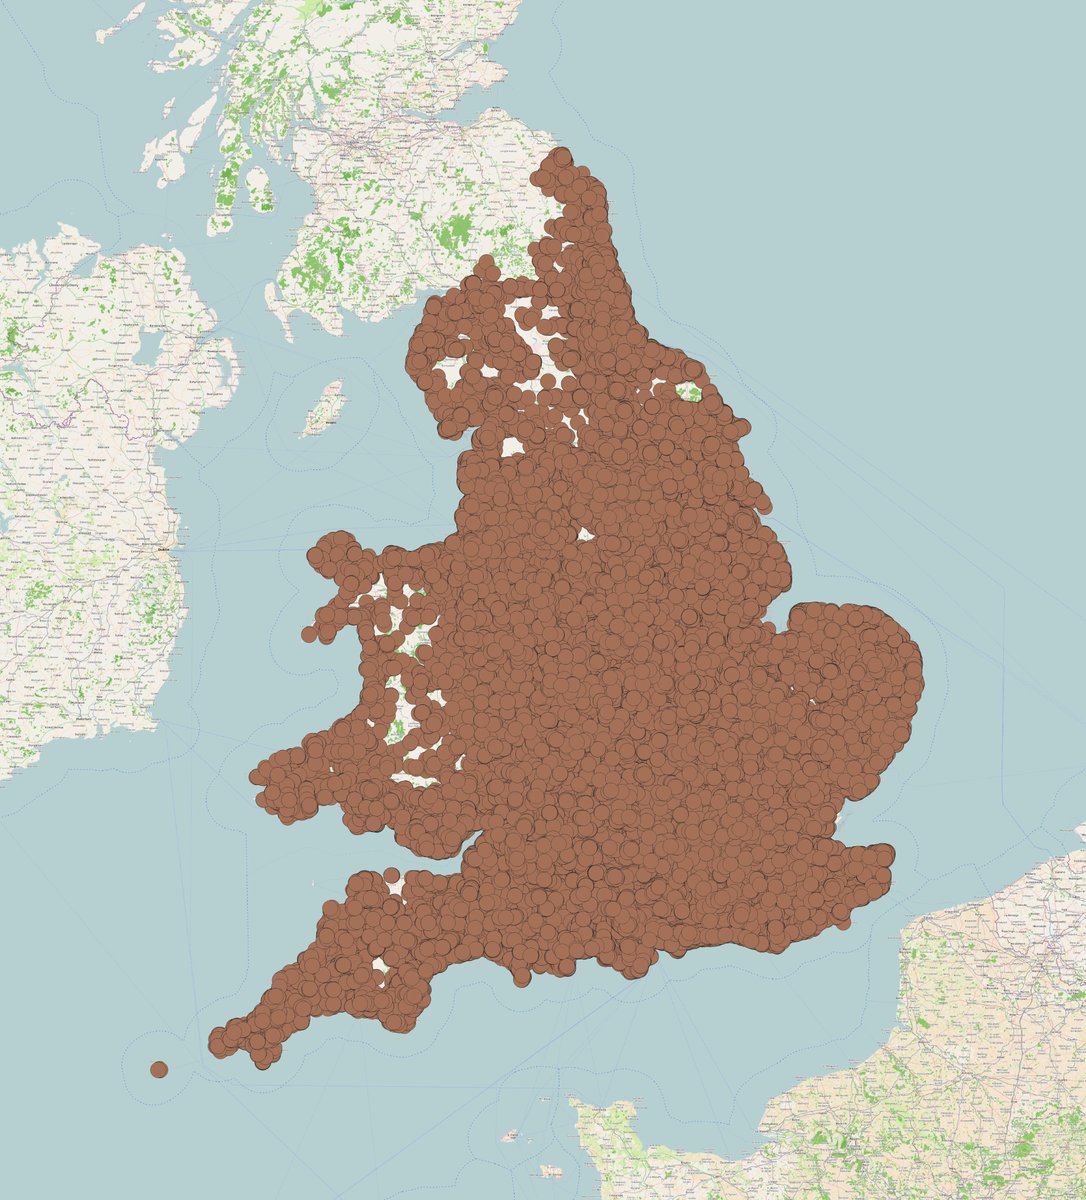
I downloaded all 25m residential property transactions in England and Wales since 1995. Filtered to only the "new build" sales. Looked up the location of each property and put it on a map. So I can see where we& #39;ve been building most properties.
Since we& #39;re all experts on SQL now, this is the query that does that.
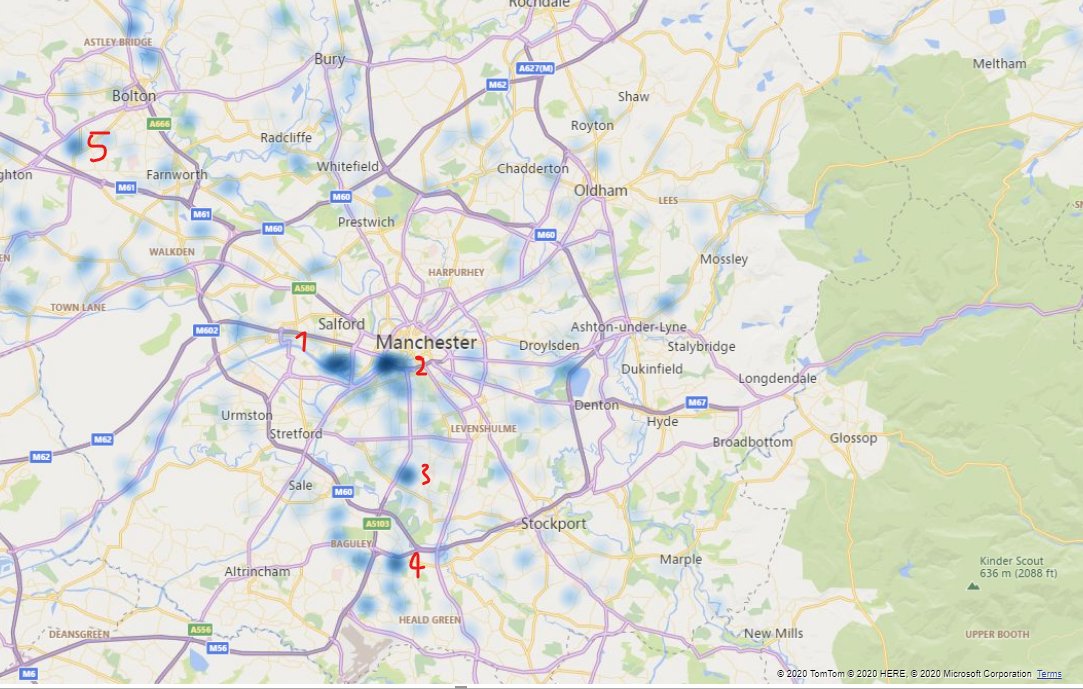
And the results do seem to check out. In Greater Manchester the hot spots of new development are,
1/ Media City.
2/ Castlefield.
3/ Old Withington Hospital site.
4/ Wythenshawe.
5/ West of Bolton (nearish Lostock station, but not quite).
Which checks out.
1/ Media City.
2/ Castlefield.
3/ Old Withington Hospital site.
4/ Wythenshawe.
5/ West of Bolton (nearish Lostock station, but not quite).
Which checks out.
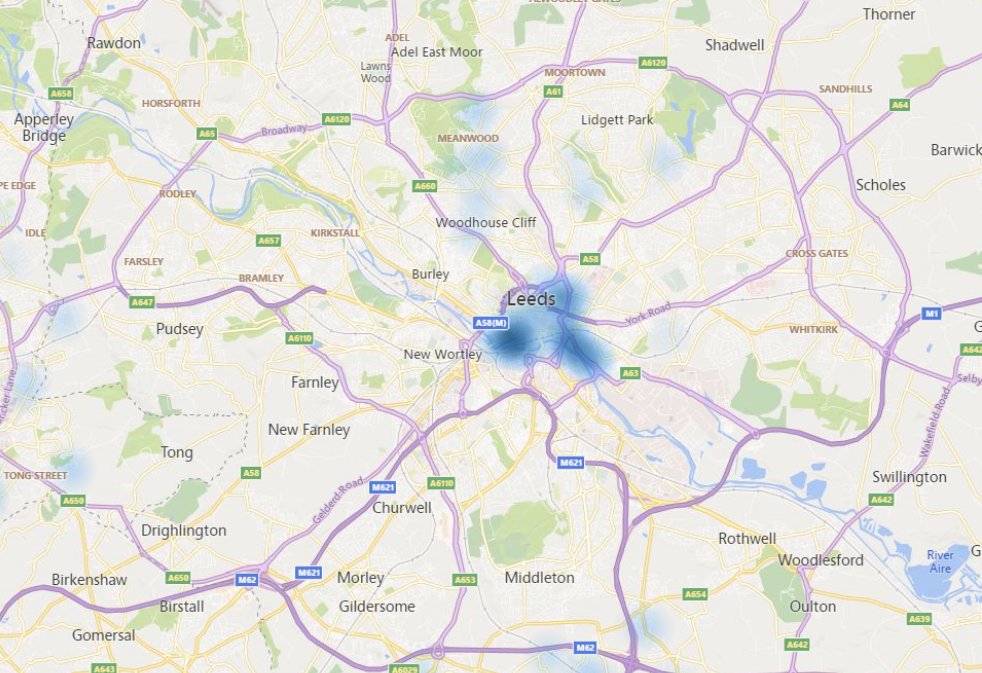
In Leeds it& #39;s all city centre. Flats, flats, flats, flats, flats, innit. I& #39;ve written at great length over the past decade about how that decision was taken and what was built as a result. So the data feels right.
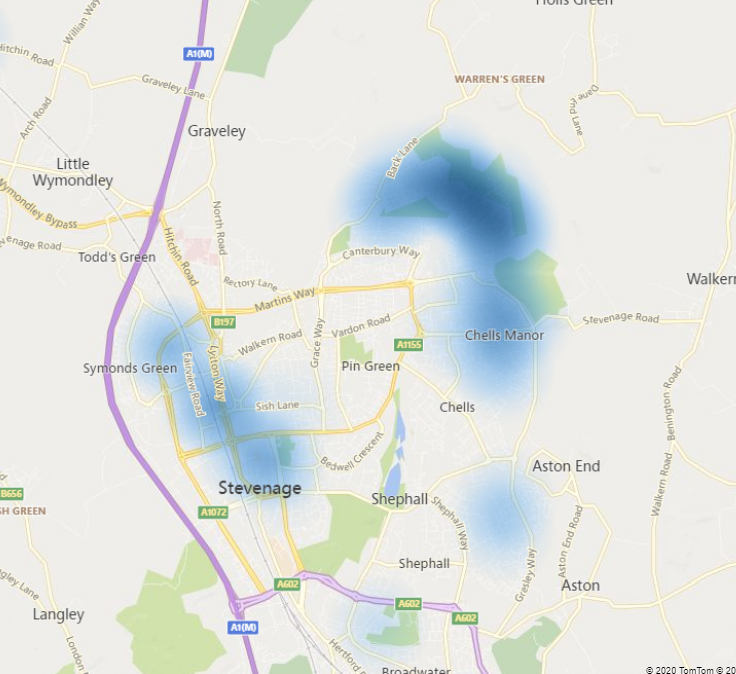
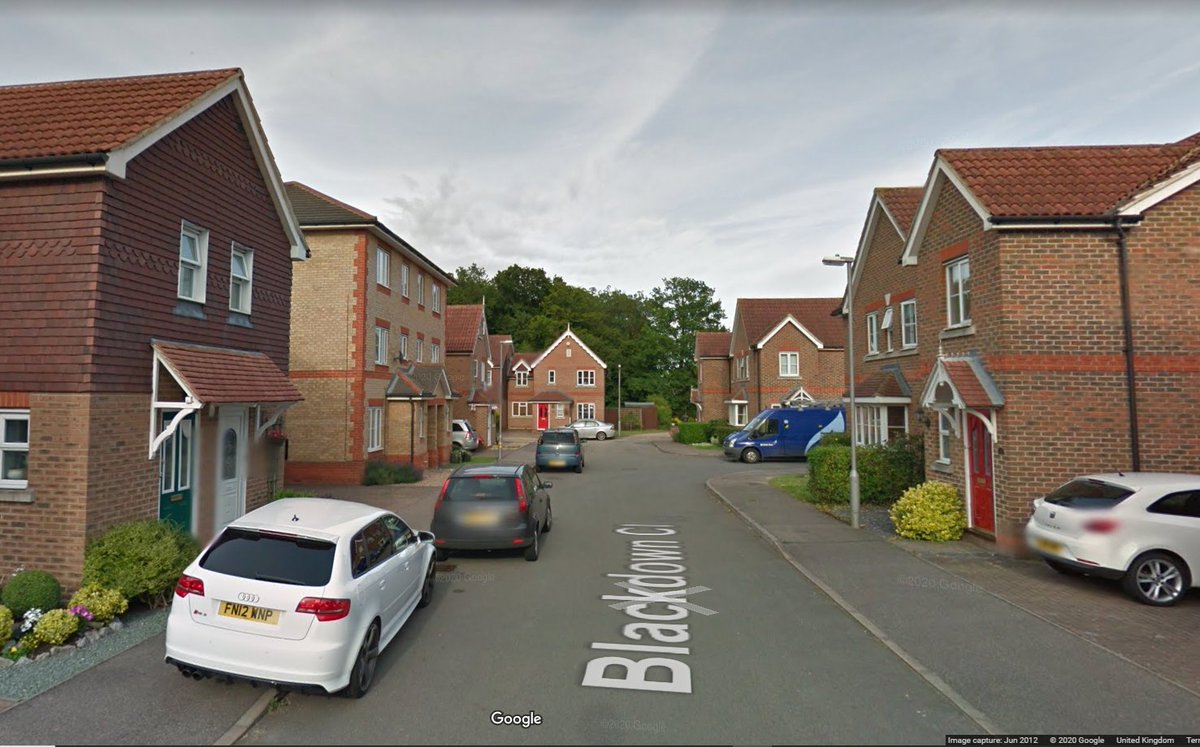
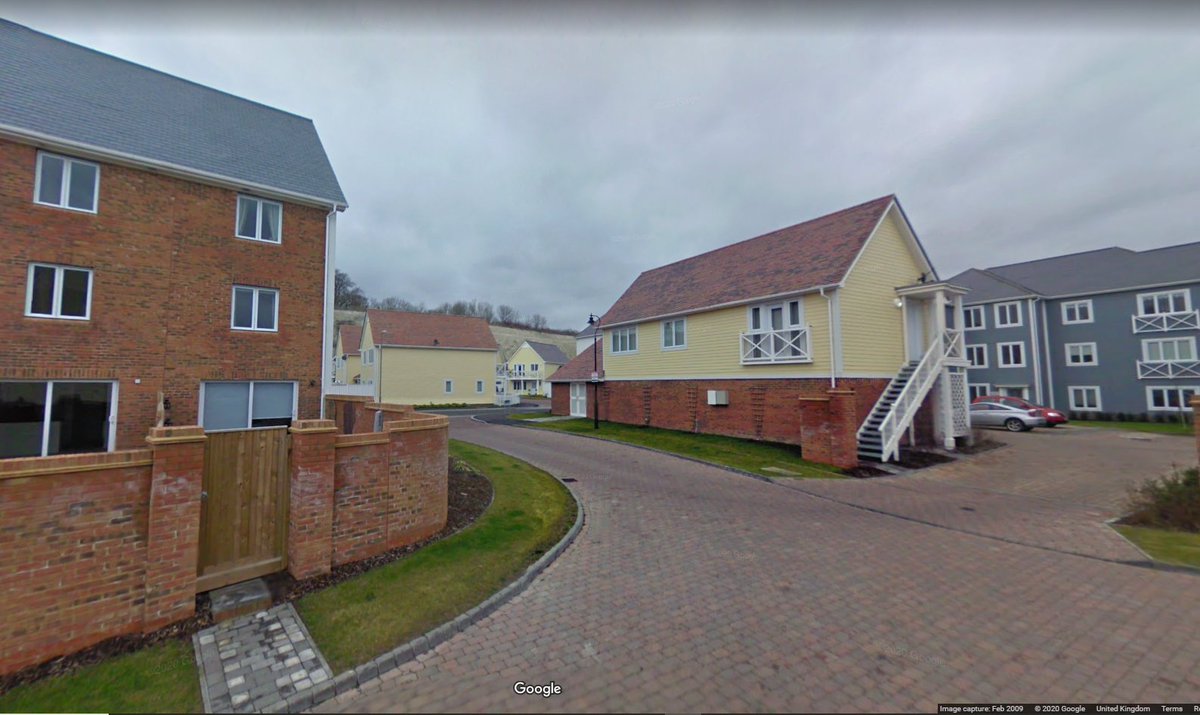
I see that Stevenage pretty much doubled in size with a massive extension to the town in the North East. Yep, checks out on Streetview.
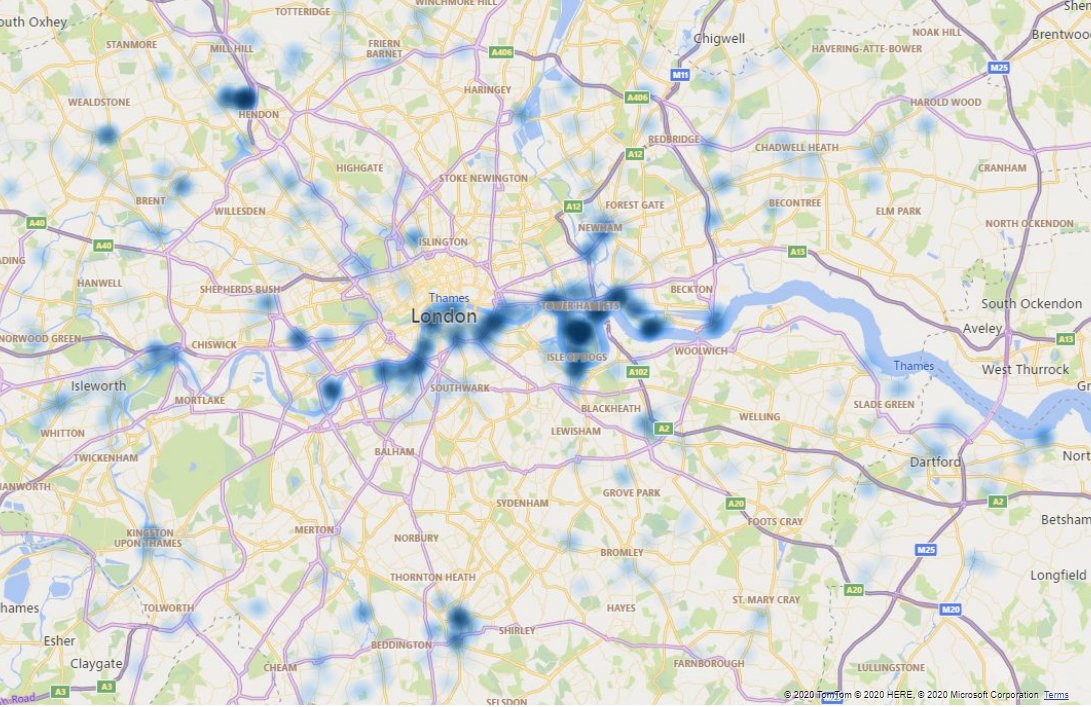
But my favourite is London. Flats all along the river from Battersea to the Thames barrier. And Newham, Croydon, and near Collindale tube station for reasons someone local would know.
Anyways, this is far from a good measure of where new homes got built. But it& #39;s quite interesting that it& #39;s possible at all, just using open data I can download in a few minutes, free databases, and free mapping tools. It took one hour today. It was really hard five years ago.
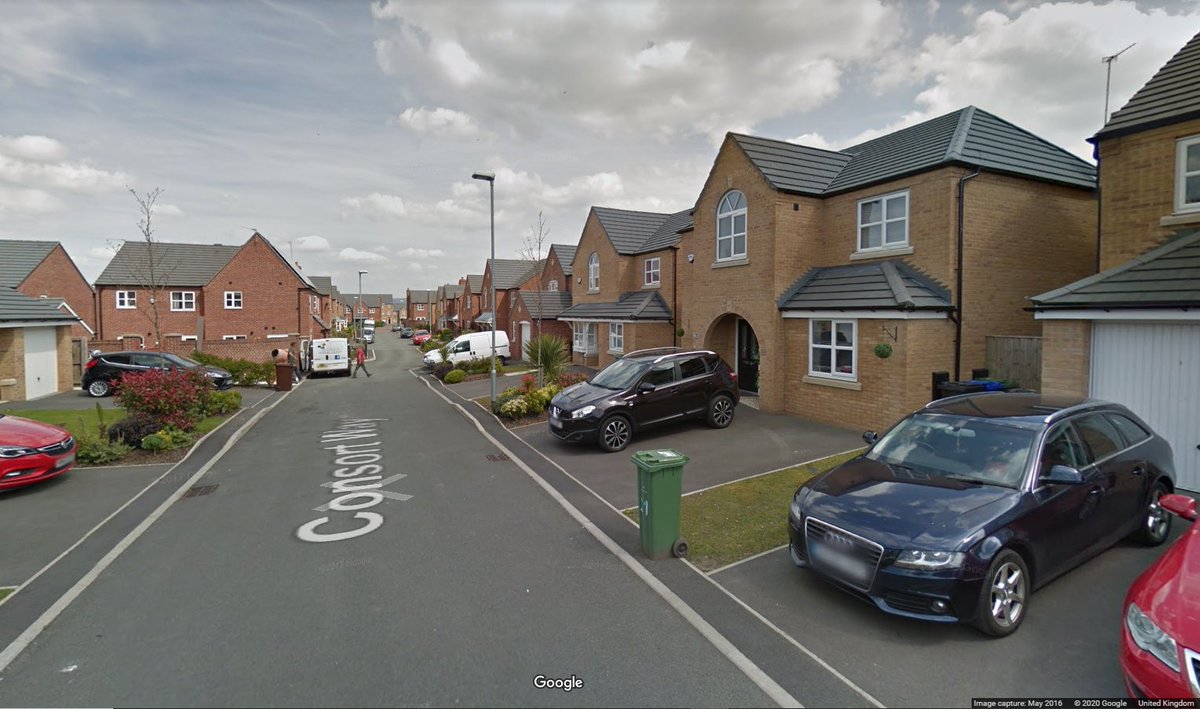
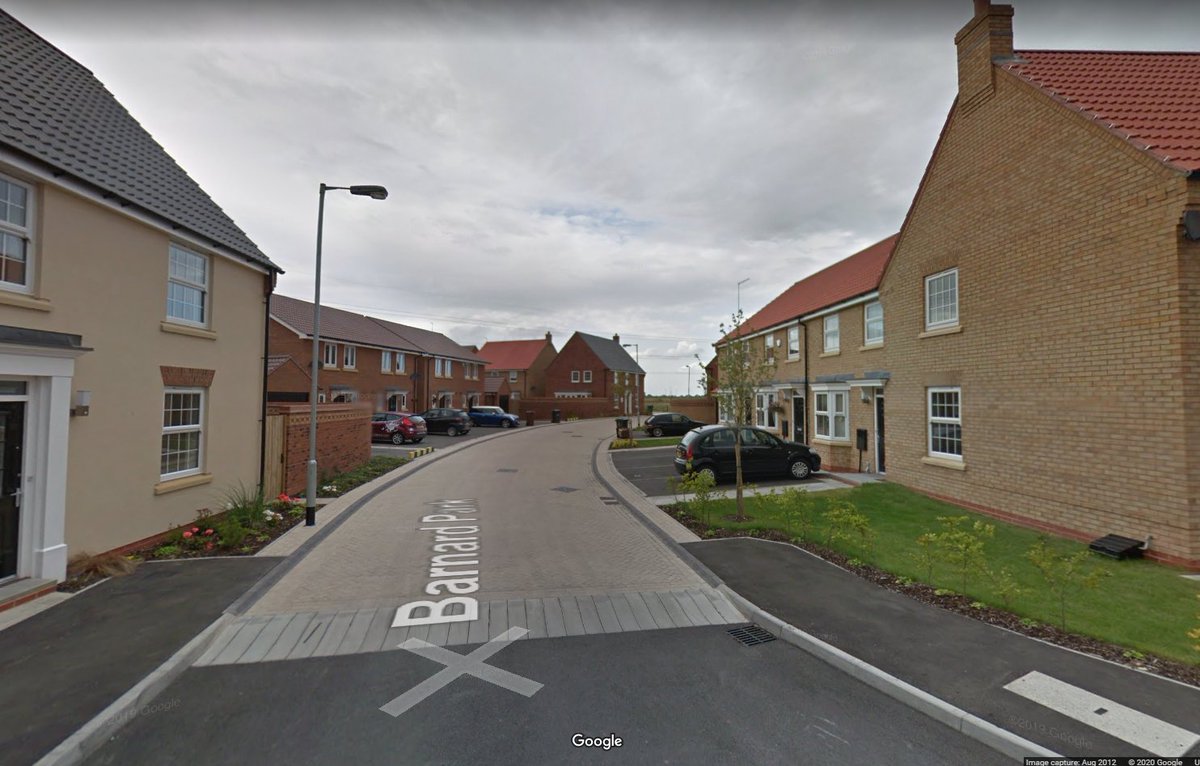
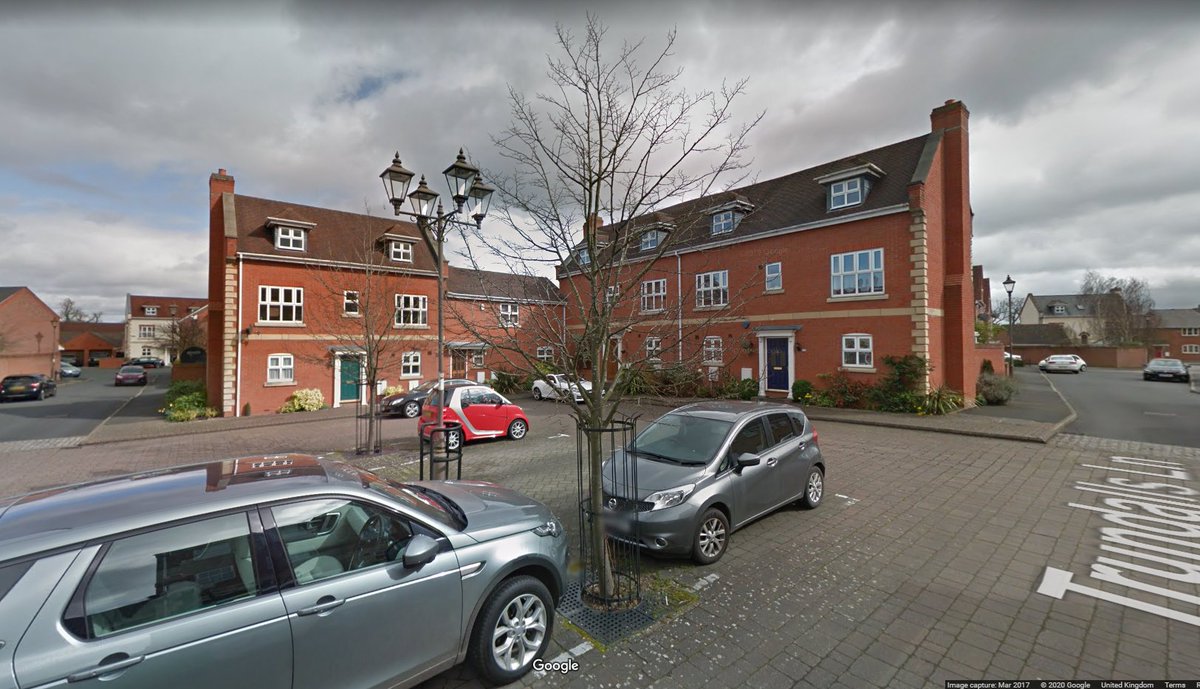
Now I& #39;m just zooming around streetview checking out the last decade of suburbia.

 Read on Twitter
