Some highlights from our new Housing in London report:
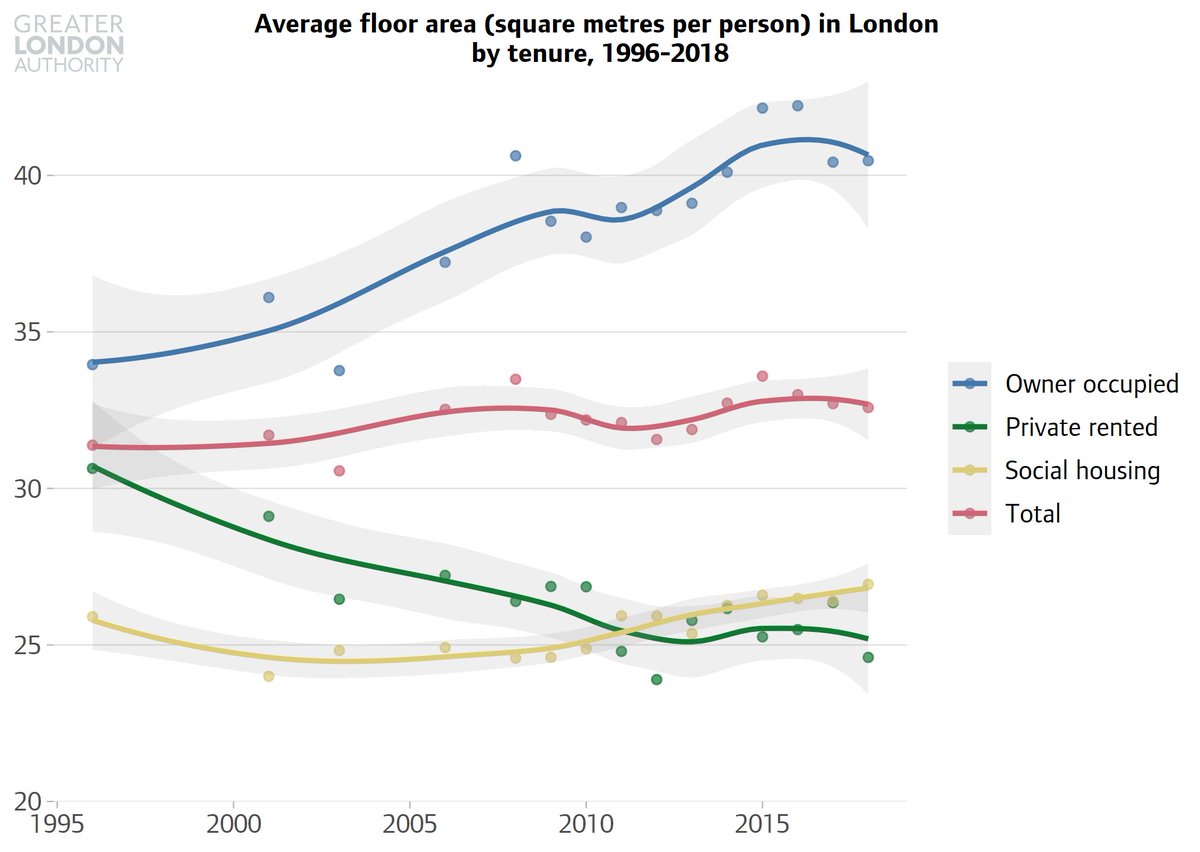
While the average housing floorspace per person in London has increased (very slightly) over the last 20ish years, this is entirely down to increases among home owners. Among private tenants it has fallen sharply.
While the average housing floorspace per person in London has increased (very slightly) over the last 20ish years, this is entirely down to increases among home owners. Among private tenants it has fallen sharply.
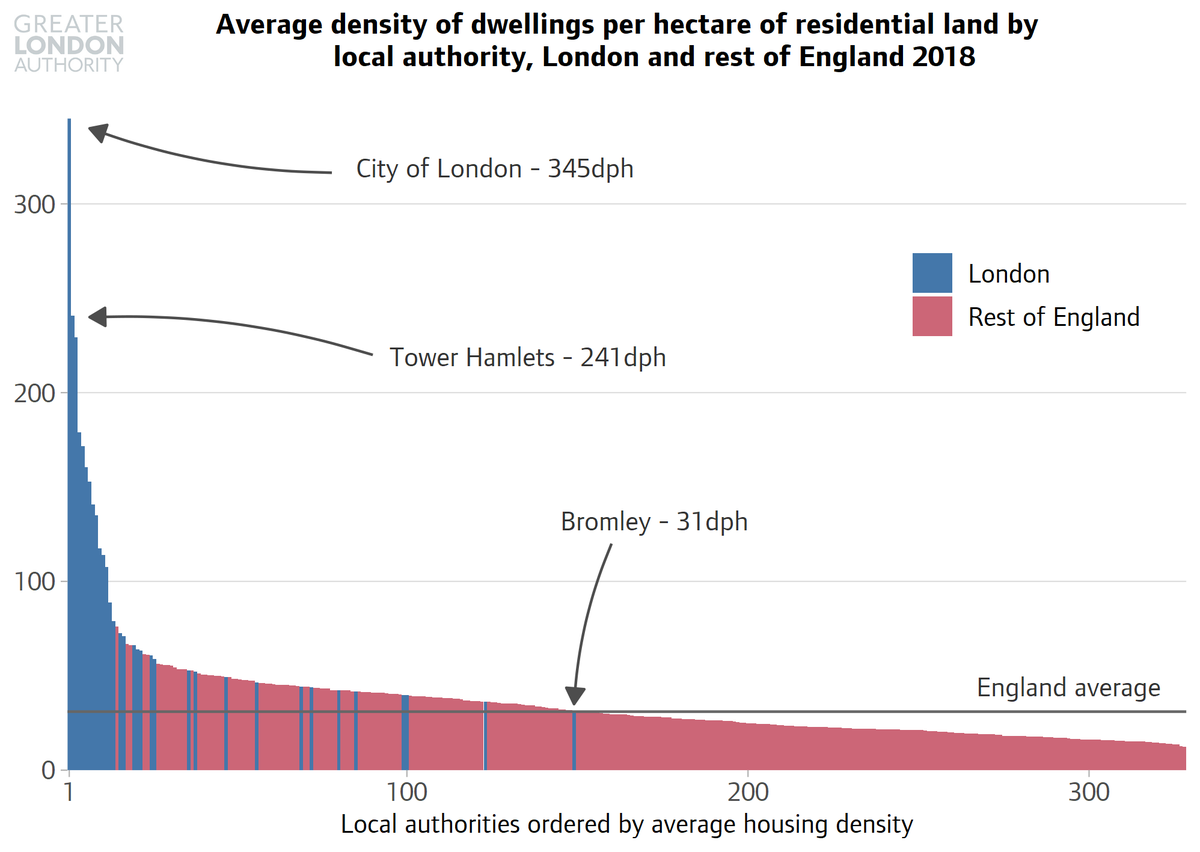
This analysis shows that the areas of greatest housing density (homes per hectare of *residential* land) in the country are the City of London and Tower Hamlets, with London boroughs generally built at far higher densities than the England average.
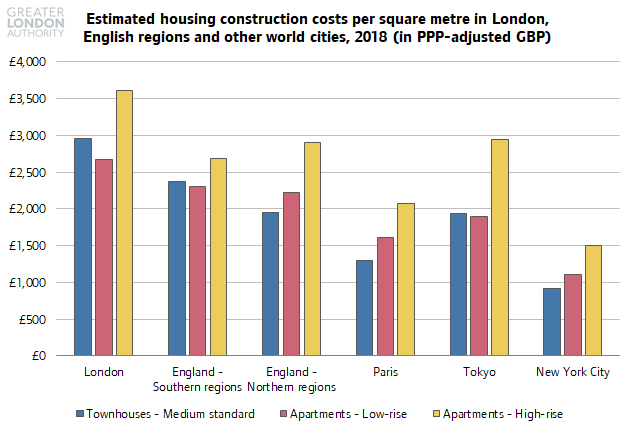
One under-examined factor behind high housing costs in London is the cost of construction. This chart, from Turner and Townsend data, shows that costs are higher in London than in other English regions and in other global cities.
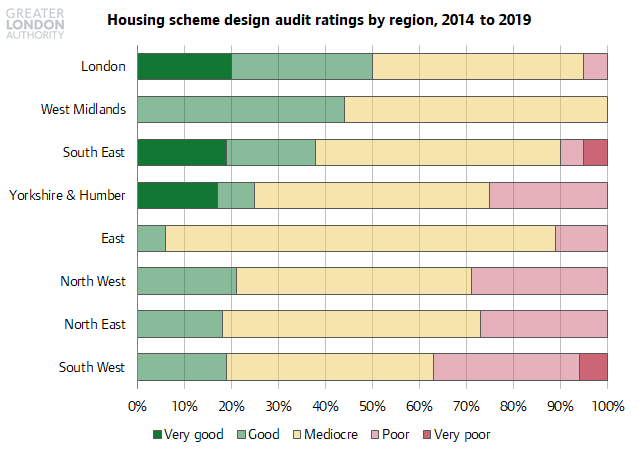
Perhaps that is linked to the fact that housing developments in London typically received significantly better ratings in the recent Housing Design Audit for England from Place Alliance.
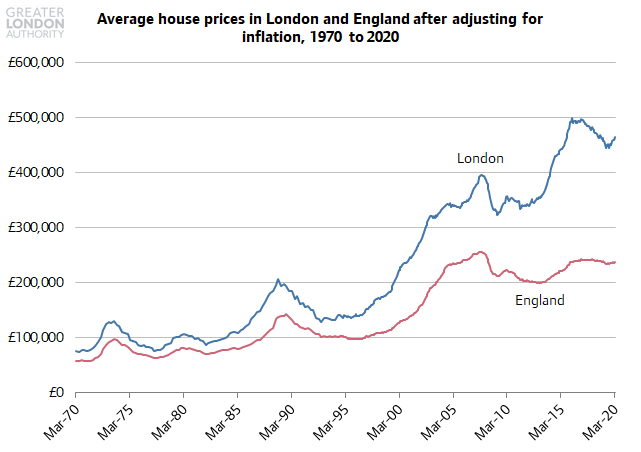
Before the onset of Coronavirus, house prices in London had started to increase again, having risen sixfold in real terms since 1970.
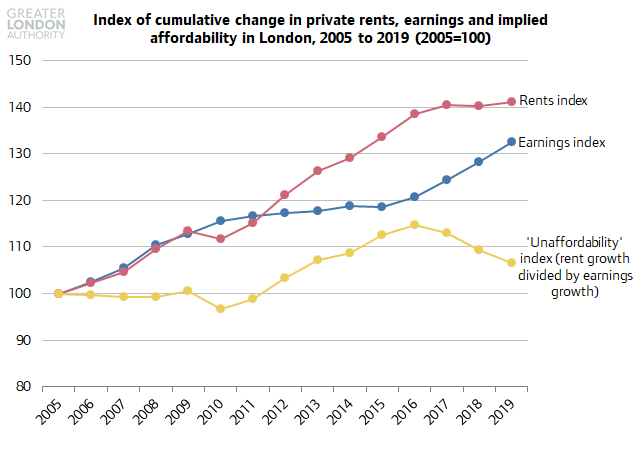
On the bright side, private rental affordability has improved recently in London as earnings have caught up with rental growth (probably due in large part to relatively high levels of supply in recent years).
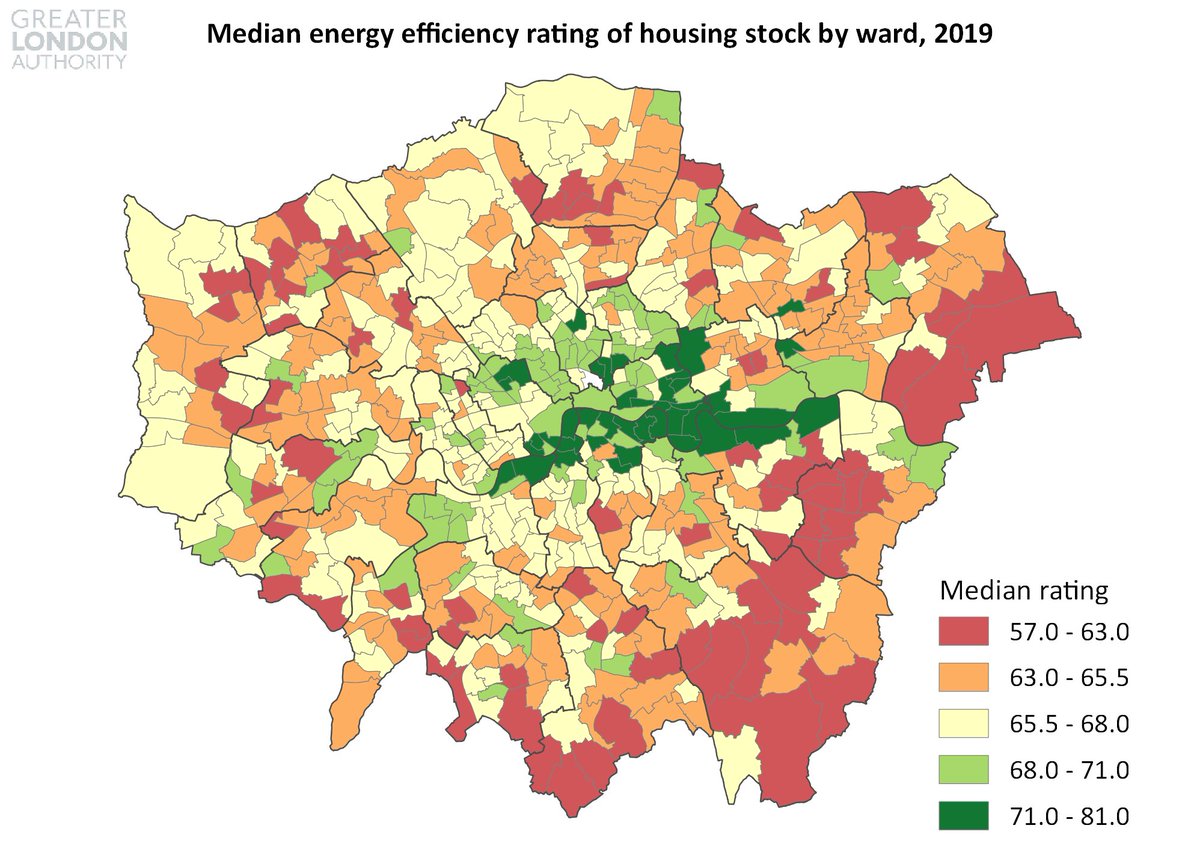
The most energy efficient homes in London are found in high-density areas with many recently built homes, while the least energy efficient tend to be in low-density outer suburbs
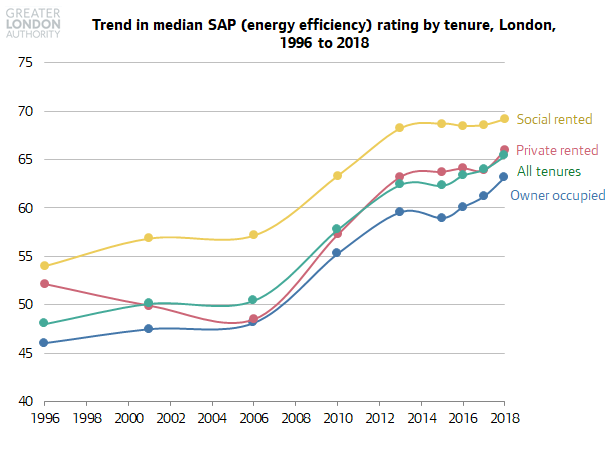
There& #39;s some good news on home energy efficiency, which seems to be improving again on average after a few years of stagnation.
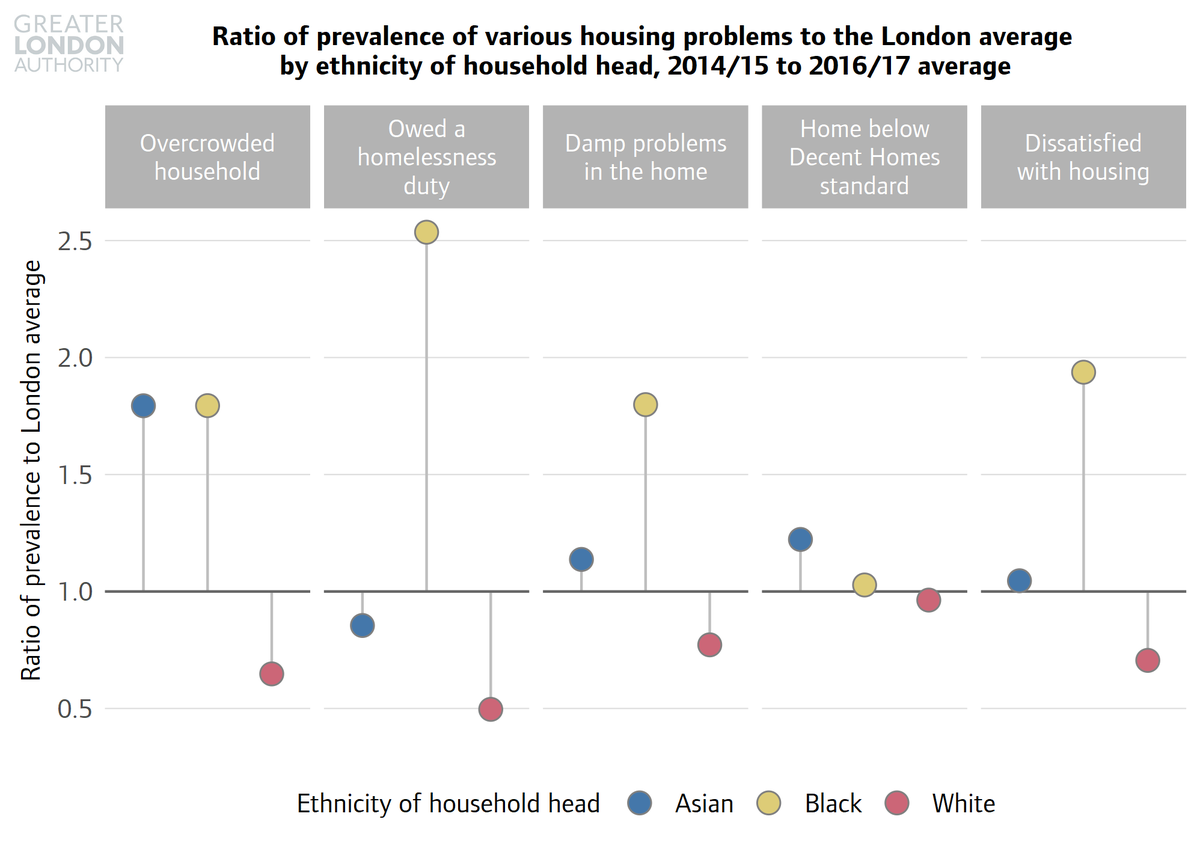
In the section on Coronavirus, we start by showing how before the onset of the pandemic, there were stark differences in rates of housing problems between Londoners of different ethnicities.
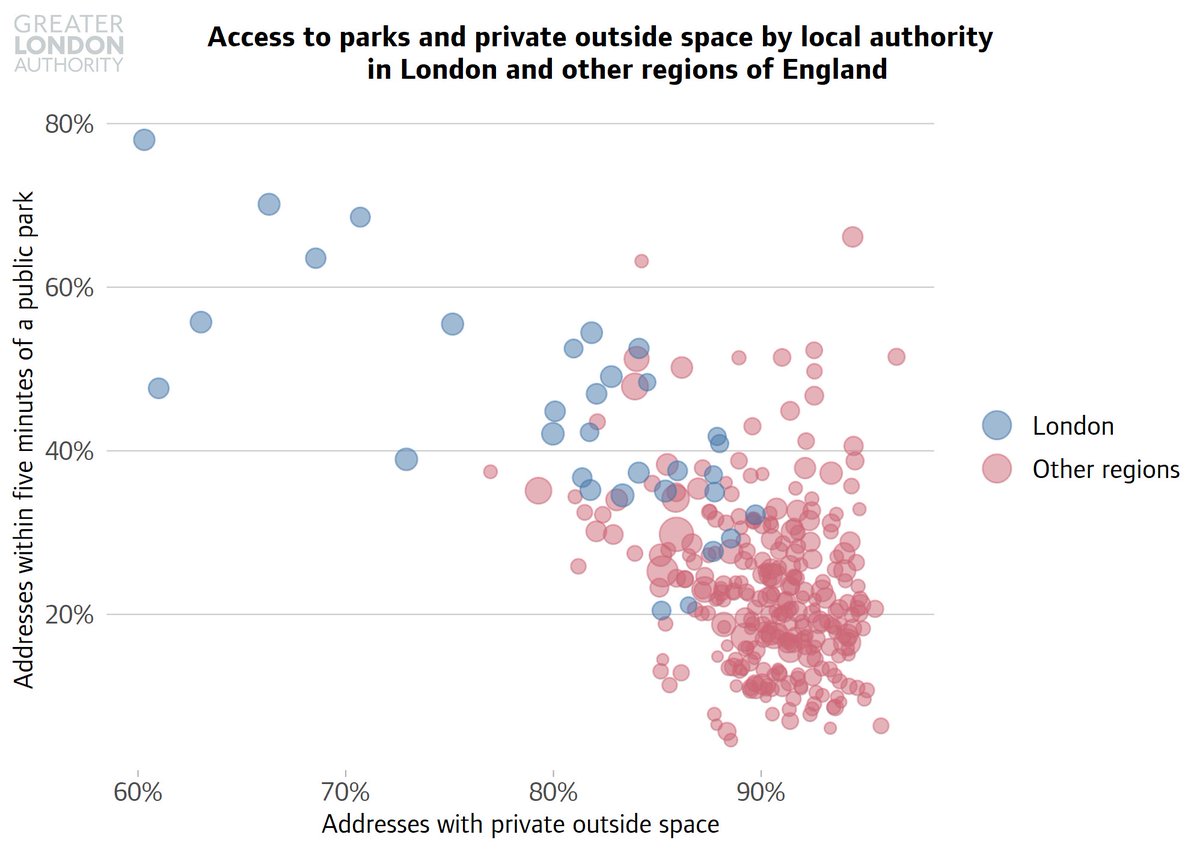
Londoners are less likely to have private gardens or other outside space than people in other regions, but on ther other hand are more likely to live within walking distance of a park.
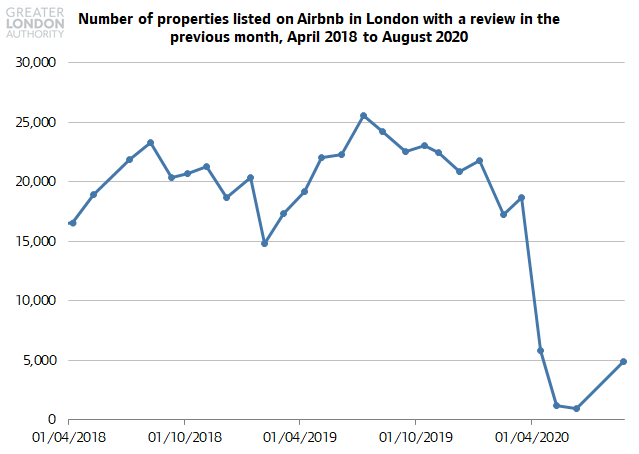
The number of London properties listed on Airbnb and with a recent review (an indicator of occupancy) collapsed in April, after lockdown measures were announced, only to pick up slightly in August.
Inevitably I have messed up the threading, so here is the next one in the series https://twitter.com/geographyjim/status/1313885640707256321">https://twitter.com/geography...
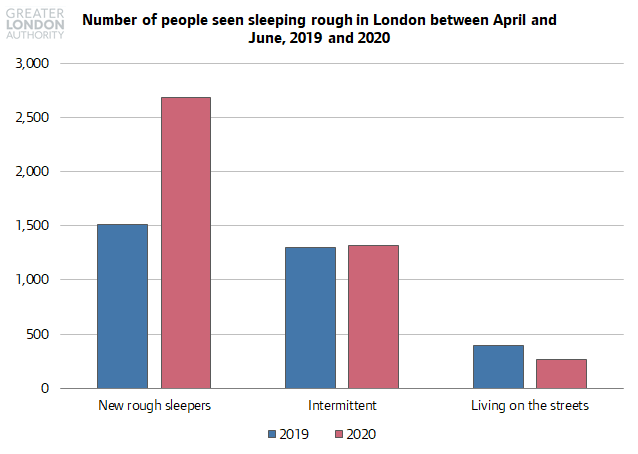
Unfortunately the number of people seen sleeping rough for the first time in London between April and June 2020 was 77% higher than in the same period in 2019.
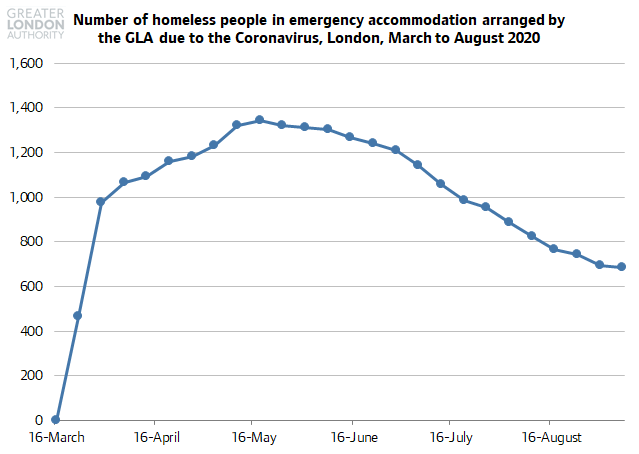
But the heroic efforts of the GLA rough sleeping team meant that by late May, there were nearly 1,400 homeless people staying in emergency hotel accommodation arranged by the GLA due to the pandemic who would otherwise have been at risk on the streets or in hostels.
There is far more detail on these and other subjects in the full report, co-written with my brilliant colleague Georgie Cosh. A big thank-you goes to all the government statisticians and others who provided the source data we drew on. https://www.london.gov.uk/what-we-do/housing-and-land/housing-and-land-publications/housing-london-2020">https://www.london.gov.uk/what-we-d...

 Read on Twitter