Israel: What went wrong?
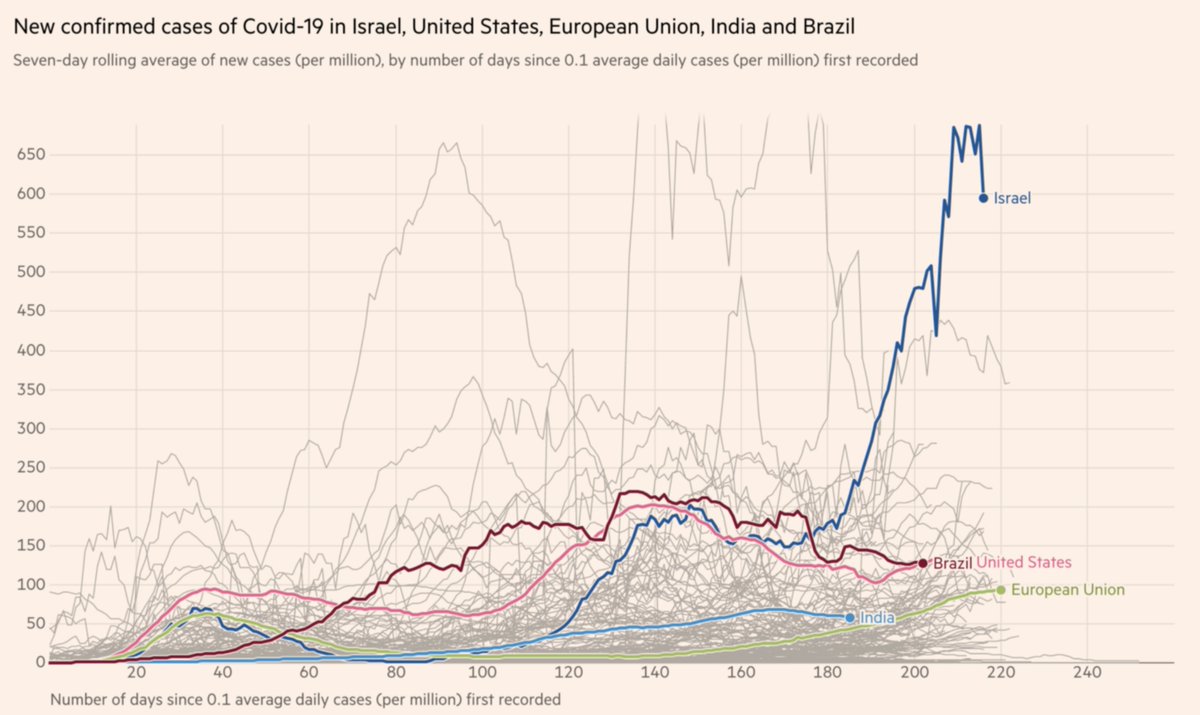
How did we come to lead the COVID-19 cases chart? What caused the 2nd wave, why was it so bad, and is the lockdown working?
A thread on Israel, the first country to impose a second lockdown, with lots of (don’t do) lessons to teach the world
@EricTopol
How did we come to lead the COVID-19 cases chart? What caused the 2nd wave, why was it so bad, and is the lockdown working?
A thread on Israel, the first country to impose a second lockdown, with lots of (don’t do) lessons to teach the world
@EricTopol
I will start with a summary of the key take-homes:
1. Don’t open schools with a high number of daily cases and high infection rates (R-naught around 1). This will fuel a further surge, and anyway be ineffective due to many quarantines of kids and teachers
1. Don’t open schools with a high number of daily cases and high infection rates (R-naught around 1). This will fuel a further surge, and anyway be ineffective due to many quarantines of kids and teachers
2. Don’t manage the pandemic based on the capacity of your healthcare system. You are bound to reach it. At that point, the outbreak will reach record levels, a high death toll, lockdown will be needed, and it will take very long to bring the numbers down. Act early
3. An outbreak in the younger population will inevitably reach the elderly within weeks
4. An outbreak in some cities will inevitably spread to other cities, due to population mixing. We had localized outbreaks but could not implement differential lockdown due to political reasons, and they eventually spread
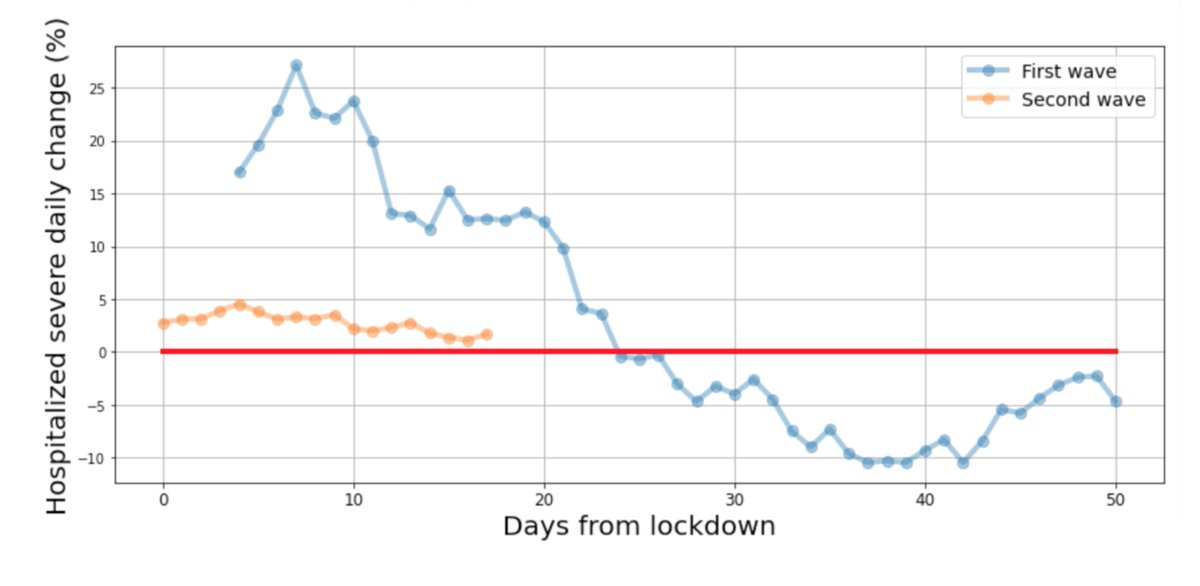
5. In a heterogeneous population, lockdowns can have different effects on different groups due to different behaviors of these populations. Two weeks into the lockdown, the outbreak halted in the general population but continues to spread in the Orthodox
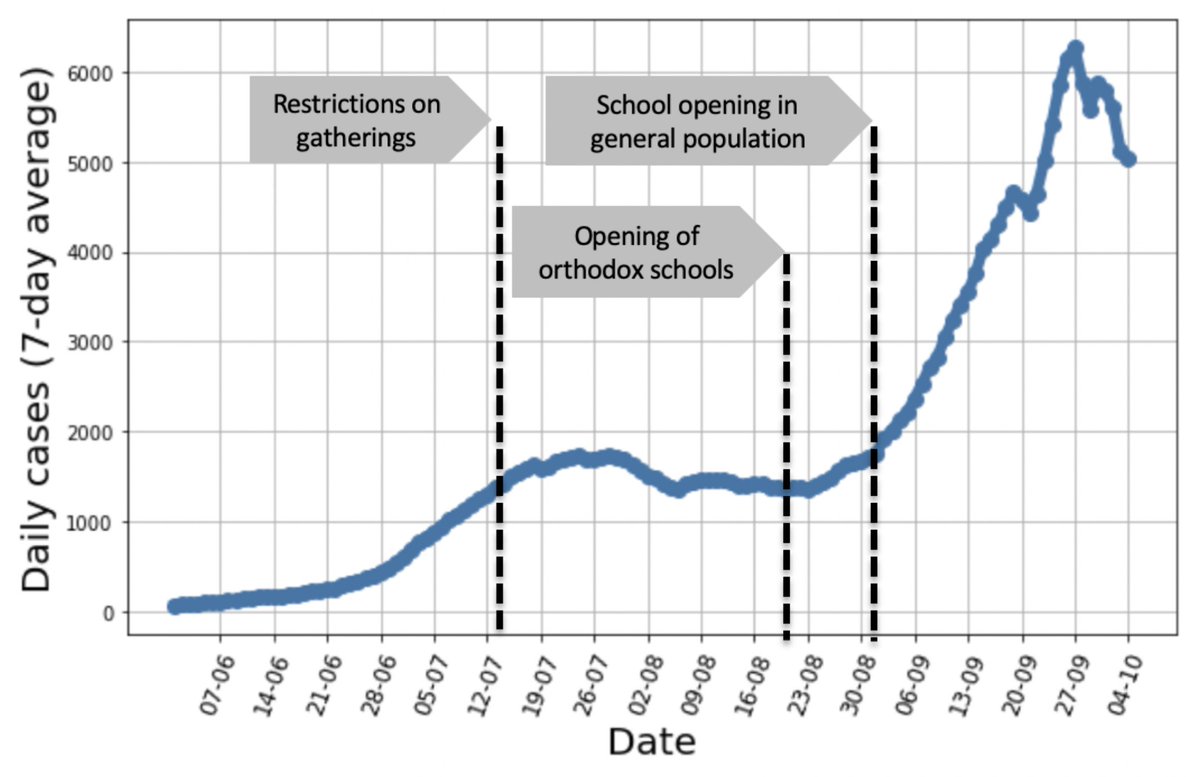
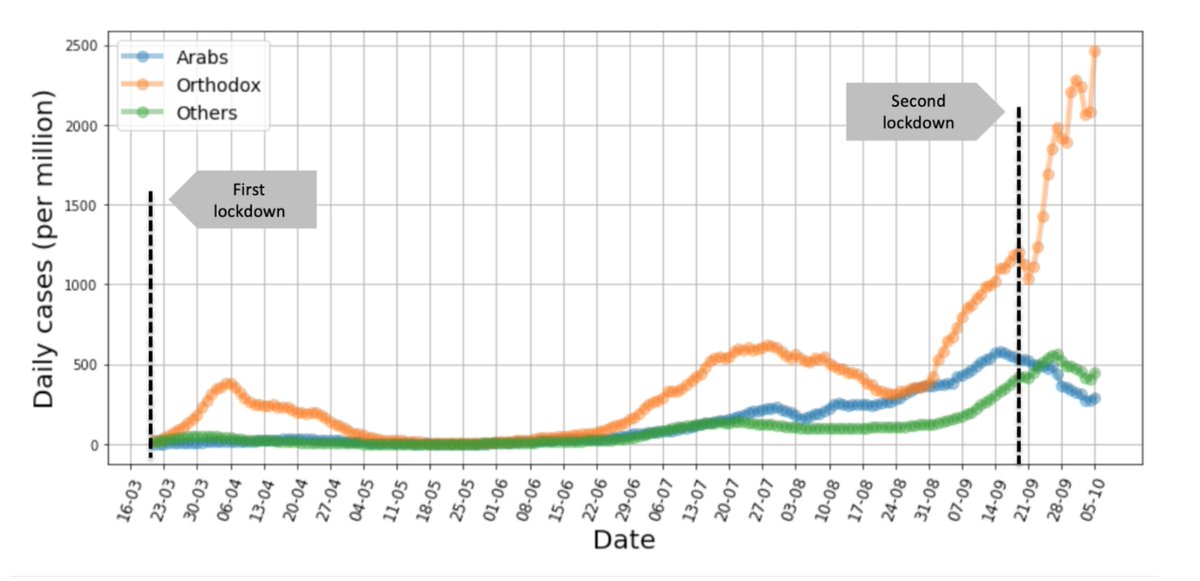
Now in detail. Zooming in, following a rise to 1500 daily cases, far more than the first wave, the government imposed restrictions on gatherings, after which we saw stability, which we all said is too high and fragile
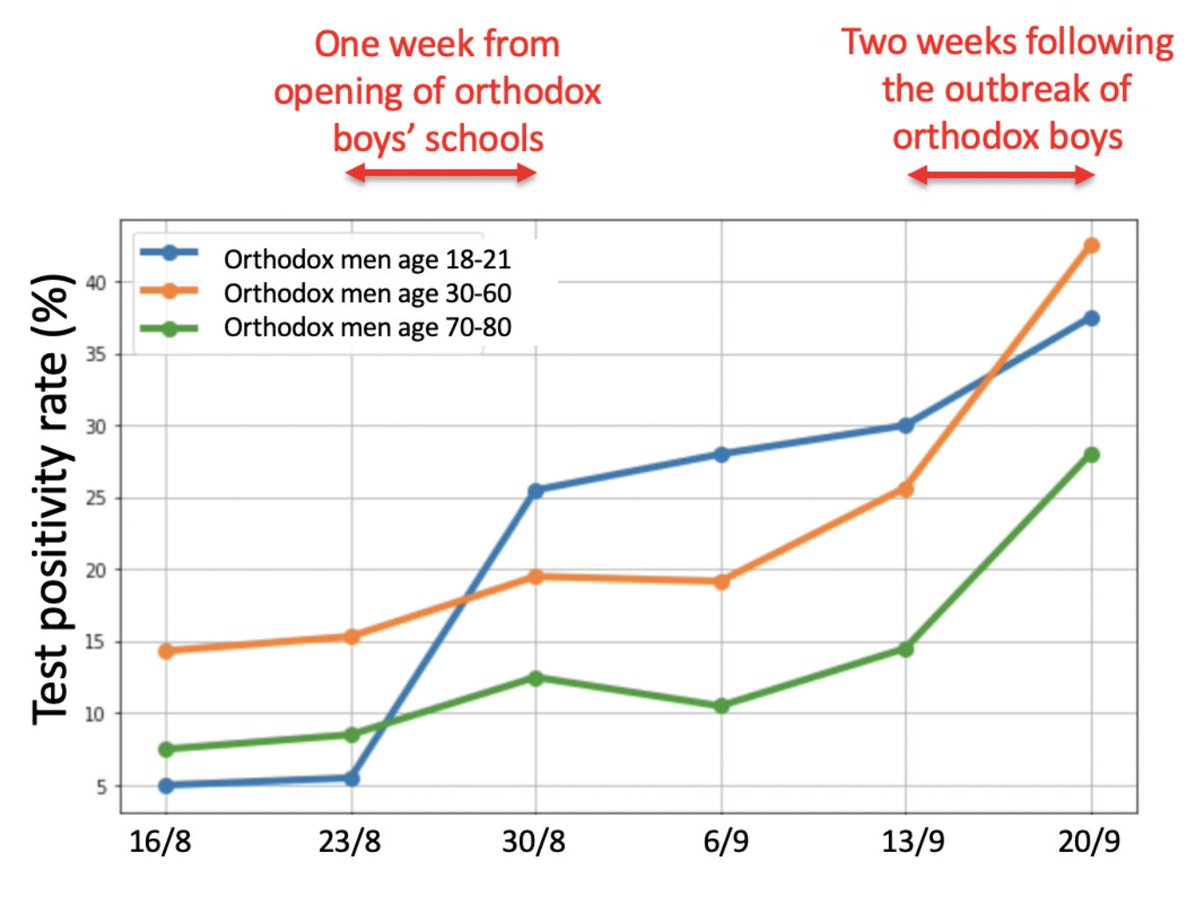
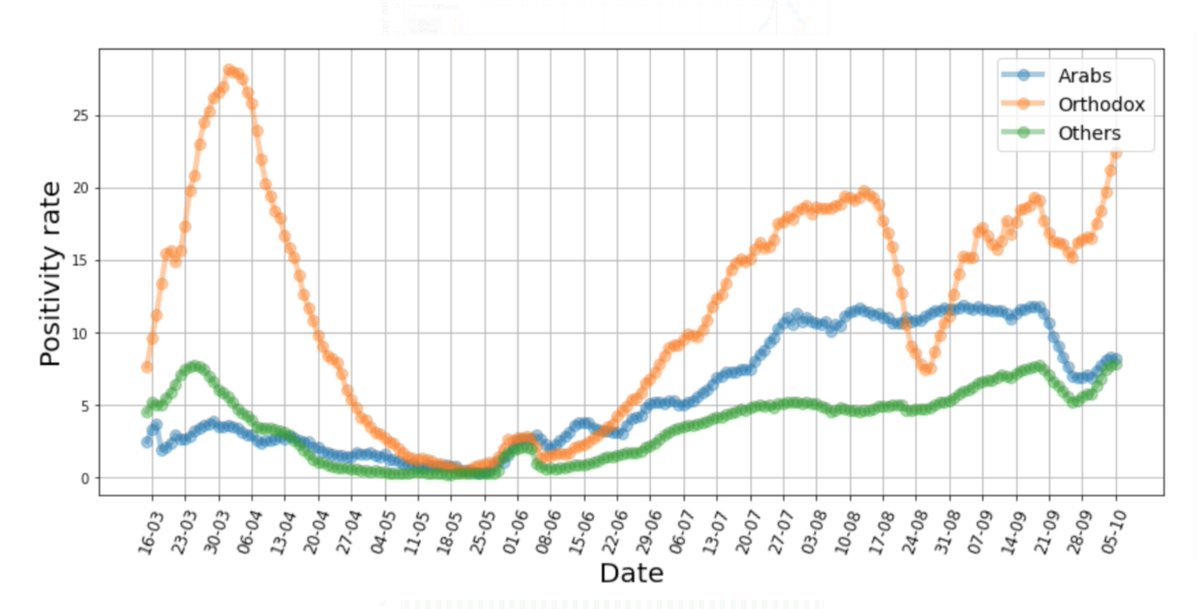
Indeed, it was fragile and unfortunately “broke” upwards. The trigger was the opening of schools. First the orthodox boys, where positivity rate surged from 5% to 25% just 7–10 days after their opening
But two weeks later, the outbreak in the young spread to the older orthodox
But two weeks later, the outbreak in the young spread to the older orthodox
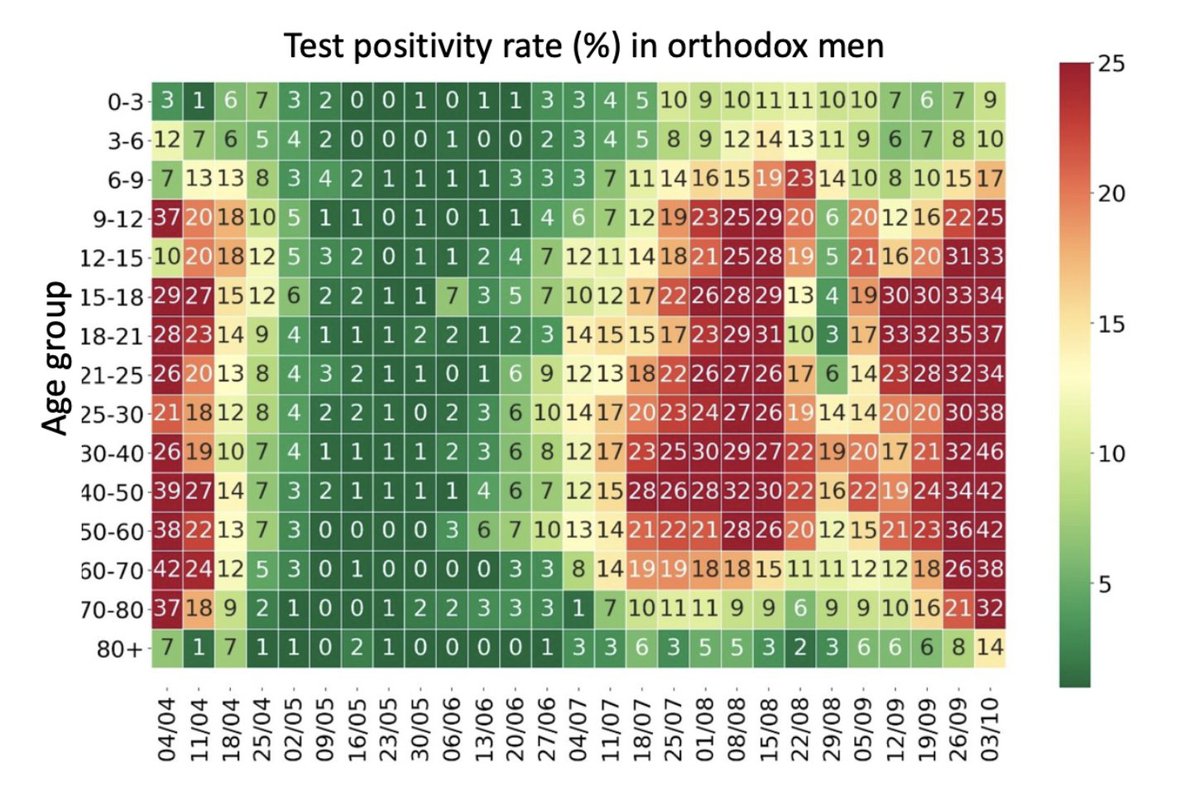
This graph of testing positivity rates in orthodox men clearly shows the spread, across time, within the orthodox population, from the young to the old
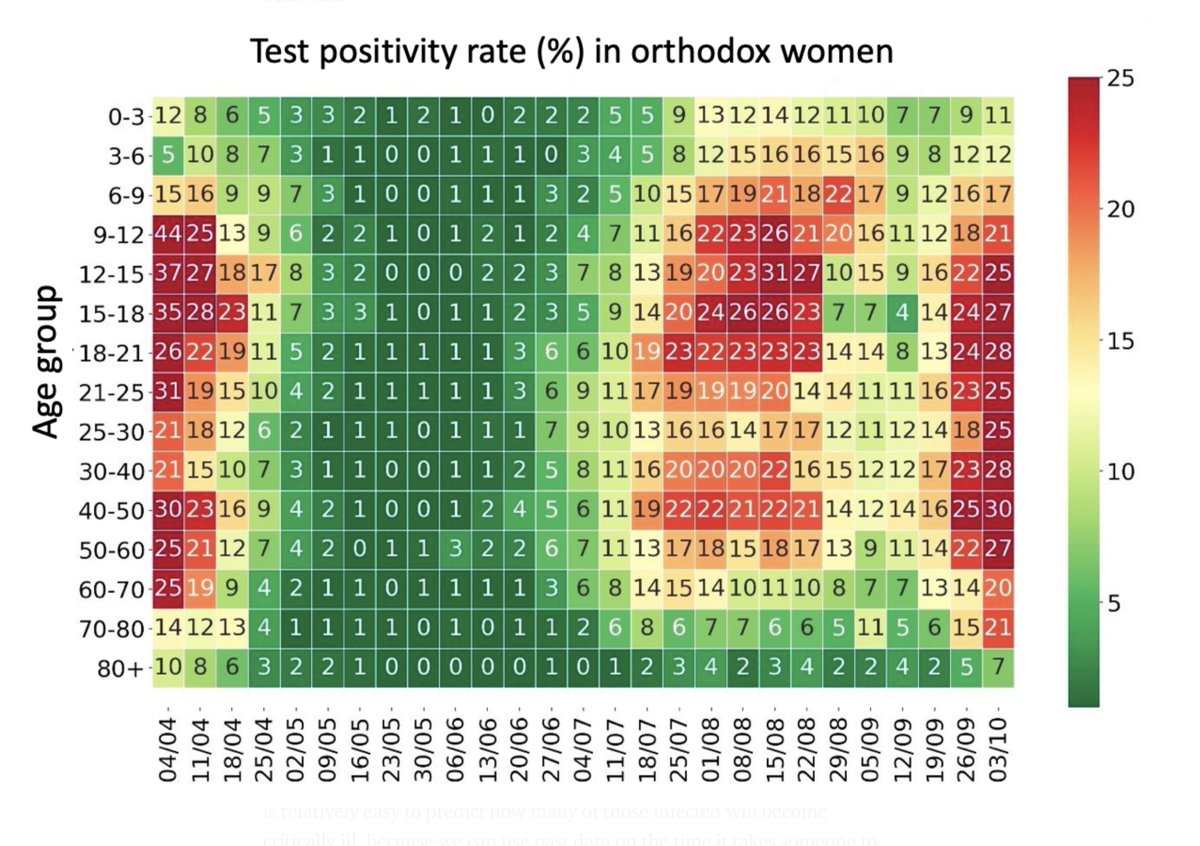
And the spread also reached orthodox women, with lower positivity rates but still very high, above 20% across most age groups
Schools in the general population also resulted in further outbreaks. Many cases were found, many teachers and tens of thousands of kids were quarantined so schooling was both ineffective as well as sparked further outbreaks
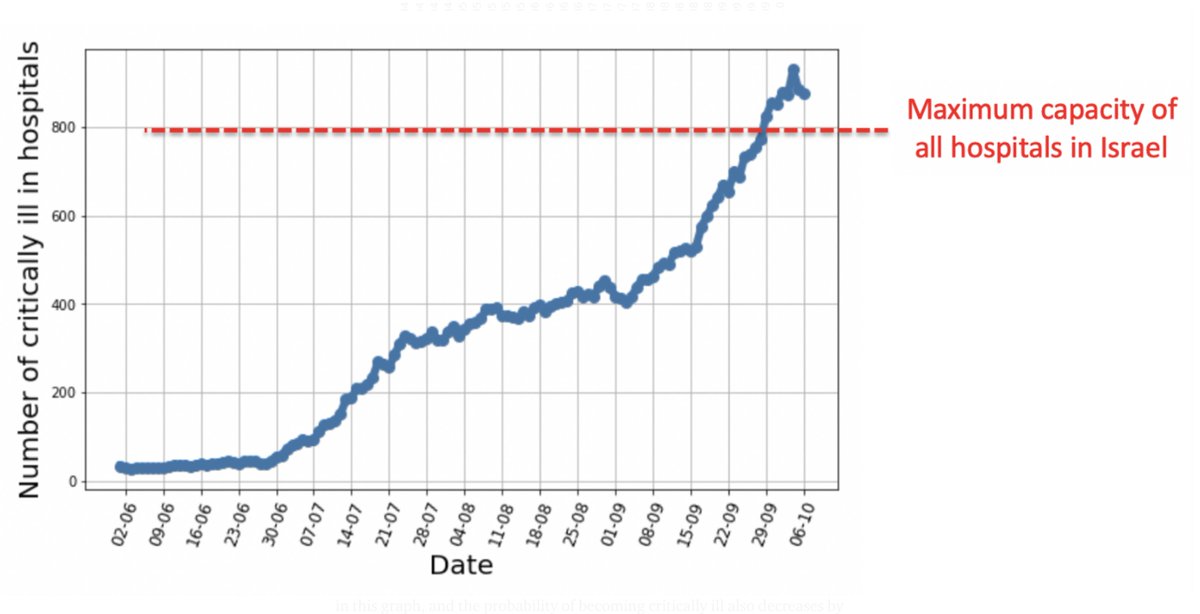
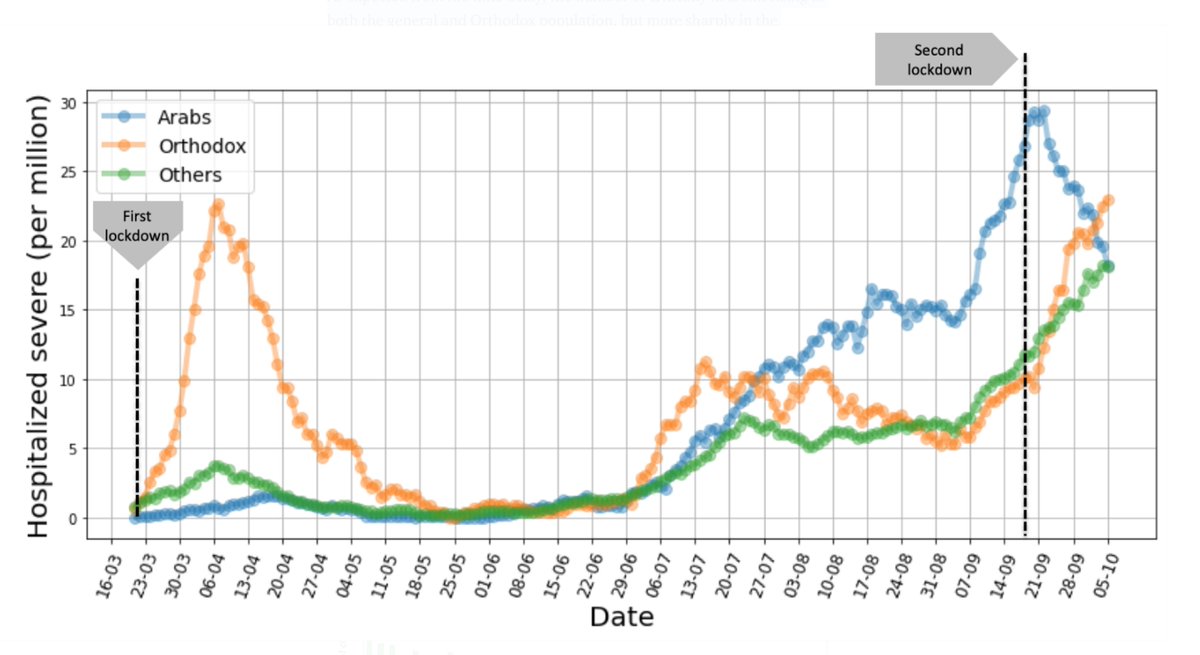
Not surprisingly, critical cases in hospitals accumulated. Around mid-July, with 200 critically ill, a major concern rose around reaching 800, the maximal capacity that the ministry of health set, above which care will deteriorate
In view of this concern, we developed a model for predicting the future number of critically ill patients we expect in hospitals. Incredible work by my students @H_Rossman & @tomer1812!
I will elaborate, as our model can be useful for others until we find time to write it up
I will elaborate, as our model can be useful for others until we find time to write it up
We first had to decide how far in the future we predict. We reasoned that it is relatively easy to predict how many of those infected will become critically ill, because we can use past data on the time it takes someone to become critically ill >>>
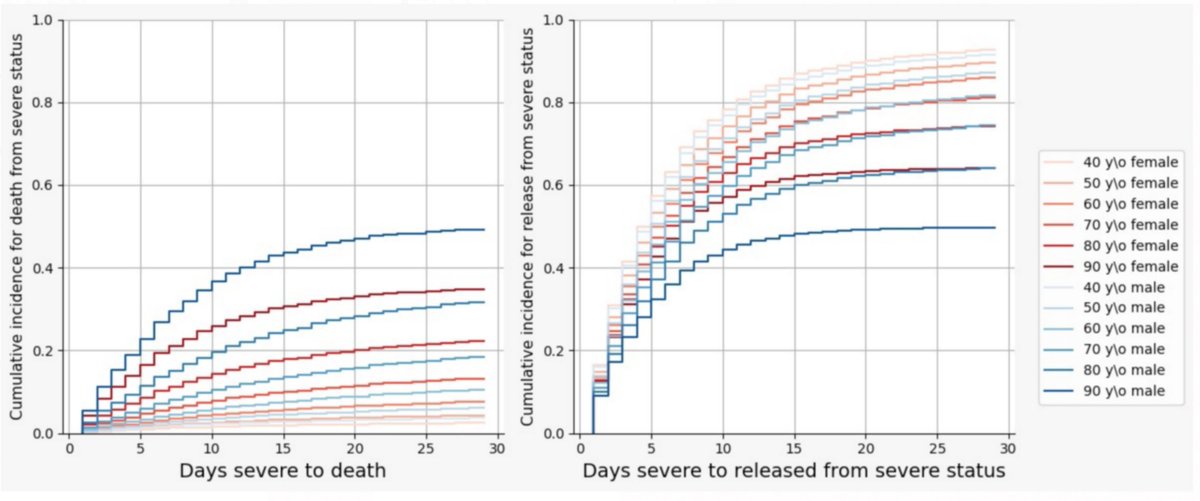
This turns out to depend heavily on age and gender, as in this graph, and the probability of becoming critically ill also decreases by >50% after 5 days from testing positive
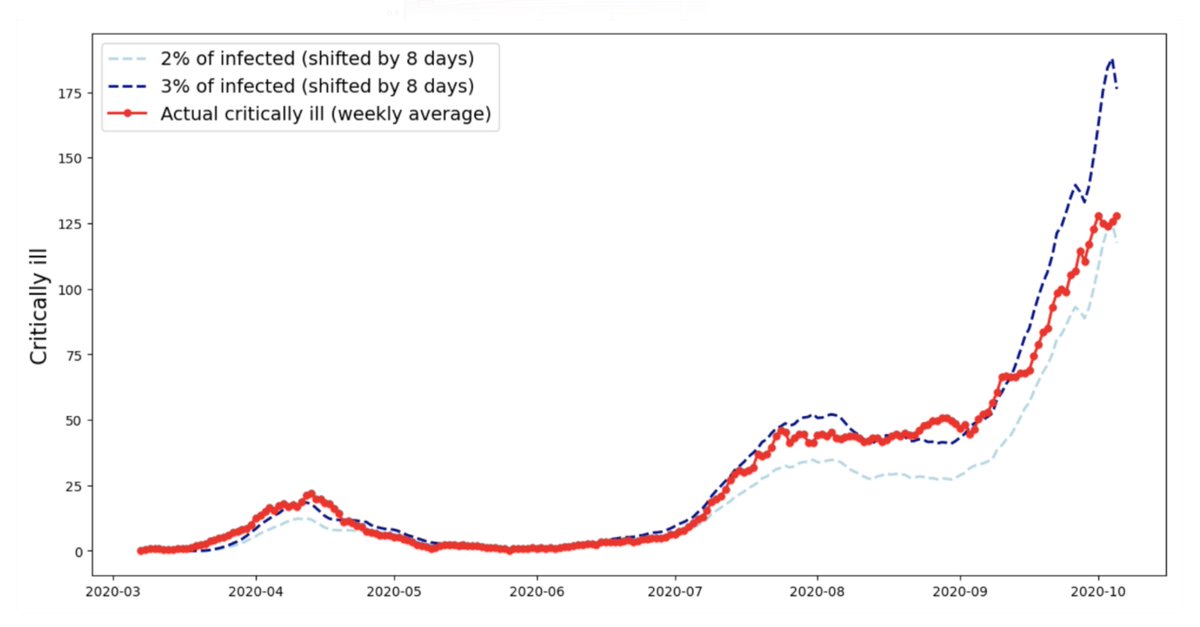
So based on this, it seemed that it should be relatively easy to predict one week ahead. This also matches the rough approximation of 2–3% of those infected becoming critically ill within 8 days, as we saw in Israel throughout the pandemic
On the other hand, to predict more than a week ahead you need to predict future infections and that’s hard… it depends on people’s behavior, government actions, and so many other unknowns. So we decided to focus on the modest task of predicting just one week ahead
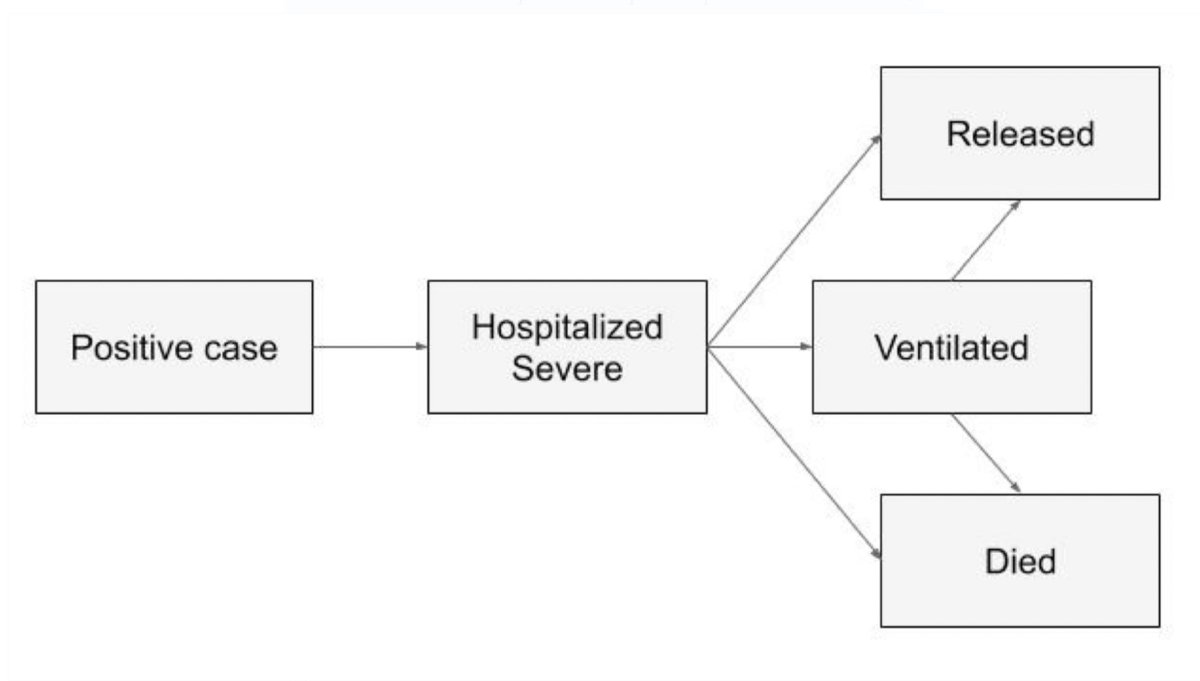
We reasoned that we could go from cases to how many newly critically ill patients there will be. We then had to model the rate of release from a critically ill status to either recovery or death. We learned these rates from hospitalisation data
Overall the model has two parts and is quite simple. Given the COVID-19 positive cases, we predict how many will be critically ill, and from there the transitions to death, recovery, and ventilated states
This model works surprisingly well!
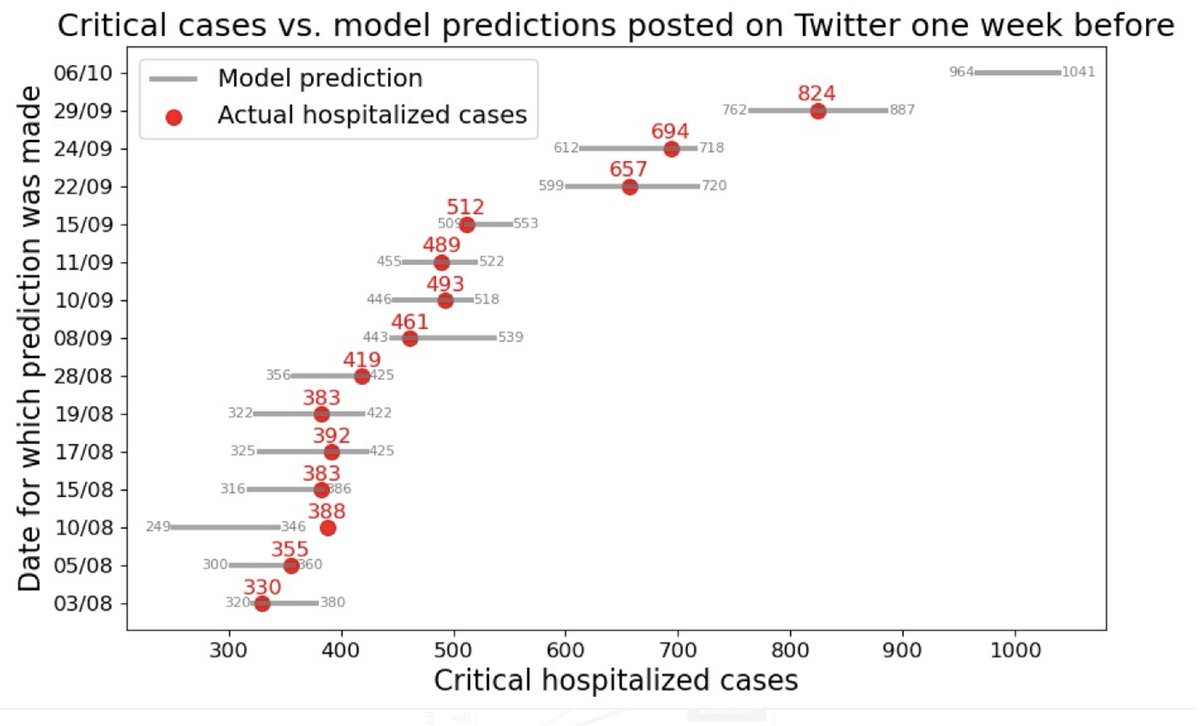
Since August, we posted 14 predictions on Twitter, always a week in advance. All are on my Tweeter feed
Except for one prediction early on, all predictions were within the range we gave, with an average error of 17 critically ill patients
Since August, we posted 14 predictions on Twitter, always a week in advance. All are on my Tweeter feed
Except for one prediction early on, all predictions were within the range we gave, with an average error of 17 critically ill patients
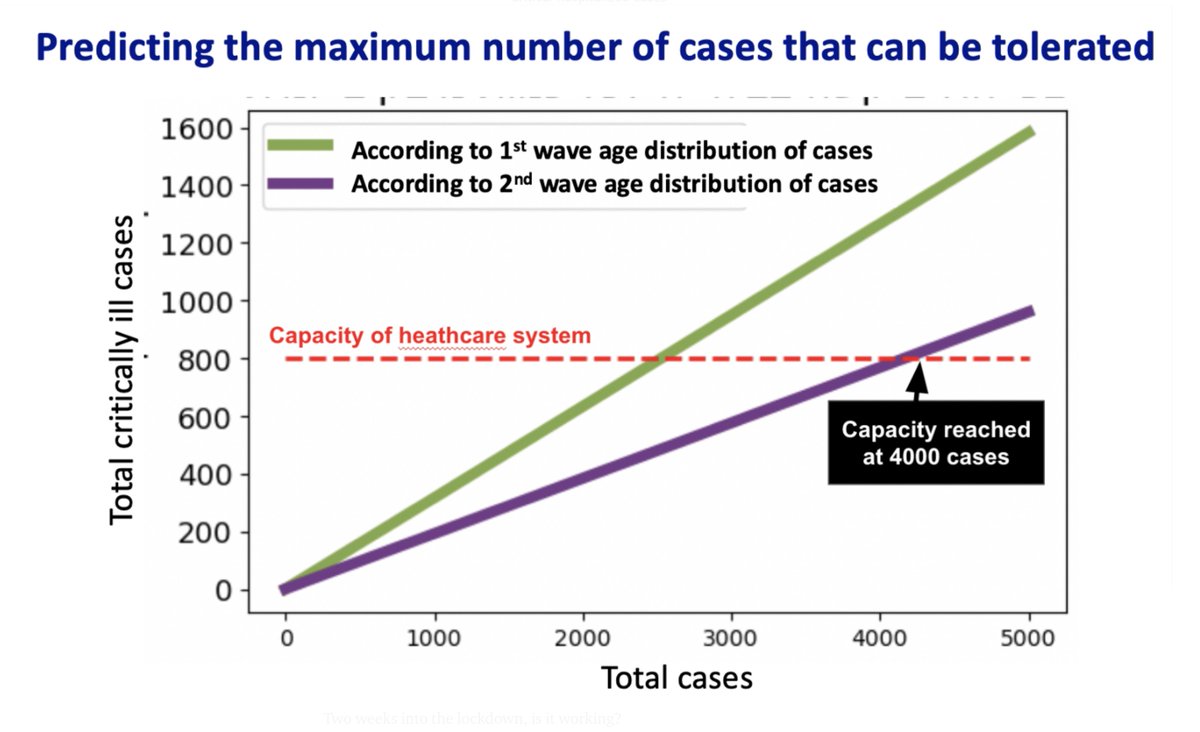
As cases were rising and were at 1500 in mid-July, we also used the model to assess how many daily infected people Israel can handle without reaching its capacity of 800 critically ill patients
@RonnyLinder wrote about our analysis that we could reach 4000 daily cases at steady state and still not reach the limit. At the time, with “only” 1500 which was considered very high, 4000 sounded crazy
Israel did get there and it was still below capacity as we predicted
Israel did get there and it was still below capacity as we predicted
This is the story (Hebrew) https://www.themarker.com/coronavirus/.premium-1.9083239">https://www.themarker.com/coronavir...
Given the accuracy of the predictions, our model was adopted and presented (still is) regularly to the government
As the outbreak continued, on Sep. 17, still with 500 critically ill, we predicted that even if with a strict lockdown then, we will still rise to 900–1000 critically ill, as it will take time for the lockdown to lower cases and then more until the critically ill will drop
We are now three weeks after that prediction and we are indeed above 900 critically ill patients
The story (in Hebrew) https://www.themarker.com/coronavirus/.premium-1.9165597">https://www.themarker.com/coronavir...
The story (in Hebrew) https://www.themarker.com/coronavirus/.premium-1.9165597">https://www.themarker.com/coronavir...
Our dire prediction, along with several other bad indicators, finally pushed the government to implement its second lockdown on Sep. 19, the Jewish New Year’s eve. One week later, it further tightened the lockdown to a very strict one
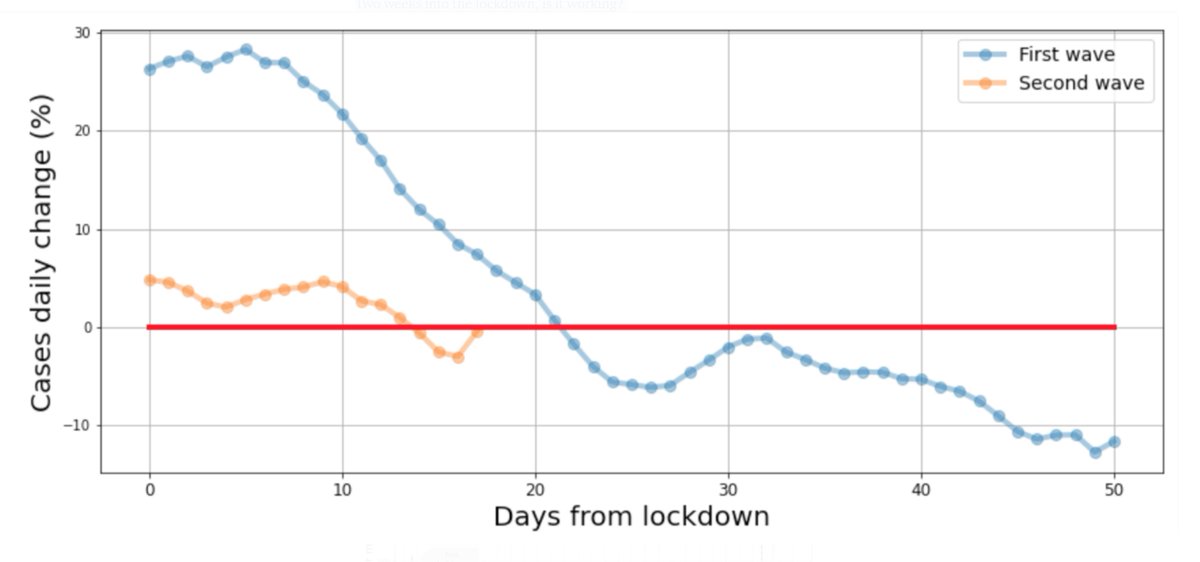
Two weeks into the lockdown, is it working?
Yes
The rise in cases stopped. The rate of decline is lower than the first lockdown but the trend is downward, both in cases and in the more reliable measure of new critically ill patients
Yes
The rise in cases stopped. The rate of decline is lower than the first lockdown but the trend is downward, both in cases and in the more reliable measure of new critically ill patients
However, when breaking this into populations, the effect of the lockdown is clear in both the Arab and general population, but the cases in the orthodox population continue to rise
Per capita, Orthodox have 5 times more cases than the general population, and despite being 12% of the population, they currently account for 45% of all cases
As expected from the time delay, the number of critically ill is still rising in both the general and Orthodox population, but more sharply in the Orthodox population
The amount of unaccounted for cases in the Orthodox population is also very high, evident by their very high testing positivity rate which reached 25% in both the first wave and currently
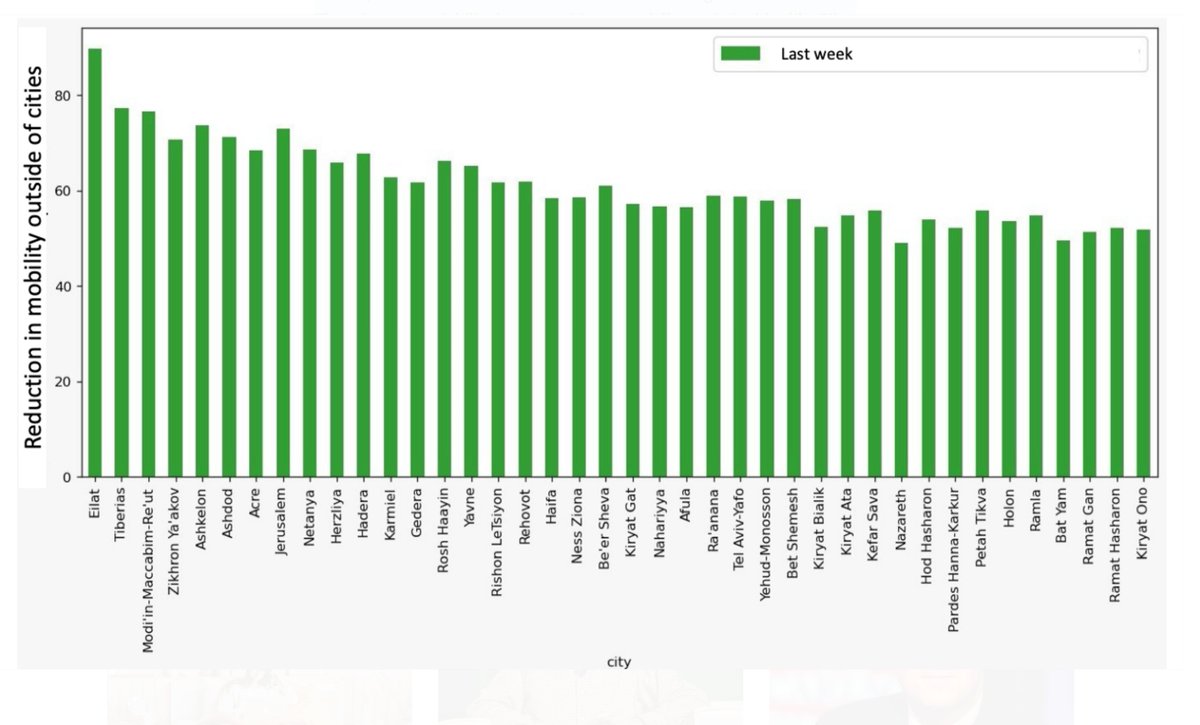
Finally, by mobility data, we also see the effect of the lockdown, with a 60% decline, somewhat less than the 75% decline following the first lockdown. There is some variability between cities, especially touristic cities like Eilat with >80% decline
Where is this going?
Eventually the numbers will go down, and hopefully we will be smarter in following a strategy for safely exiting this lockdown which is being devised these days
Last time we did not have an exit strategy...
Eventually the numbers will go down, and hopefully we will be smarter in following a strategy for safely exiting this lockdown which is being devised these days
Last time we did not have an exit strategy...

 Read on Twitter