Let& #39;s talk minority voter suppression for a moment, and in "honor" of Cambridge Analytica, let& #39;s use some data to back it up. Specifically, let& #39;s use the MIT Science Lab& #39;s Election Data and County Presidential Election Returns 2000-2016 and the US Census estimates for 2016
Some of you may have seen @Channel4News discussing the Trump campaign& #39;s use of Cambridge Analytica to target Facebook and other ads to black voters for "Deterrence." The question you may ask is, "How do I know if his is true or if it even worked?"
There are three strategies to winning an election in the US: get everyone to *want* to vote for you, get people who don& #39;t like you not to vote, and get people who don& #39;t like you to waste their time voting for a 3rd party candidate. Those last two would fall into "Deterrence"
Take the last one first: third-party candidates. Most of you probably remember Jill Stein& #39;s worthless run for the presidency. You may also remember she made regular appearances on Russian state-run RT News. Hopefully you& #39;ve forgotten her 90& #39;s folk-band recordings. *shudders*
But 3rd-party candidates in the US get nowhere, so what& #39;s the point, right?
If we look at the election data and compare how the candidates fared in counties where Trump won and where he lost, something interesting emerges:
If we look at the election data and compare how the candidates fared in counties where Trump won and where he lost, something interesting emerges:
In counties where Trump won -and lost - the Democrat& #39;s average percentage of the vote dipped from the previous year - and the 3rd-parties (& #39;other& #39;) went up. A lot. Nearly tripled, in fact from 2% to almost 6% among Clinton-won counties :
OK, so what about the other "Deterrence" effect: get them not to show up? Could social media and negative advertising *really* make that much of a difference?
In a word... yeah.
Bring in the Census data! (that thing Ross is trying to kill right now).
In a word... yeah.
Bring in the Census data! (that thing Ross is trying to kill right now).
It may be no surprise that the mean per-county percentage of African-Americans in Trump-winning counties was about 1/3 that of Clinton& #39;s. What may surprise you is that the black vote in Trump& #39;s "flipped" counties is significantly higher than his other counties
In fact, they go as high as 49% black. If you look at those "flipped" counties by how many people actually voted *on average* you could be forgiven for saying no voter suppression occurred - in fact it *looks* like voting went up - just not for the Ds. But averages are funny...
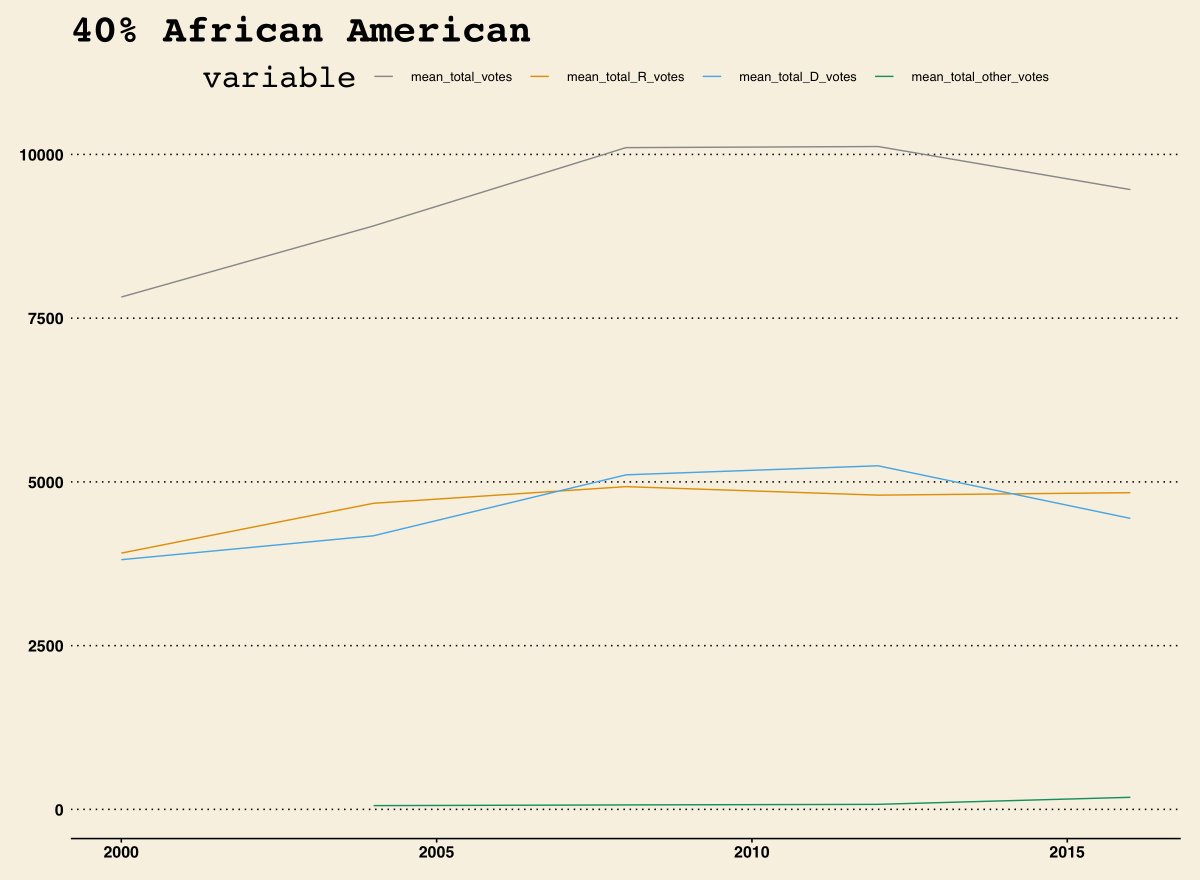
Someone once told me: You can hide a lot of sins in an average. What if we look at Trump& #39;s "flipped" counties where over 30% of the population is African-American?
It should be clear what& #39;s going on: Though we can& #39;t tell which votes were cast by black voters, the higher percentage, the more the total vote count in those counties fell - as did the votes for Ds - and 3rd-party votes can& #39;t explain it.
R votes didn& #39;t change. Think about that.
R votes didn& #39;t change. Think about that.
Trump did not flip these counties by getting more republicans to vote for him, he flipped them by getting *fewer people to vote* - especially minorities.
A GOP strategist once wrote about this in chillingly casual terms:
https://www.npr.org/2020/01/05/785672201/deceased-gop-strategists-daughter-makes-files-public-that-republicans-wanted-sea">https://www.npr.org/2020/01/0...
A GOP strategist once wrote about this in chillingly casual terms:
https://www.npr.org/2020/01/05/785672201/deceased-gop-strategists-daughter-makes-files-public-that-republicans-wanted-sea">https://www.npr.org/2020/01/0...
This is voter suppression. This is why the Postmaster General doesn& #39;t want to deliver ballots, and why Wilbur Ross doesn& #39;t want a complete census, and why some have been trying everything they can to make voting harder. If everyone votes, they lose. Democracy is inconvenient.
Look, I know you& #39;ve heard this a million times, but VOTE! If it wasn& #39;t important - if it didn& #39;t make a difference - they wouldn& #39;t spend MILLONS to stop you from doing it!
It is your right. Don& #39;t lose it.
It is your right. Don& #39;t lose it.
PS - When I get a chance, I will publish a full GitHub repo with all the data sources and calculations spelled out so you can check (and maybe improve) my work.

 Read on Twitter


