Tata steel Detailed Analysis
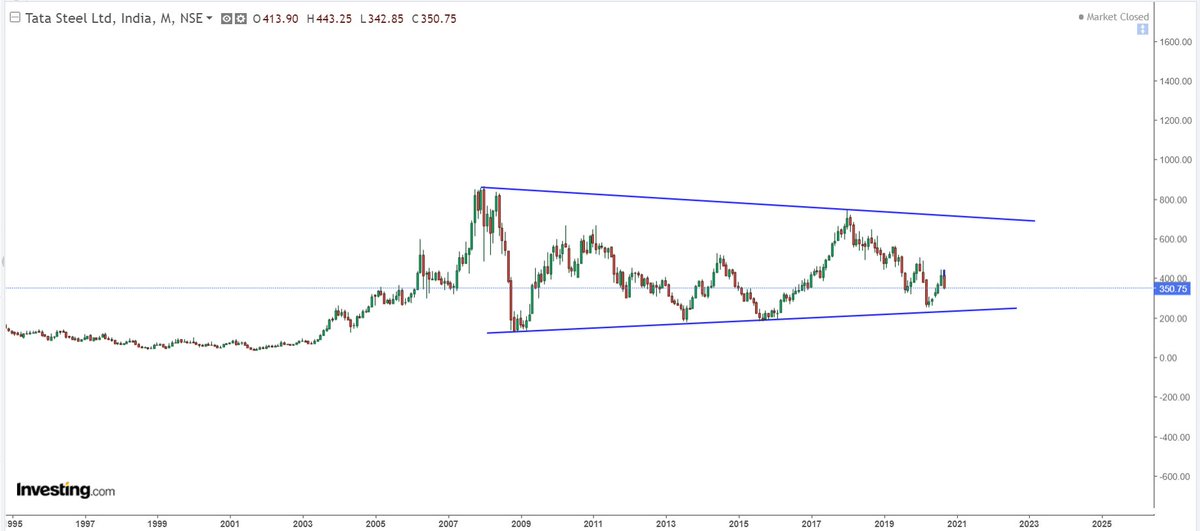
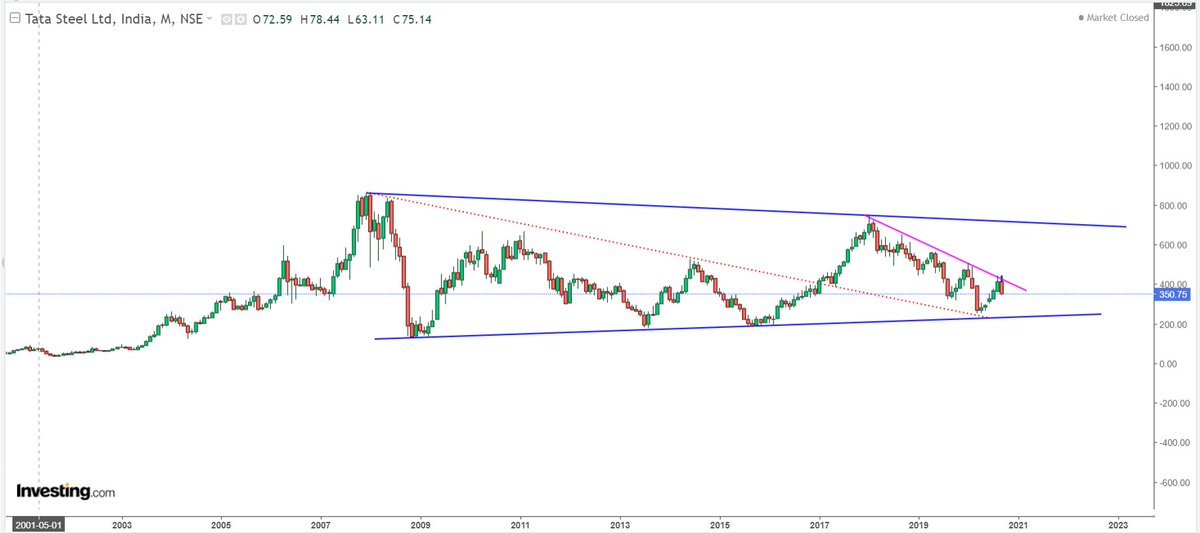
1. on monthly chart stock has underperformed since 2007.
2. Traded between 185-195 band on lower side & 600-710 on upside
3. Stock hit lower trendline for 4th time.
4. Stock crossed 2010-2011-2014 high in 2018 indicating long term trend change
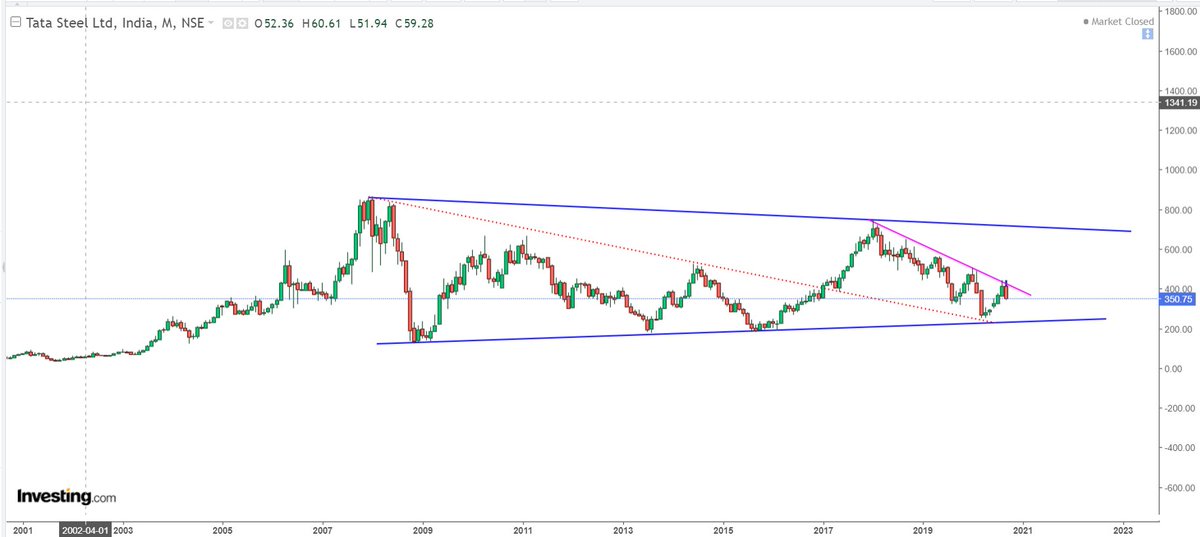
1. on monthly chart stock has underperformed since 2007.
2. Traded between 185-195 band on lower side & 600-710 on upside
3. Stock hit lower trendline for 4th time.
4. Stock crossed 2010-2011-2014 high in 2018 indicating long term trend change
5. Fall from 2018 highs stopped near lower trendline from 2008-2013-2015.
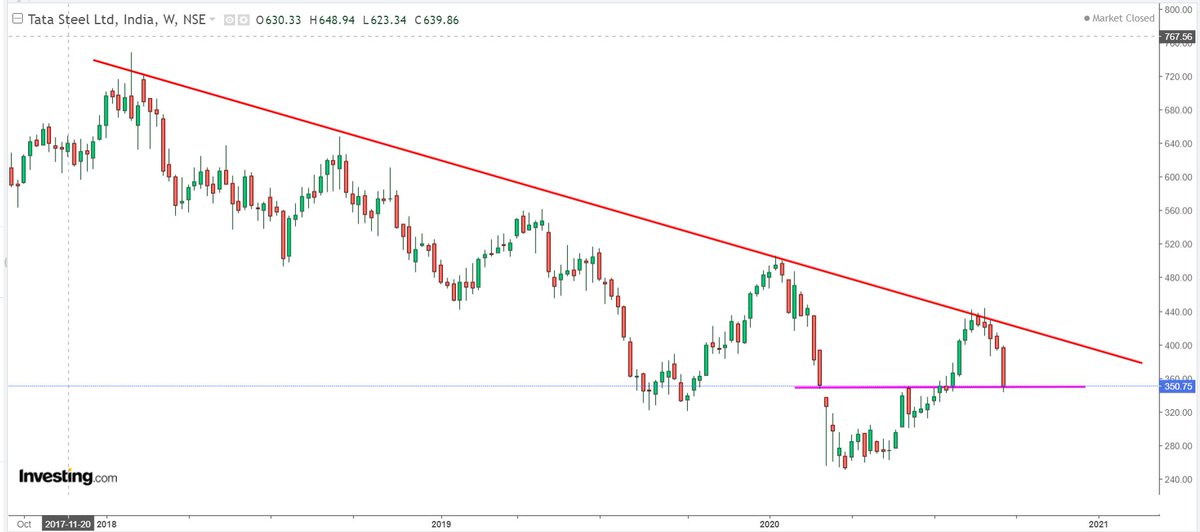
6. Stock hit pink trendline everytime it bounced and went on to make new low as it was in bear market.
7. It made 5 attempts on pink trendline. Recent high 443 is the 5th attempt and dipped from there.
6. Stock hit pink trendline everytime it bounced and went on to make new low as it was in bear market.
7. It made 5 attempts on pink trendline. Recent high 443 is the 5th attempt and dipped from there.
8. Stock has nearly retraced 50% of previous rise from 250 to 443 (347 is 50% fibo level)
9. It is also retesting previous top around 340-350 zone post dip
10. This is a weekly chart. After 5 attempts, next attempt could be a breakout for this stock to higher levels(500-510)
9. It is also retesting previous top around 340-350 zone post dip
10. This is a weekly chart. After 5 attempts, next attempt could be a breakout for this stock to higher levels(500-510)
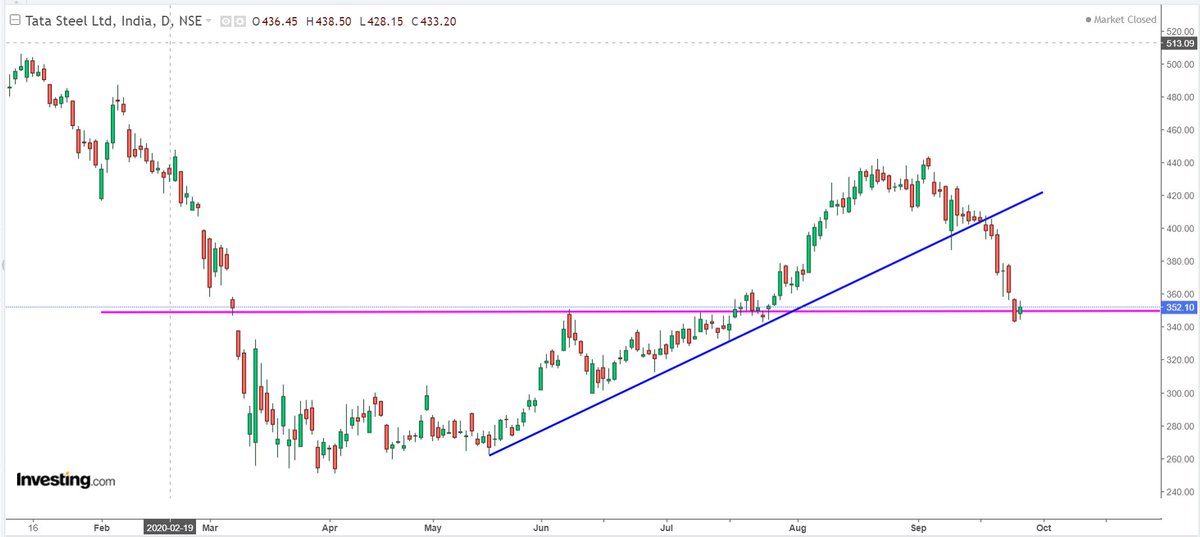
11. on daily chart, today stock formed Bullish harami candlestick pattern and retested previous top around 340-350 levels.
12. 61.8% fibo is at 327, that is my worst case scenario.
13. confirmation for Bullish harami pattern is above 358.
14. 375-77 resistance on the way up
12. 61.8% fibo is at 327, that is my worst case scenario.
13. confirmation for Bullish harami pattern is above 358.
14. 375-77 resistance on the way up
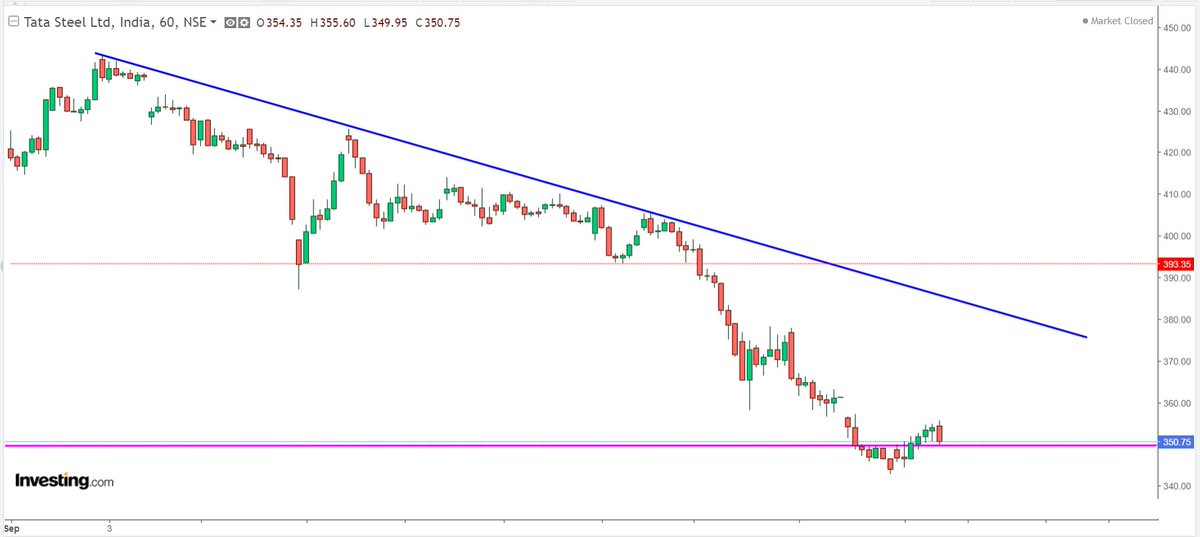
15. on 60min chart stock faced resistance at 350 for 5 hours and today managed to cross it and retested it.
16. For short term SL should be placed below 340 and upside can be 377-380 in extreme short term.
17. Blue trendline on hourly chart can act as resistane (377-380)
16. For short term SL should be placed below 340 and upside can be 377-380 in extreme short term.
17. Blue trendline on hourly chart can act as resistane (377-380)

 Read on Twitter