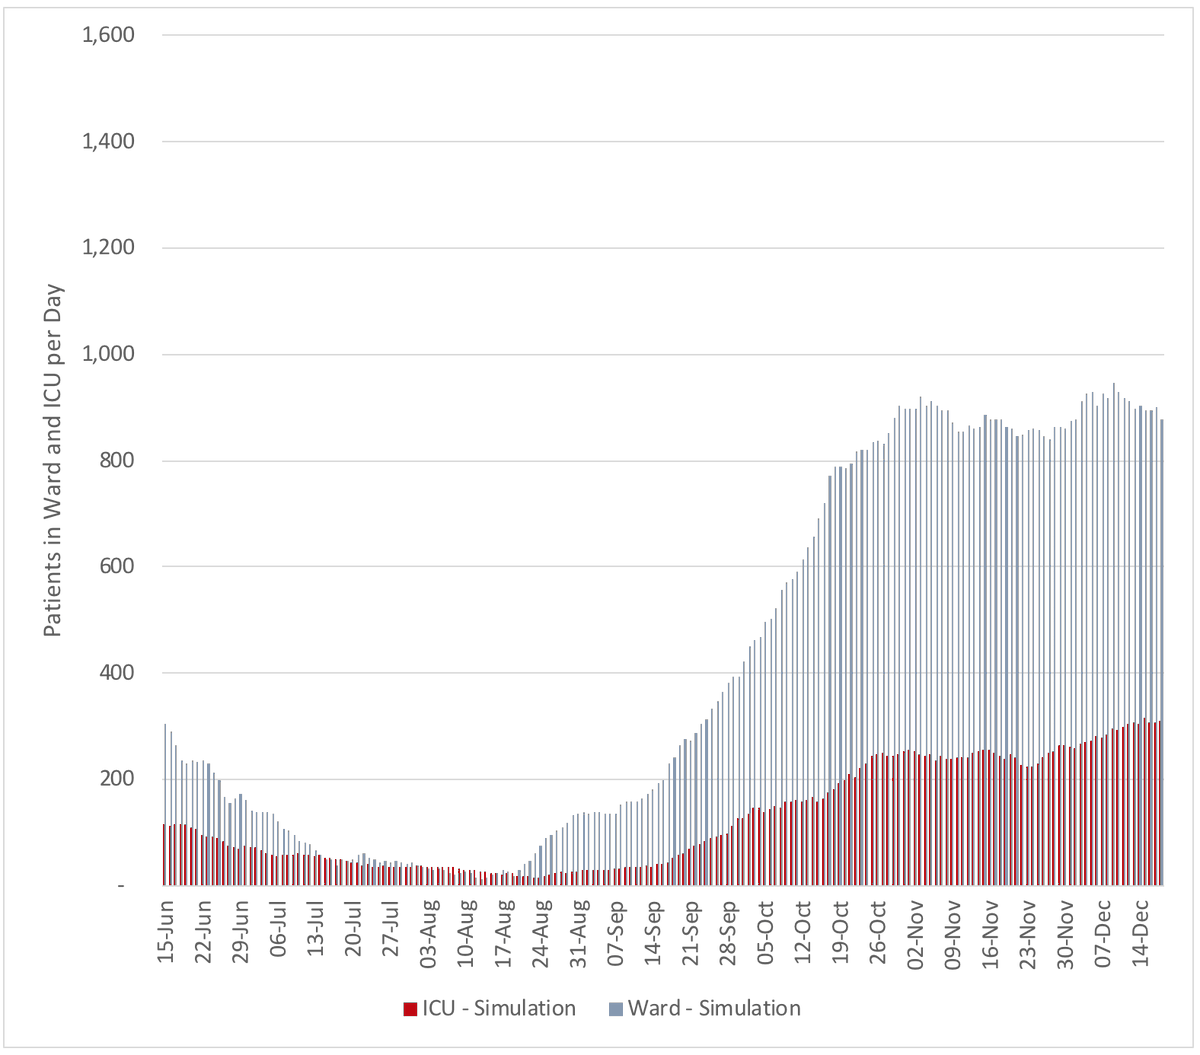
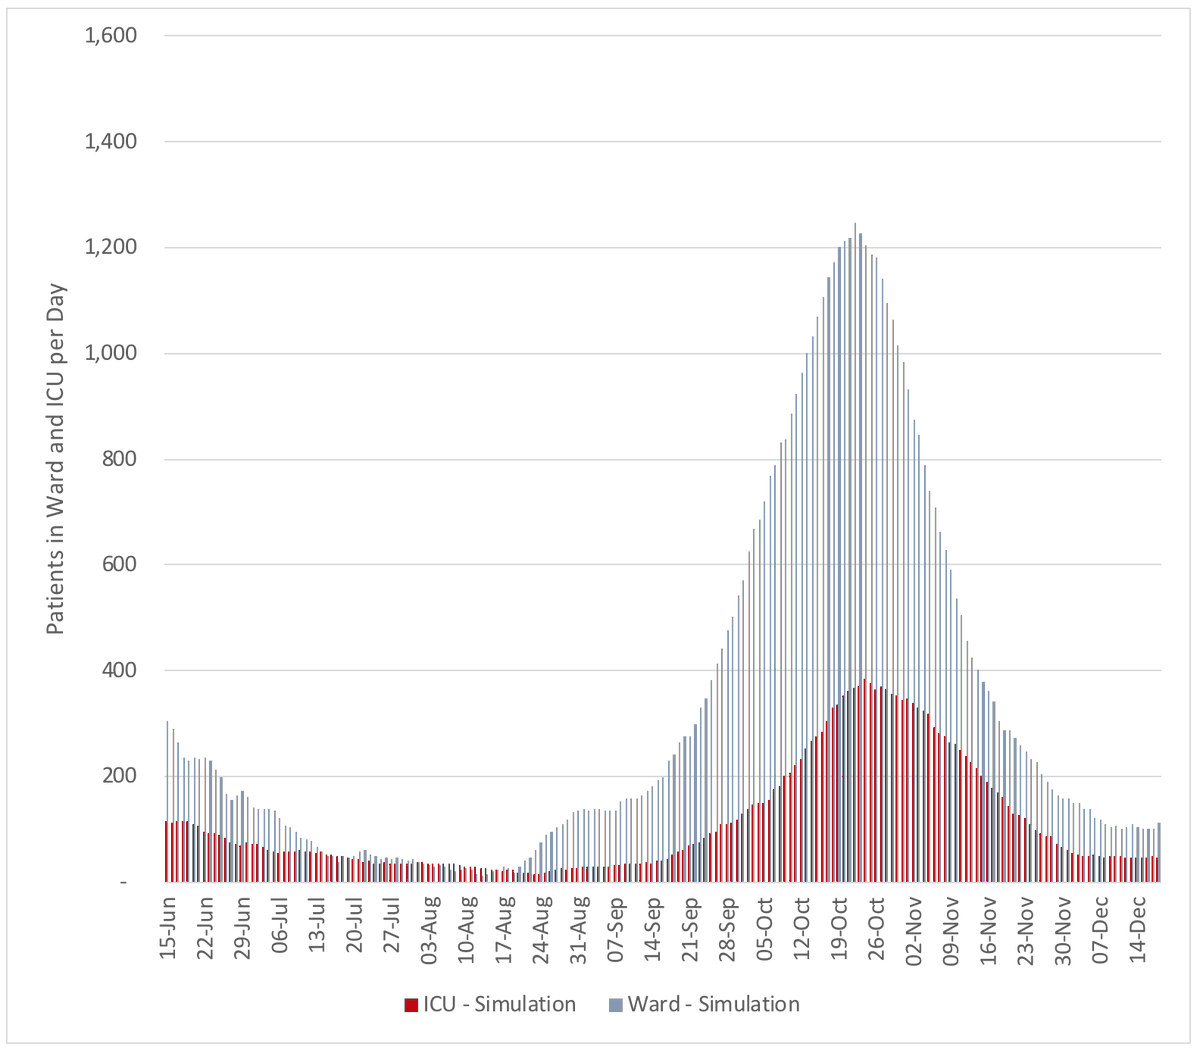
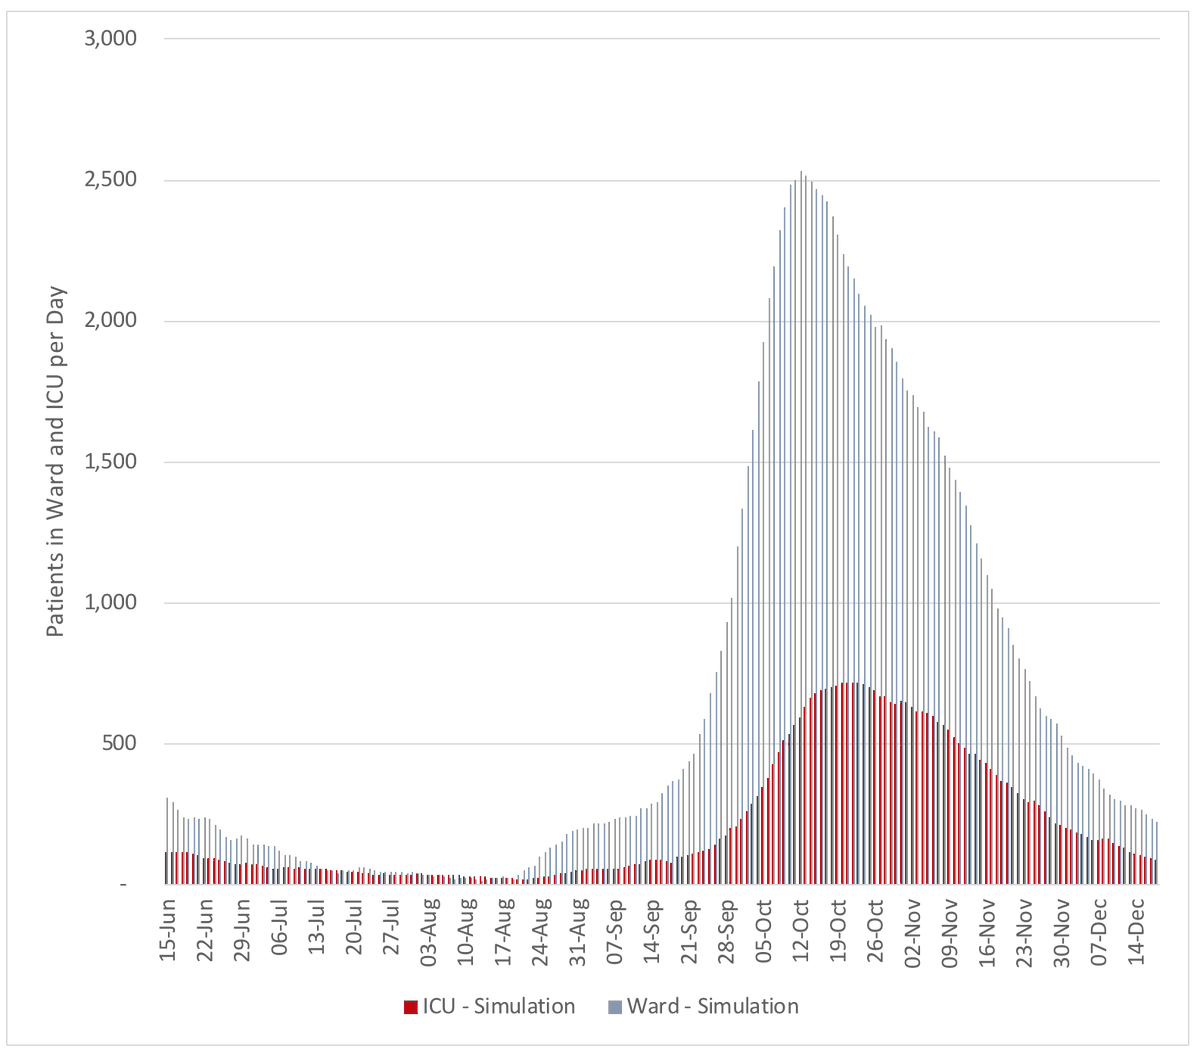
1/ We have updated our model and have predictions for Ontario’s second wave from the COVID-19-Modeling Collaborative. #onpoli #COVID19
2/ We considered 4 potential second wave epidemic curves, from best to worst: Ontario’s 1st wave, 2nd waves in Michigan and Victoria (peer jurisdictions), and Italy’s 1st wave.
3/ We considered three scenarios of risk for hospitalization among those infected: low-risk (fewer hospitalizations), average risk, and high-risk (more hospitalizations) based on observations of hospitalization rates in Ontario.
4/ Parameters for rates of mechanical ventilation and ward/ICU LOS based on Ontario or high quality international data.
5/ Our “best” case scenario (epidemic curve like Ontario’s first wave, and low rate of hospitalization among cases) shows a peak of cases in hospital in mid-late October, with <120 cases in ward, and ~ 100 in ICU at peak. This is fewer cases than was observed in March/April 2020
6/ Our scenario considering an epidemic curve like Michigan’s second wave and intermediate rate of hospitalizations among cases shows a peak of new cases in late October-early November, with sustained numbers hospitalized (>800 in wards and >200 cases in ICU) for many weeks.
7/ Our scenario considering an epidemic curve like Victoria’s second wave and an intermediate rate of hospitalizations among cases shows a peak of cases in mid-late October, with >1200 patients in ward and >350 patients in ICU beds at peak.
8/ Our “worst” case scenario (epidemic curve like Italy’s first wave and a high rate of hospitalization among cases) shows a peak of new cases in early-mid October, with >2000 patients in wards and >600 patients in ICUs. This would overwhelm our hospital system.
Thanks to collaborative team members for their great work: @_StephenMac @RaphaelXimenes @DrKaliBarrett @YasinAzimKhan @david_naimark @BeateSander

 Read on Twitter


