A little over a week ago Nick sent off this tweet about determining drive quality independent of outcome. After some help and conversations with him, I think I& #39;ve gotten to an okay spot to talk about my model for Predicted Drive Points in CFB https://twitter.com/nickwan/status/1305570840726122501">https://twitter.com/nickwan/s...
So what exactly is this model?
This first swing is a logistic regression to determine the probability a team scores a Touchdown, Field Goal, Safety, or have a Turnover go for a Touchdown on a given drive. From these probabilities I calculate a simple expected value
This first swing is a logistic regression to determine the probability a team scores a Touchdown, Field Goal, Safety, or have a Turnover go for a Touchdown on a given drive. From these probabilities I calculate a simple expected value
What are the inputs?
Success Rate - % of time the offense gets 40% of yards to go on 1st down, 60% on 2nd, convert on 3rd or 4th
Points Created - Total EPA * Success Rate
EPA/Play
Standard Deviation of EPA
Starting yardline
Score Difference
# of plays
Starting time of drive
Success Rate - % of time the offense gets 40% of yards to go on 1st down, 60% on 2nd, convert on 3rd or 4th
Points Created - Total EPA * Success Rate
EPA/Play
Standard Deviation of EPA
Starting yardline
Score Difference
# of plays
Starting time of drive
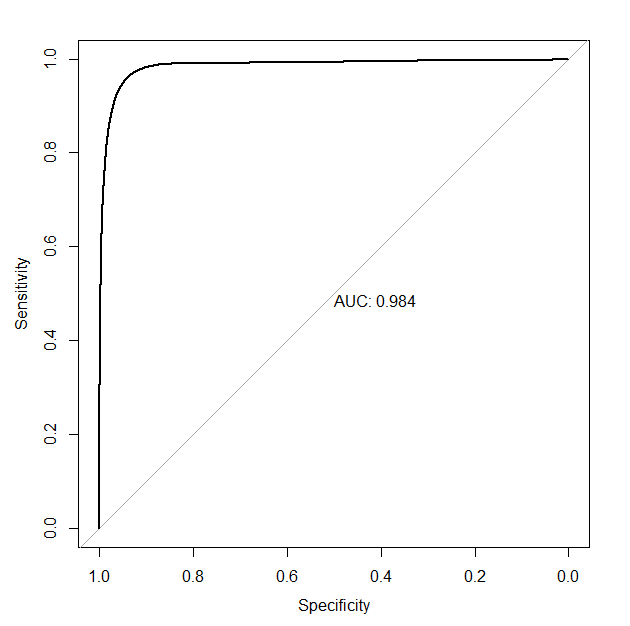
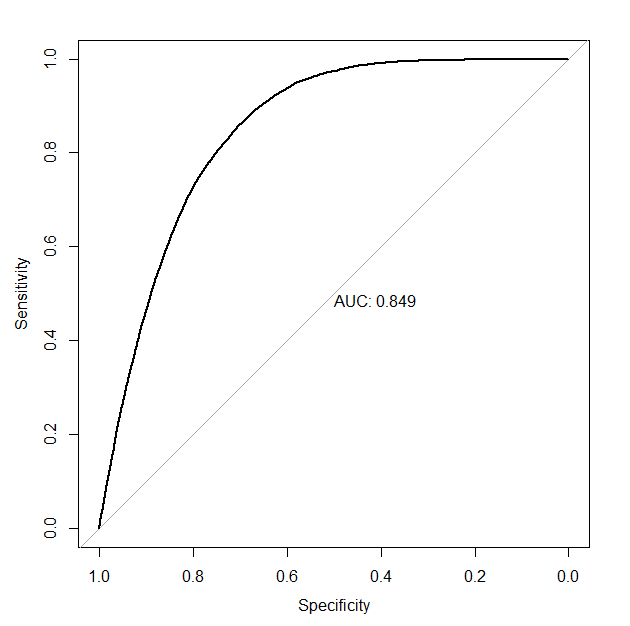
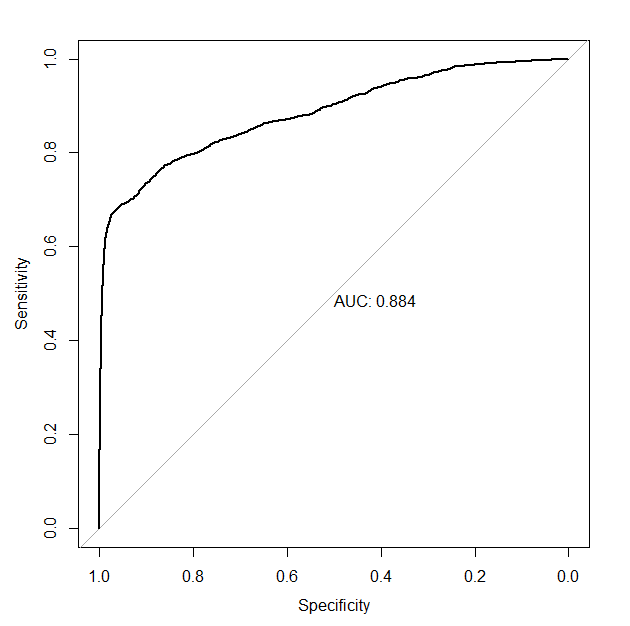
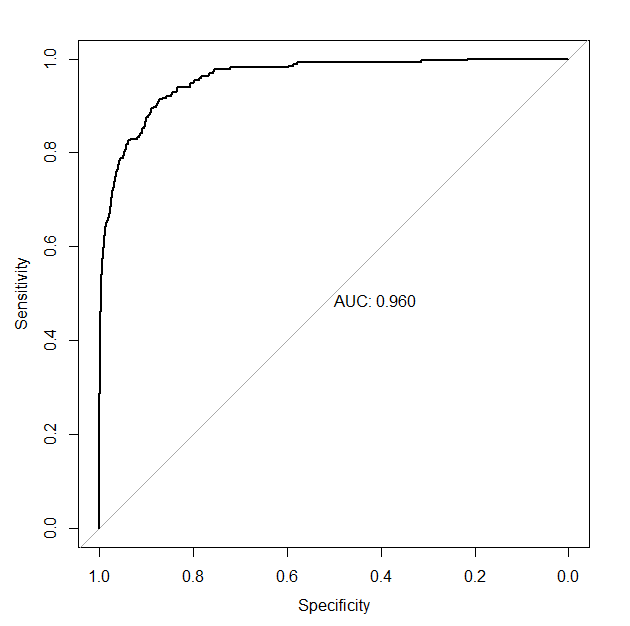
So how well do each of the Logistic Regressions predict their desired outcome? Shockingly well tbh
I apologize for the lack of titles (pROC is annoying), but clockwise these are TD - 0.984, then FG - 0.849, then Opp TD - 0.884, and Safety - 0.96. This is promising.
I apologize for the lack of titles (pROC is annoying), but clockwise these are TD - 0.984, then FG - 0.849, then Opp TD - 0.884, and Safety - 0.96. This is promising.
This does lead to an issue off the cuff. ~15% of the time a drive is predicted to score >7 points. To circumvent this problem it would be best to do a multinomial logistic regression, (s/o @PFF_Eric for that insight) but I do not feel comfortable enough with that rn to use it
Okay cool that each of these are ~accurate, but what do the best drives look like according to the model?
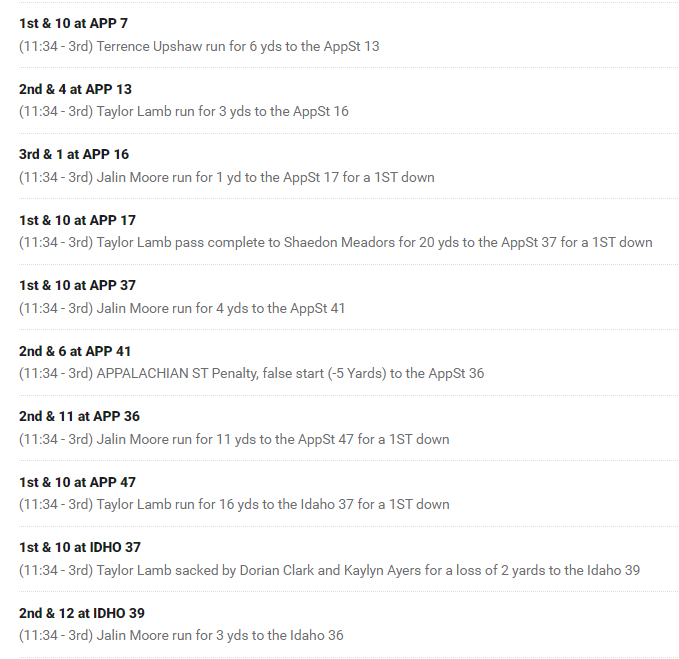
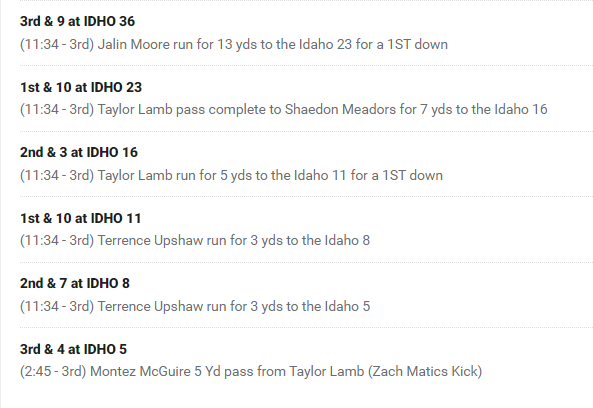
One of the best is this drives is from when App State played Idaho in 2015. 15 plays, 93 yards, with consistent gains. This is good, you would expect to score from this
One of the best is this drives is from when App State played Idaho in 2015. 15 plays, 93 yards, with consistent gains. This is good, you would expect to score from this
And what do the worst drives look like?
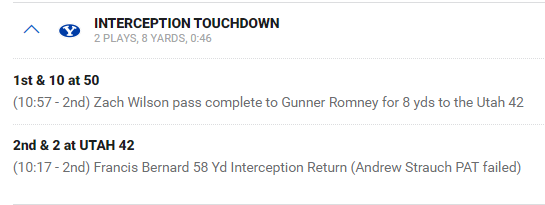
This is the worst drive according to the model. A 2 play pick 6 by BYU in their 2019 Week 1 matchup against Utah. I am not terribly sure how to feel about the worst drives all looking like this
This is the worst drive according to the model. A 2 play pick 6 by BYU in their 2019 Week 1 matchup against Utah. I am not terribly sure how to feel about the worst drives all looking like this
Good cherrypicks, but how well does it predict drive outcome on the whole?
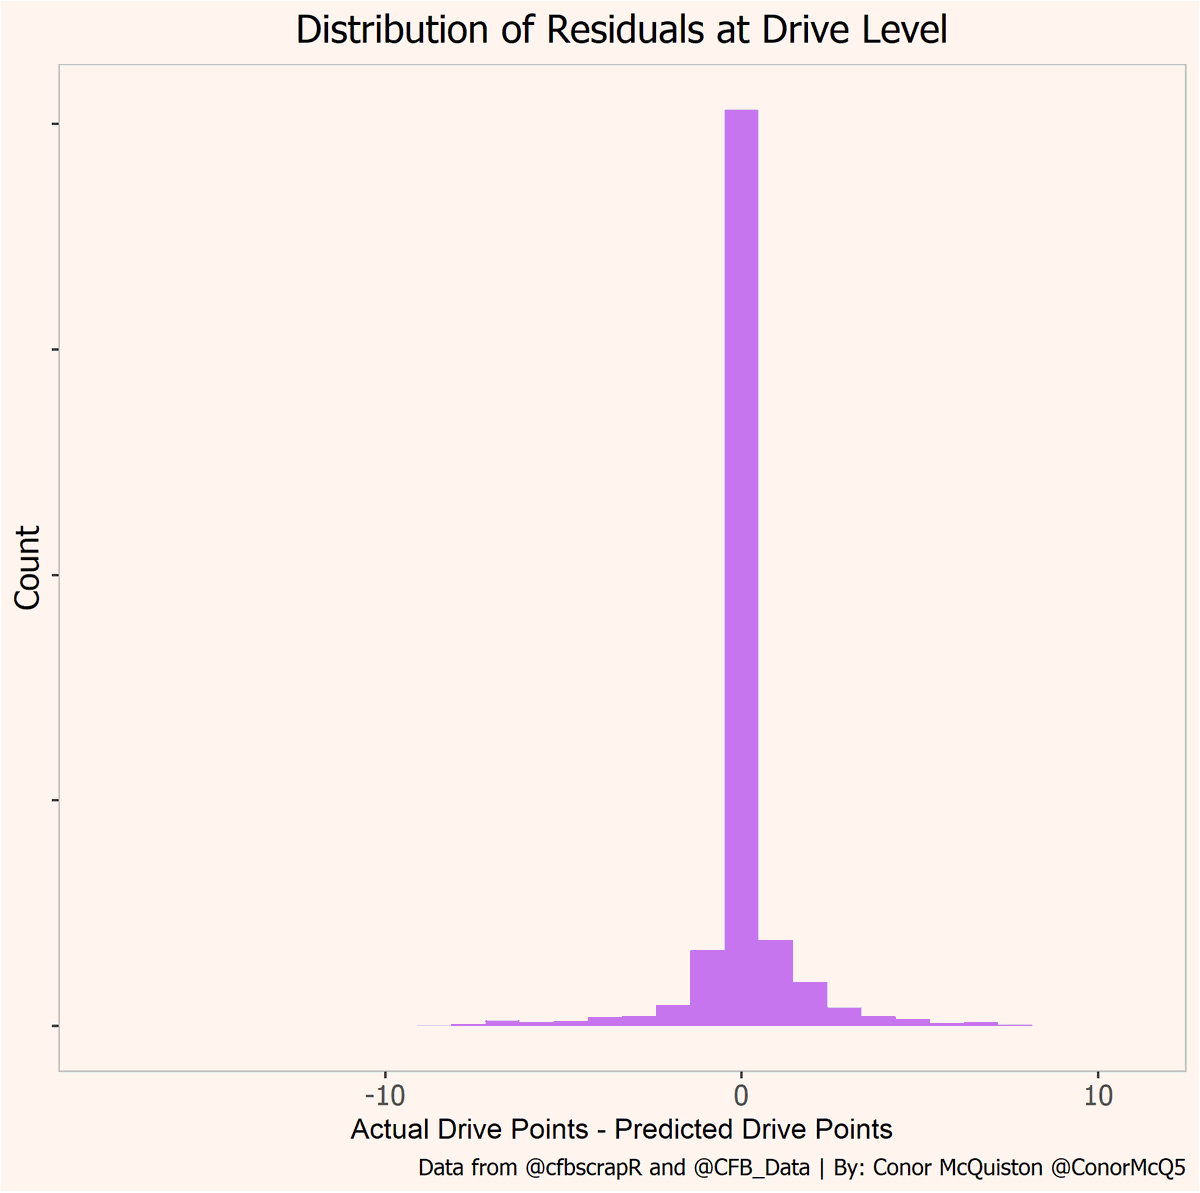
It generally follows the trend of actual scoring well, but it underpredicts FGs. This seems to even out though considering how small the residuals usually are.
It generally follows the trend of actual scoring well, but it underpredicts FGs. This seems to even out though considering how small the residuals usually are.
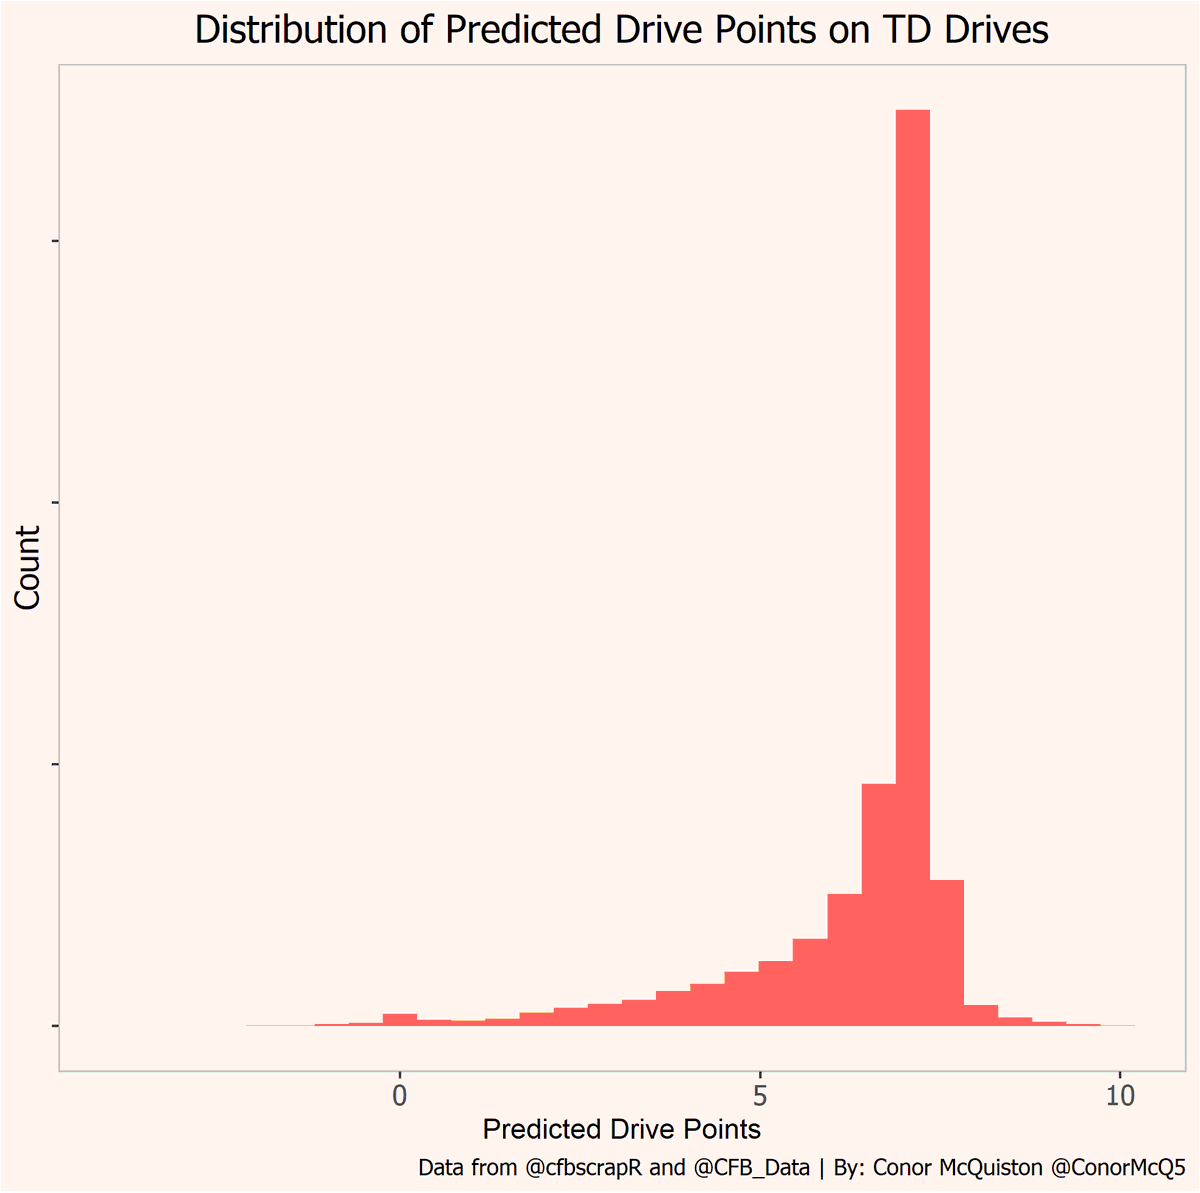
It has the added bonus that it can tell us how good Touchdown drives were. Considering the left-tailed nature of the histogram, it also lets us know that not all TD drives are created equal. It is unlikely, but sometimes bad drives still end up as TDs
So what can it tell us in a given game?
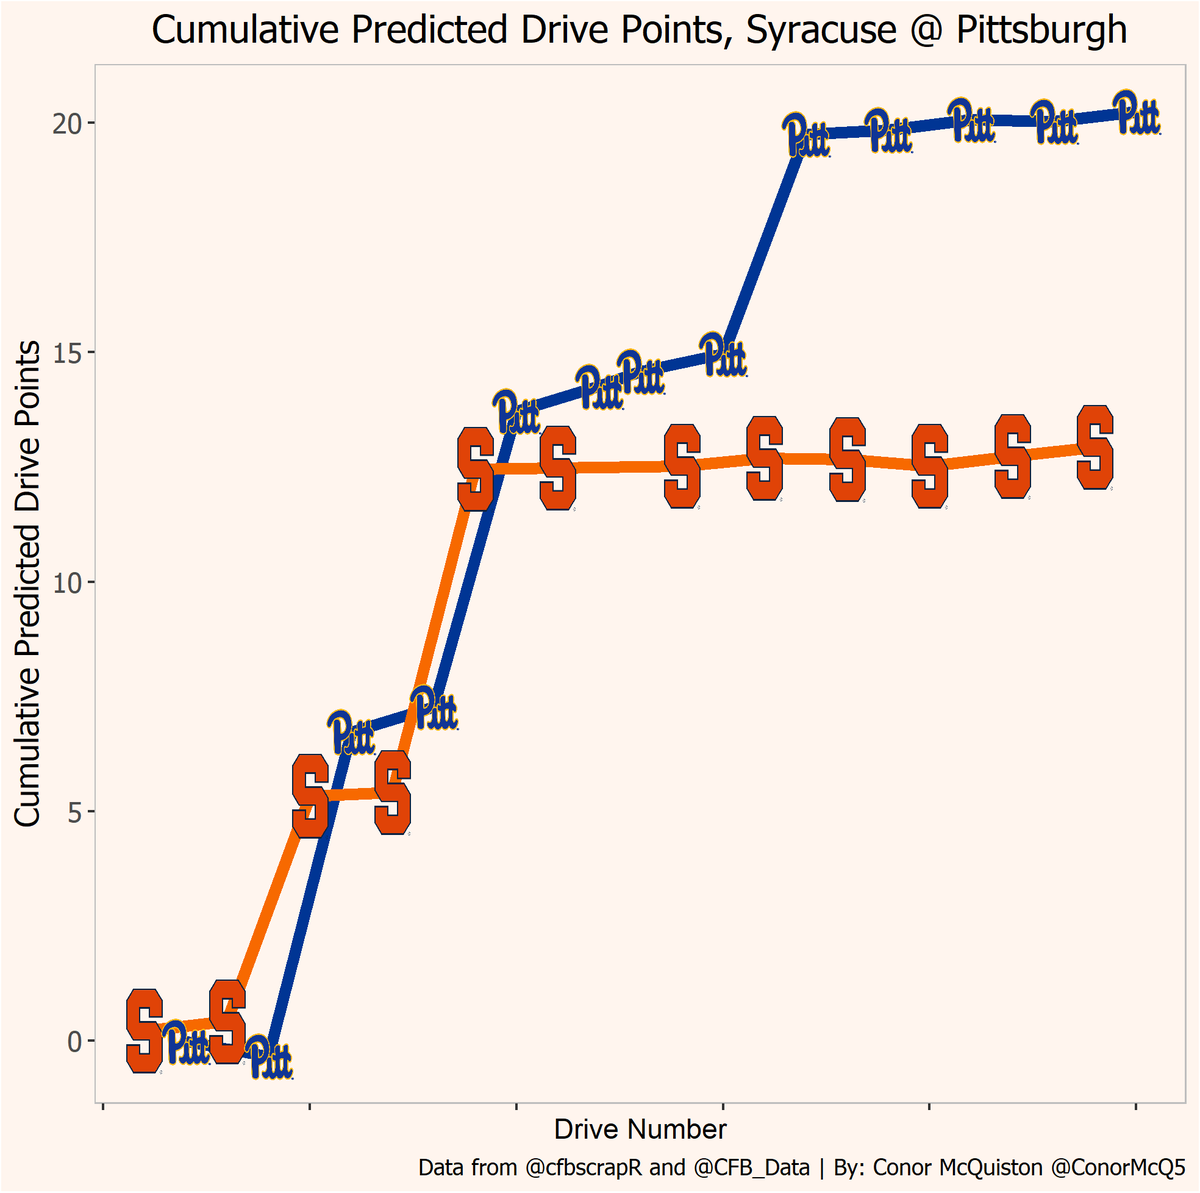
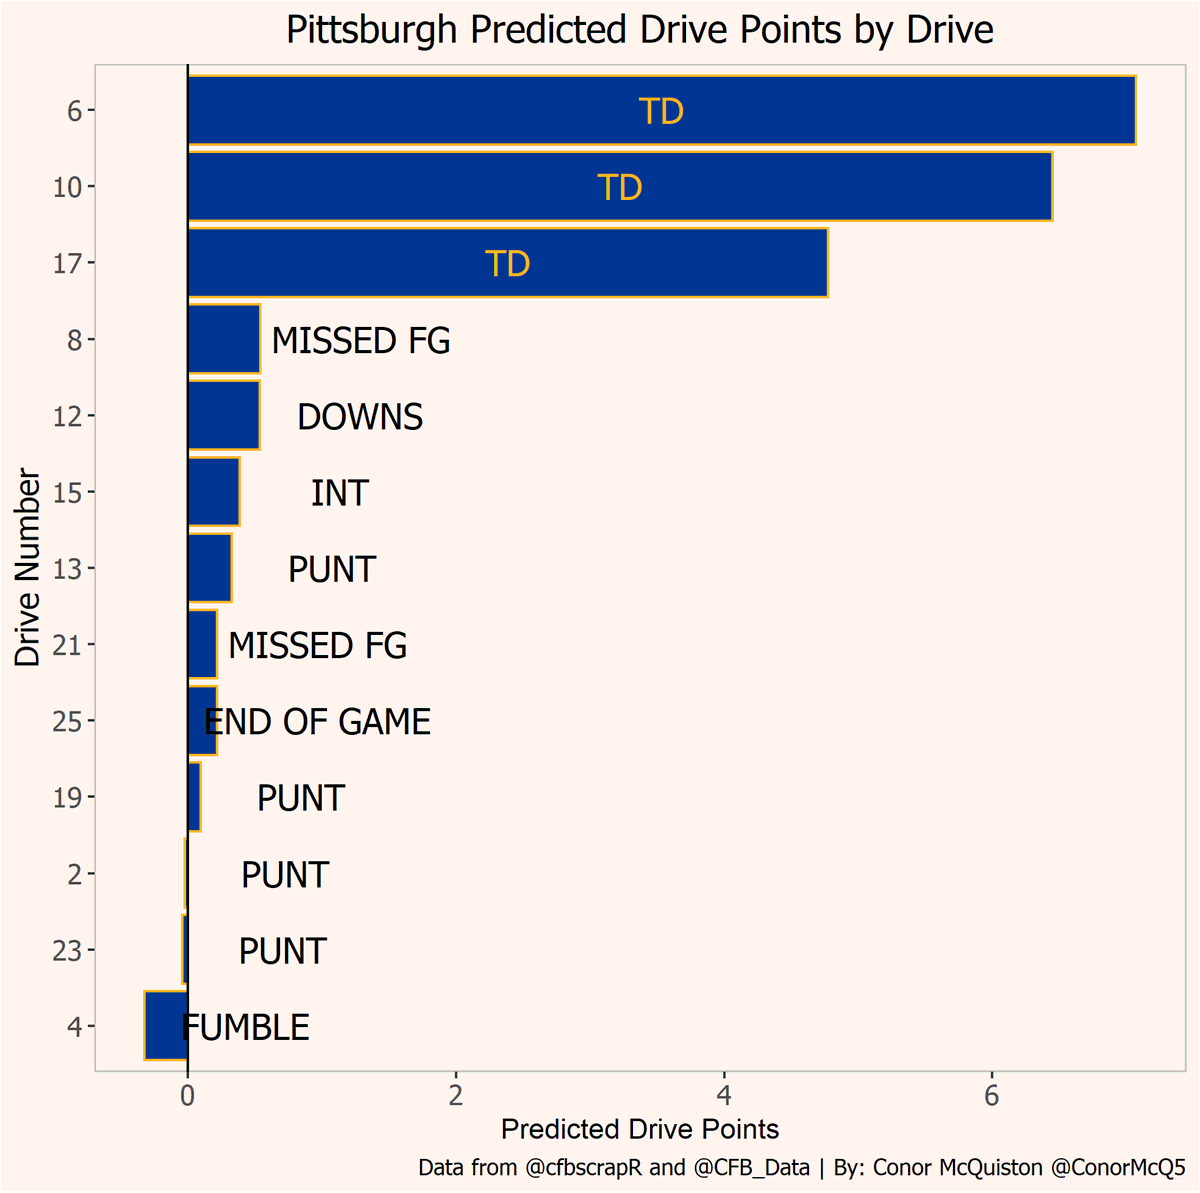
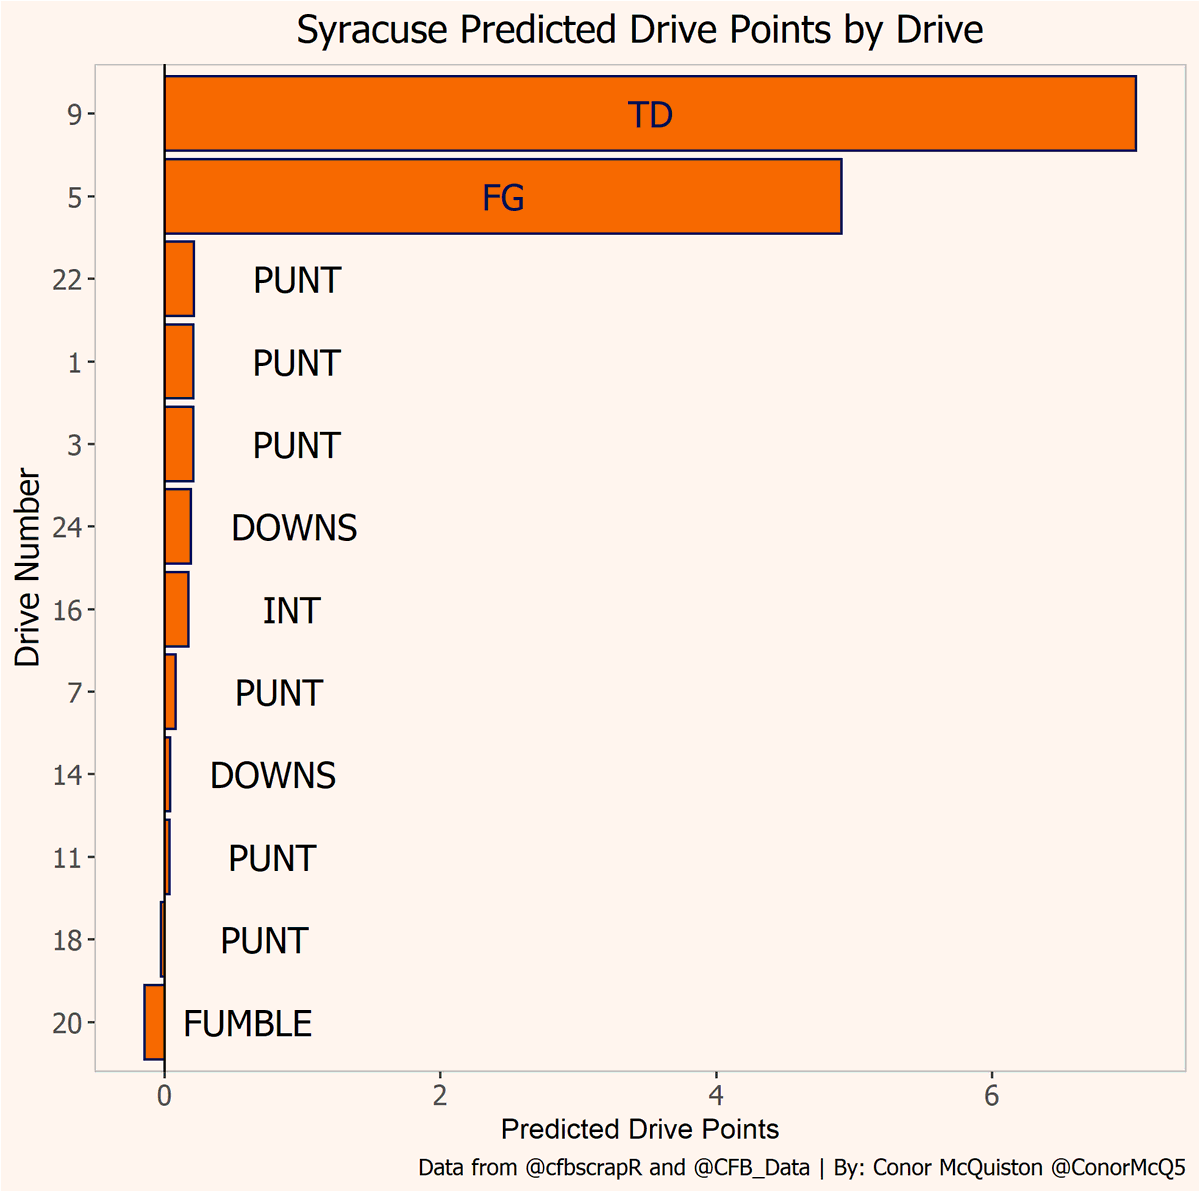
Overall it lets us look at what were the most successful drives were, so we can identify the spikes in play for a team. Additionally It lets us identify drives where teams should have done better or worse (Cuse Drive 5, Pitt Drive 17)
Overall it lets us look at what were the most successful drives were, so we can identify the spikes in play for a team. Additionally It lets us identify drives where teams should have done better or worse (Cuse Drive 5, Pitt Drive 17)
This lines up with what we know about the game too! Syracuse had a couple good early drives, and then were absolutely shut down by the Pitt D, while Pitt was generally more consistent.
Wait, if it lines up with what happens on a drive level during a game, does it predict game-level scoring?
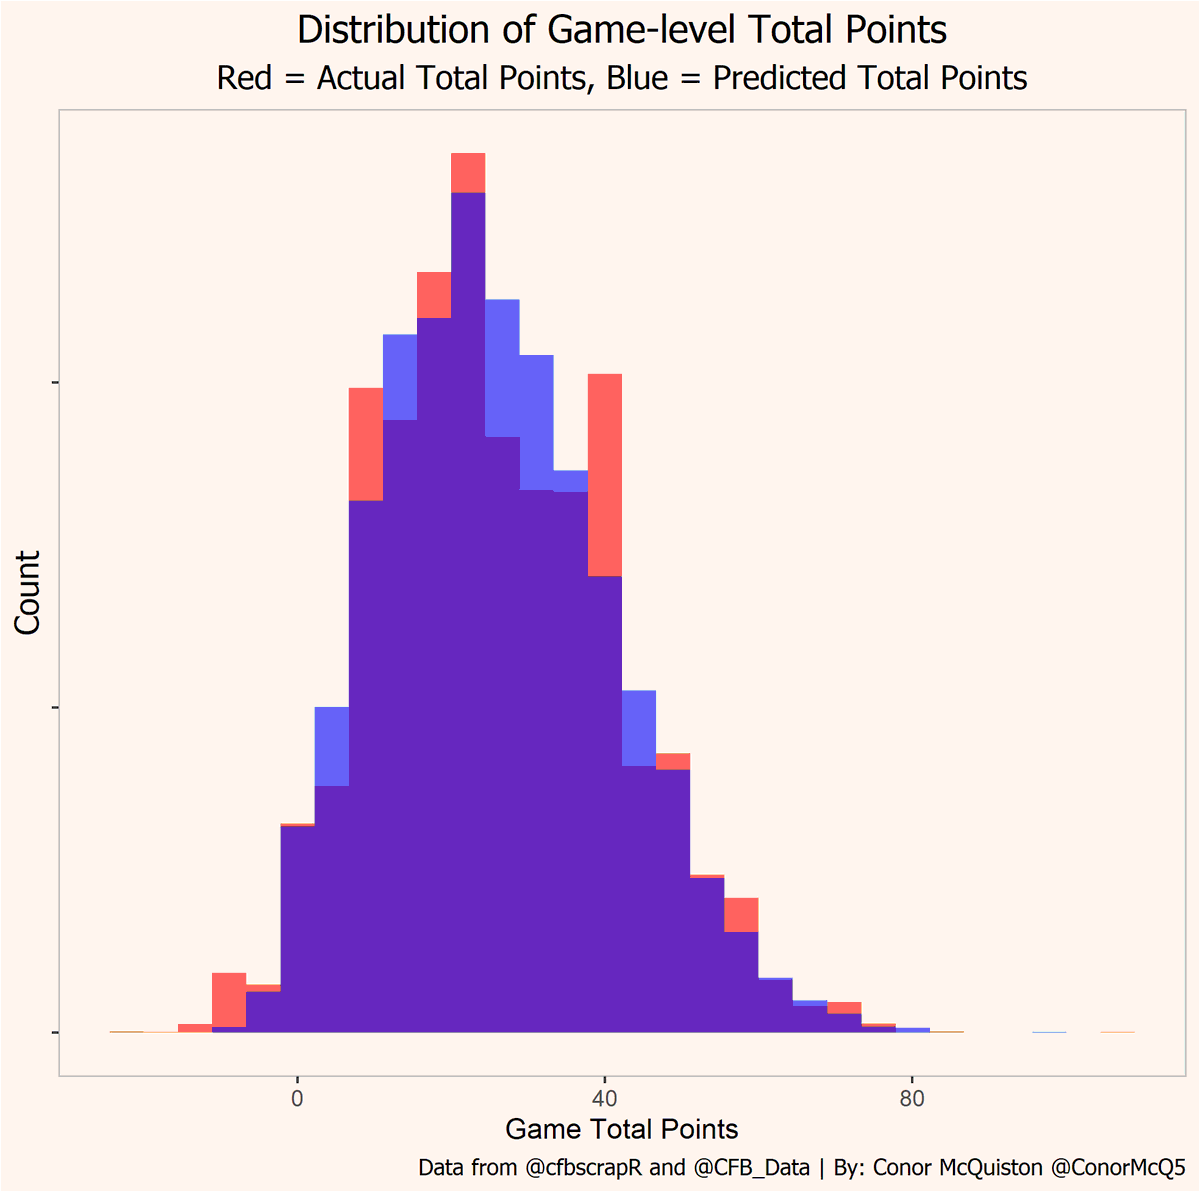
A quick note on this, we won& #39;t be looking at points scored, but total points. So if a team scores 7 TDs and throws a Pick 6, they scored 49 points but had 42 total points
A quick note on this, we won& #39;t be looking at points scored, but total points. So if a team scores 7 TDs and throws a Pick 6, they scored 49 points but had 42 total points
Caveats aside, does it line up with Game-Level scoring?
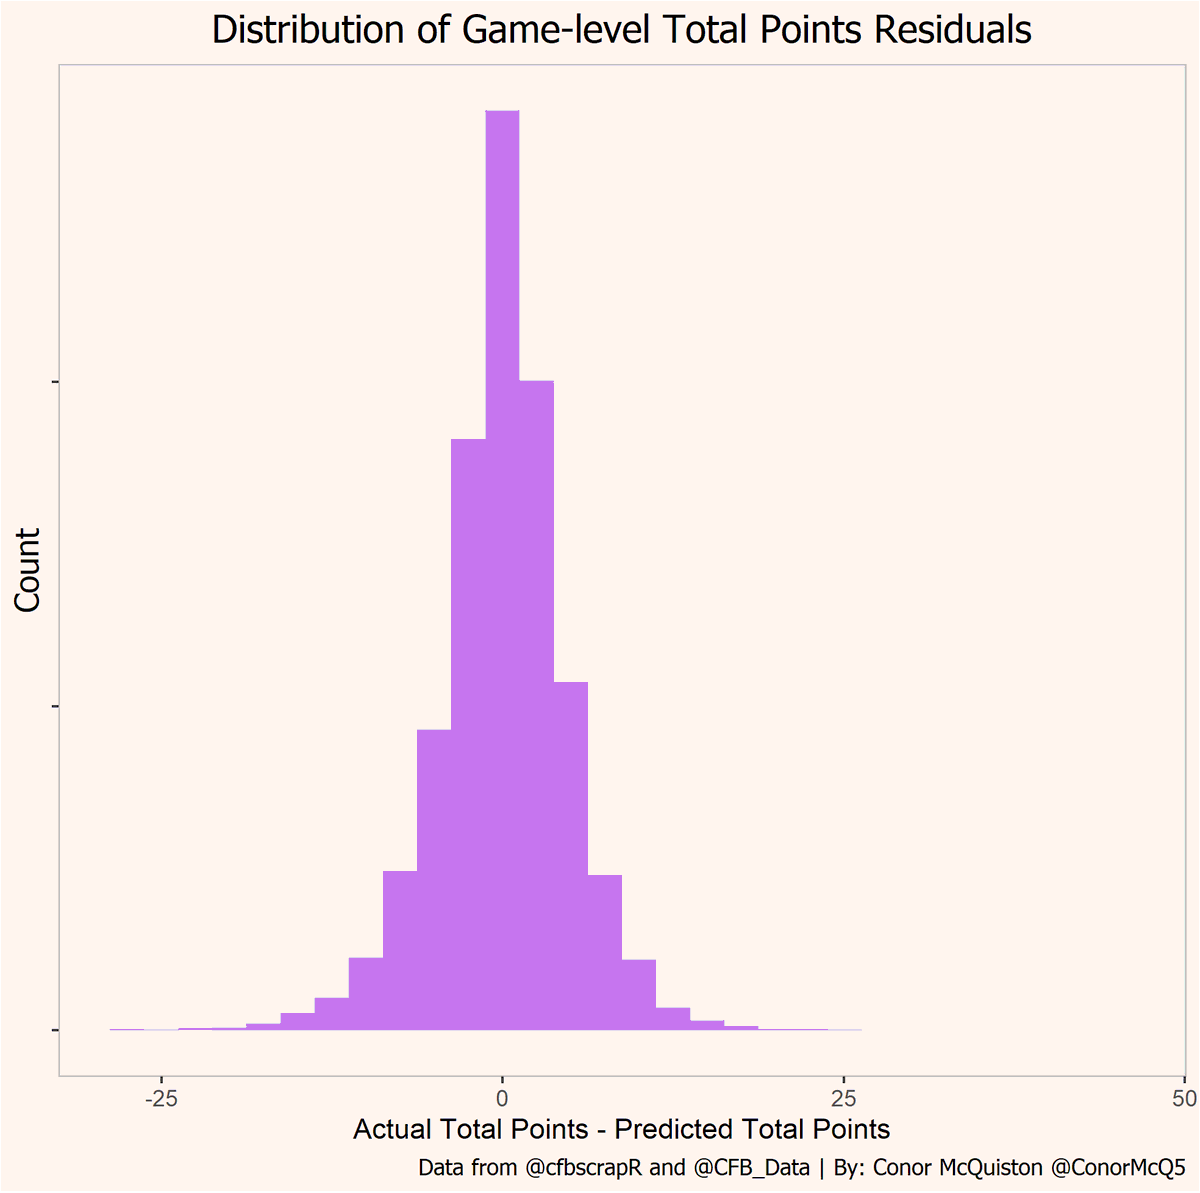
Yes. It definitely does. It does not line up perfectly, however the distributions look nearly identical, and the residuals are clustered near 0. This is a great sign
Yes. It definitely does. It does not line up perfectly, however the distributions look nearly identical, and the residuals are clustered near 0. This is a great sign
If it generally lines up with Game-level scoring, does it line up with Season-Level scoring?
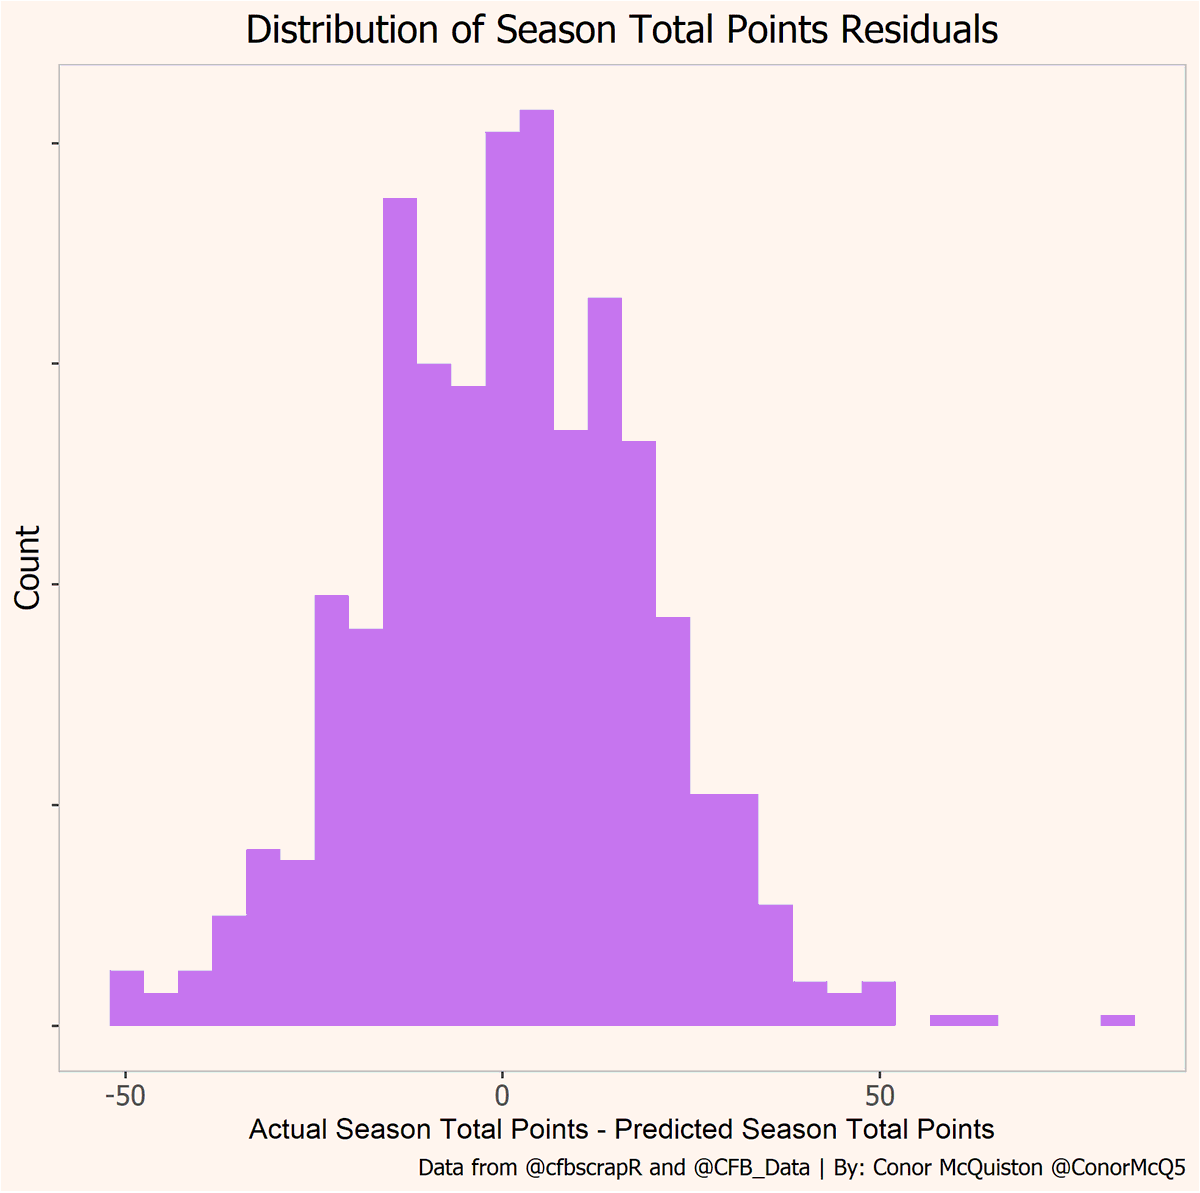
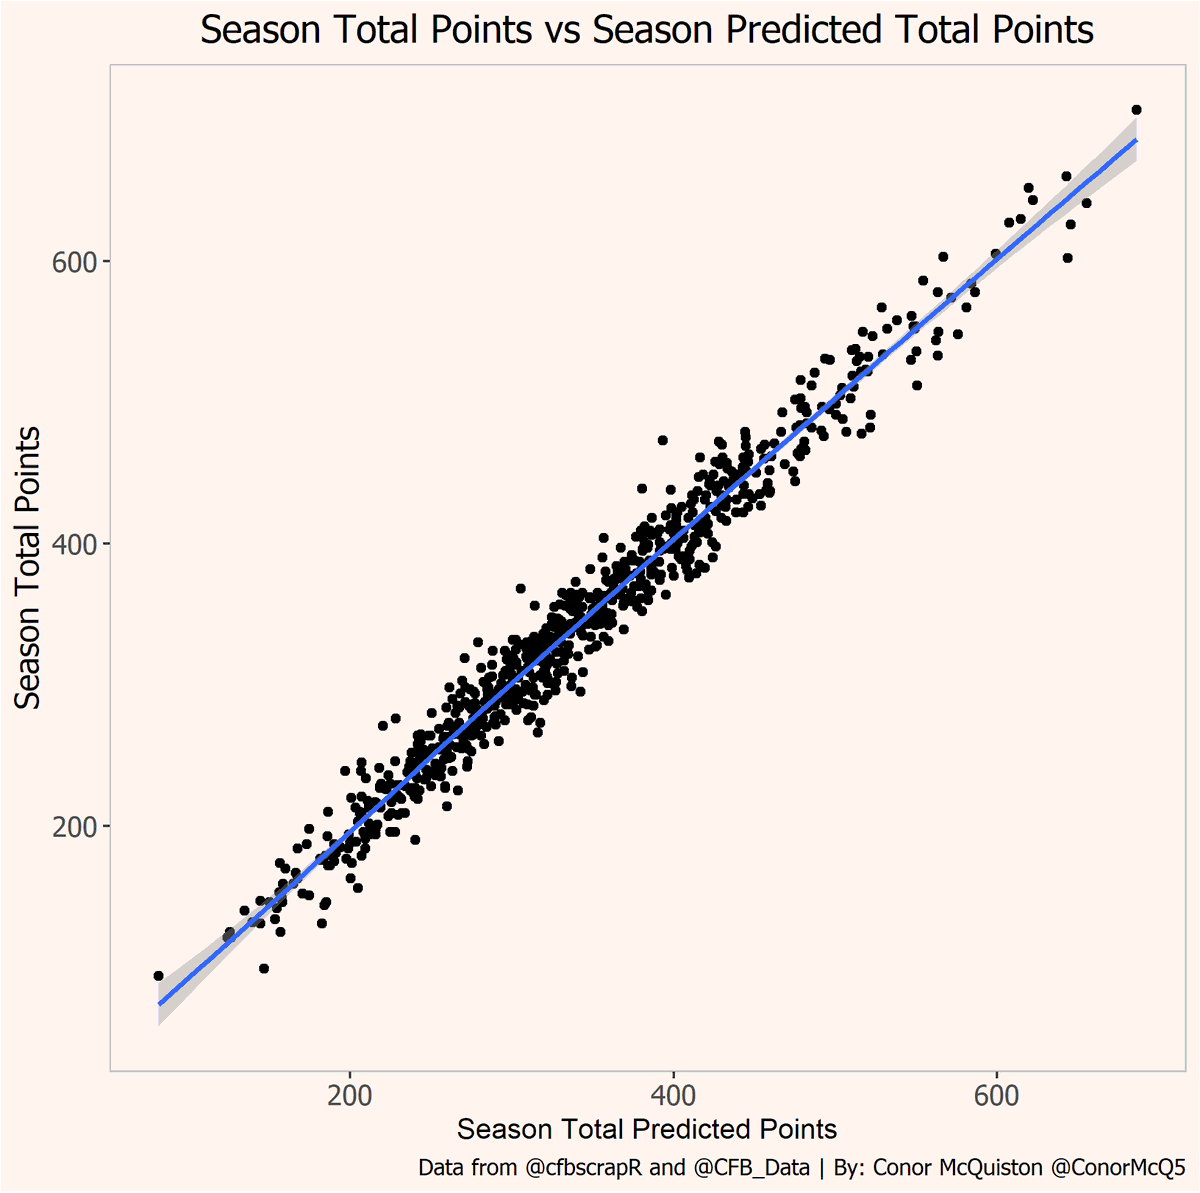
The distribution again lines up, but the residuals are generally higher, being +/- 50 points on the high ends. But they are extremely well correlated, with an r^2 ~.99
The distribution again lines up, but the residuals are generally higher, being +/- 50 points on the high ends. But they are extremely well correlated, with an r^2 ~.99
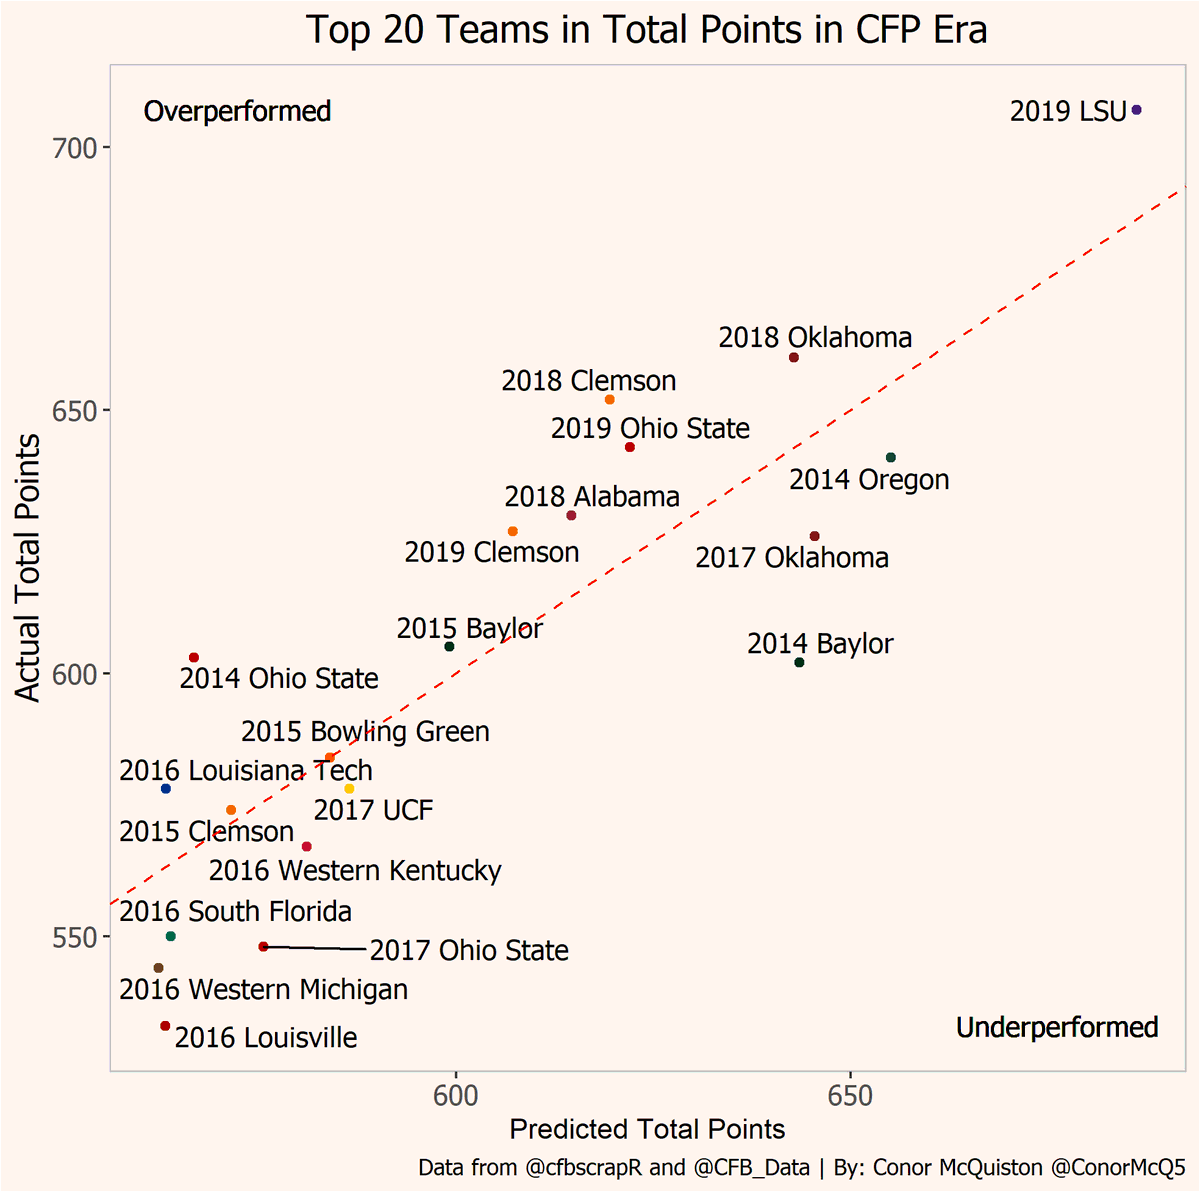
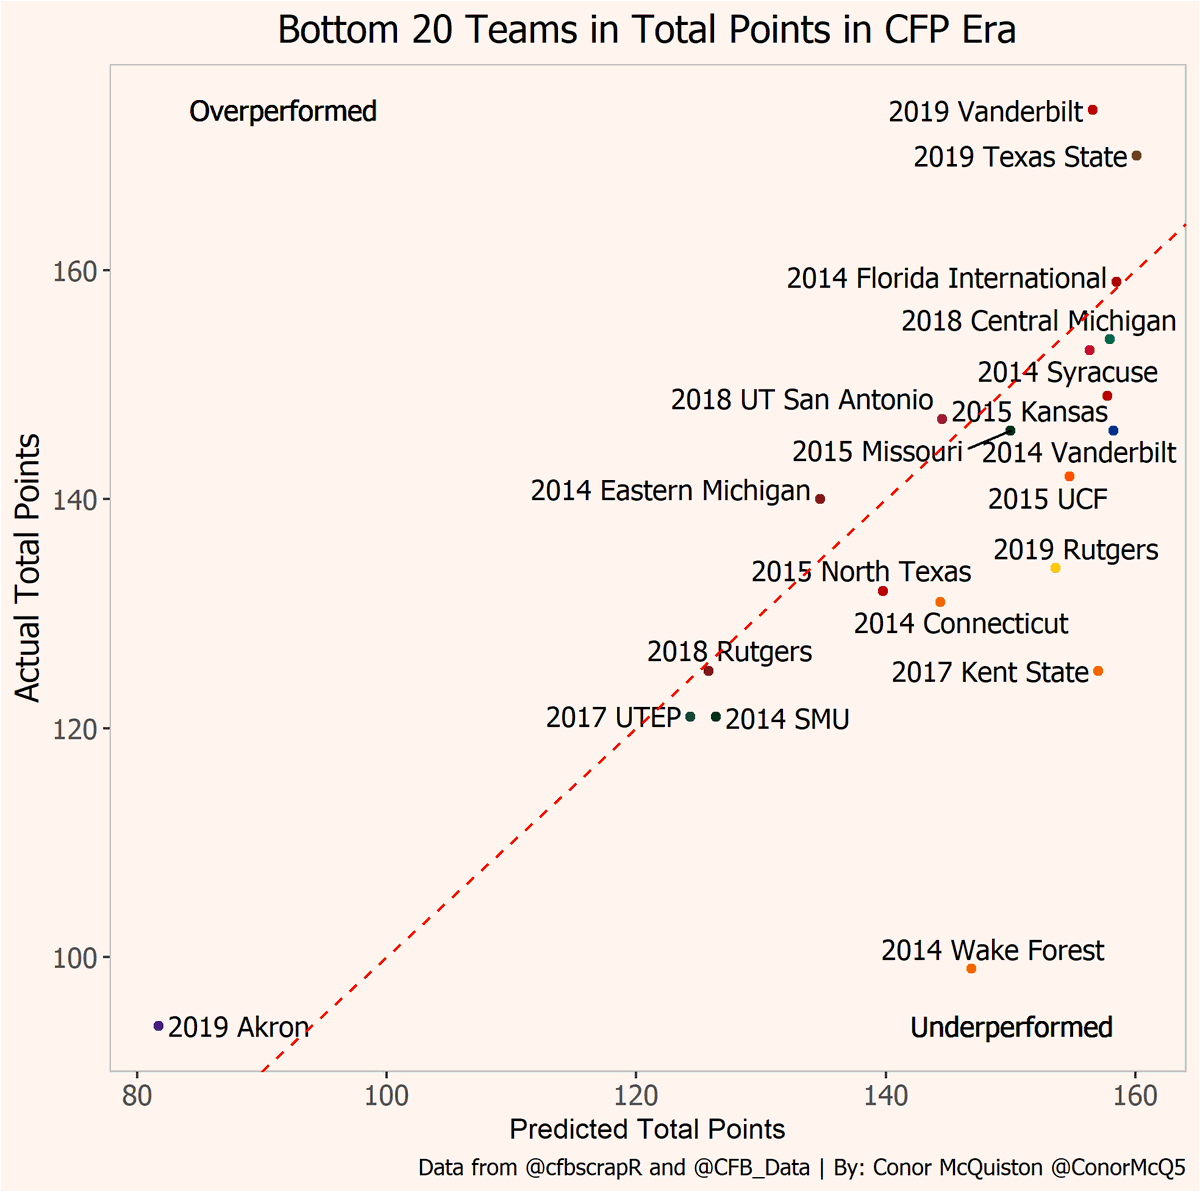
It looks up it lines up pretty well, but we should do a sniff test. Who are the best and worst teams in terms of Predicted Drive Points?
This passes the sanity check. Most of the top teams are CFP-level offenses, and most of the bottom teams were teams that won very few games.
This passes the sanity check. Most of the top teams are CFP-level offenses, and most of the bottom teams were teams that won very few games.
It also passes the CFB "duh" test by saying that 2019 LSU was the best team of the CFP era, while 2019 Akron was the worst team of the CFP era.
Thanks for reading! I& #39;m excited to see how this plays out in the season, and hopefully you think it& #39;s cool! I& #39;ll throw the code up on my github early next week.
Data from @CFB_Data & @cfbscrapR and thank you to @nickwan @statsowar and @PFF_Eric for helping me along the way!
Data from @CFB_Data & @cfbscrapR and thank you to @nickwan @statsowar and @PFF_Eric for helping me along the way!

 Read on Twitter