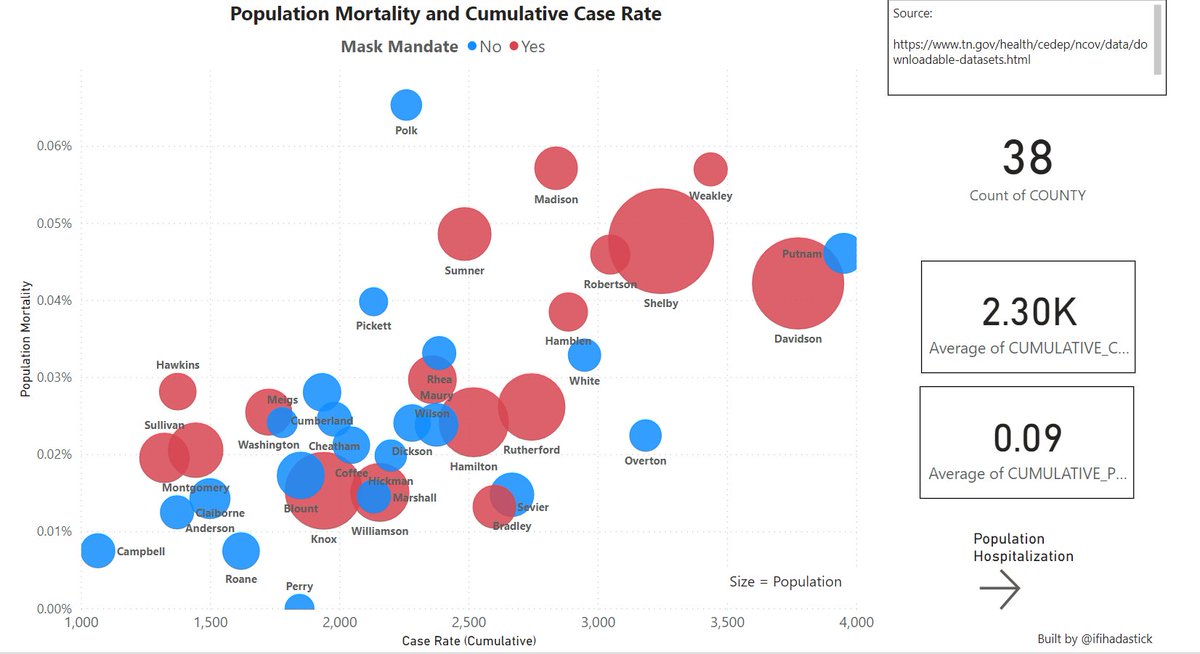
Analysis: Are Mask *Mandates* associated with better population mortality or hospitalization outcomes?
Data from TN Dept of Health- sample size of 38 Counties, 17 with Mask Mandates, 21 without.
Metrics are population adjusted
Interactive link
https://app.powerbi.com/view?r=eyJrIjoiMzgwZDE4NzItMDdmYS00ZmI5LThlZmYtZWY2ZjQ4MGExZGZkIiwidCI6IjQ4ZGIxMmFjLTVkYzMtNGQ1MS05N2VkLTVhM2RkZTYxOTlmYyJ9">https://app.powerbi.com/view...
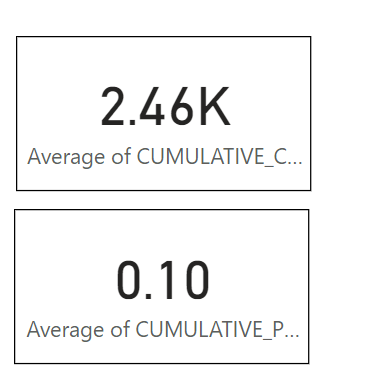
Average Cumulative Case Rate (cases/100k) for Mask Mandate Counties is 2460k/100k Residents.
Average % Positive (cumulative) for Mask Mandate Counties is 10%
Average % Positive (cumulative) for Mask Mandate Counties is 10%
To be clear- this data is about mask *mandates* - not mask usage, type of masks, frequency or place of use.
This data does not speak to the general efficacy of masks in specific settings or uses, but only the effect on population outcomes of Mask *Mandates*
This data does not speak to the general efficacy of masks in specific settings or uses, but only the effect on population outcomes of Mask *Mandates*

 Read on Twitter


