From the number of infections to changes in daily routine, statistics tell us a lot about the ongoing impact of the #COVID19 pandemic.
We’ve published 10 key charts on how the UK has been affected http://ow.ly/Fngl50BzNxe ">https://ow.ly/Fngl50BzN...
We’ve published 10 key charts on how the UK has been affected http://ow.ly/Fngl50BzNxe ">https://ow.ly/Fngl50BzN...
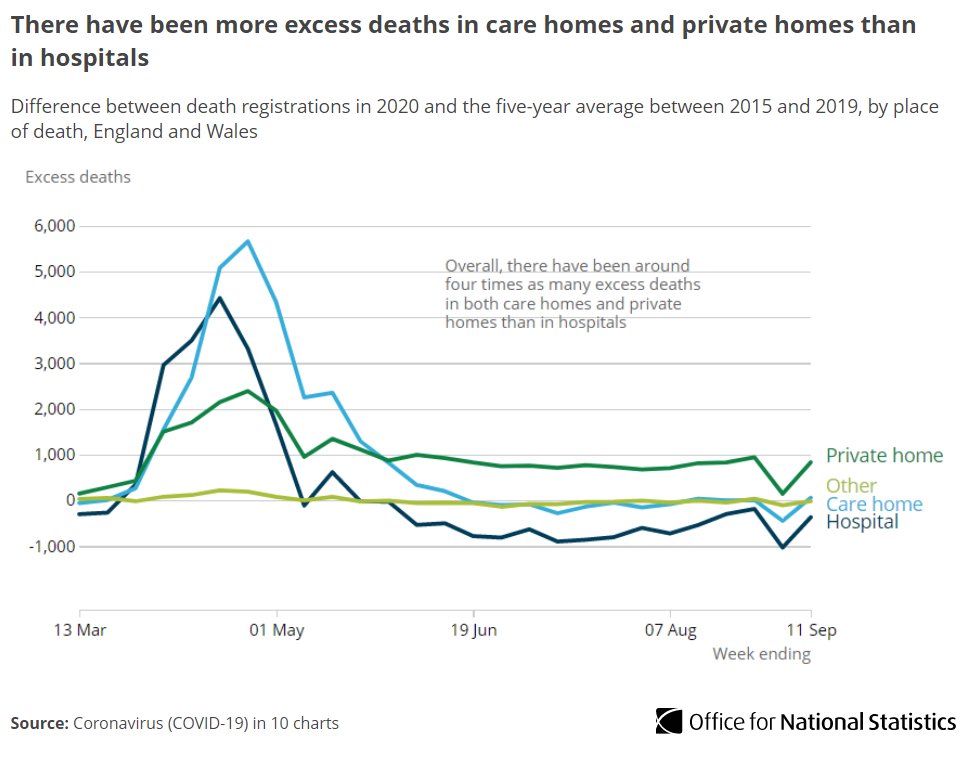
At the peak of the pandemic the number of weekly deaths in England and Wales was more than twice normal levels.
“Excess deaths” were a combination of those involving #COVID19 and those from other causes which were also above average http://ow.ly/yATW50BzNFs ">https://ow.ly/yATW50BzN...
“Excess deaths” were a combination of those involving #COVID19 and those from other causes which were also above average http://ow.ly/yATW50BzNFs ">https://ow.ly/yATW50BzN...
While deaths in hospitals peaked at 88% above average in week ending 17 April, deaths in care homes were more than 3.5x the average a week later.
Both have returned to normal levels (or lower), but deaths in private homes remain 30-40% higher than average http://ow.ly/j62I50BzNTE ">https://ow.ly/j62I50BzN...
Both have returned to normal levels (or lower), but deaths in private homes remain 30-40% higher than average http://ow.ly/j62I50BzNTE ">https://ow.ly/j62I50BzN...
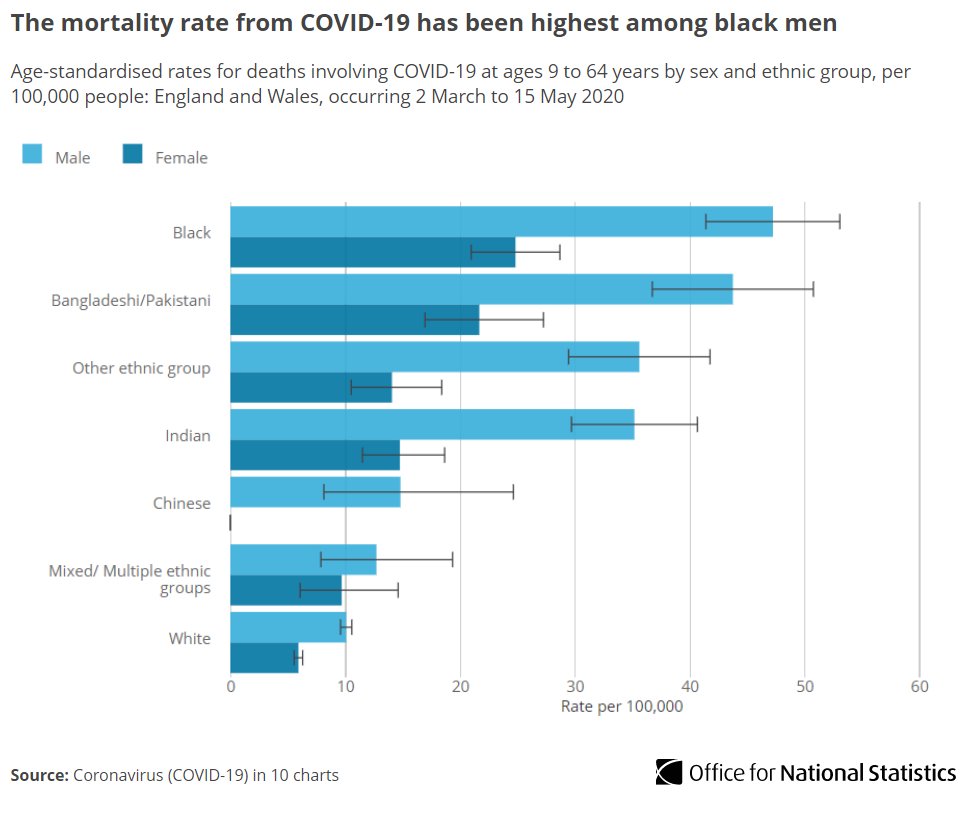
Analysis from the height of the pandemic showed that the death rate from #COVID19 was significantly higher among the following ethnic groups compared with those of White ethnicity;
 https://abs.twimg.com/emoji/v2/... draggable="false" alt="▪️" title="Schwarzes kleines Quadrat" aria-label="Emoji: Schwarzes kleines Quadrat"> Black
 https://abs.twimg.com/emoji/v2/... draggable="false" alt="▪️" title="Schwarzes kleines Quadrat" aria-label="Emoji: Schwarzes kleines Quadrat"> Bangladeshi and Pakistani
 https://abs.twimg.com/emoji/v2/... draggable="false" alt="▪️" title="Schwarzes kleines Quadrat" aria-label="Emoji: Schwarzes kleines Quadrat"> Indian
 https://abs.twimg.com/emoji/v2/... draggable="false" alt="▪️" title="Schwarzes kleines Quadrat" aria-label="Emoji: Schwarzes kleines Quadrat"> Other
 https://abs.twimg.com/emoji/v2/... draggable="false" alt="➡️" title="Pfeil nach rechts" aria-label="Emoji: Pfeil nach rechts"> http://ow.ly/mqkj50BzOk4 ">https://ow.ly/mqkj50BzO...
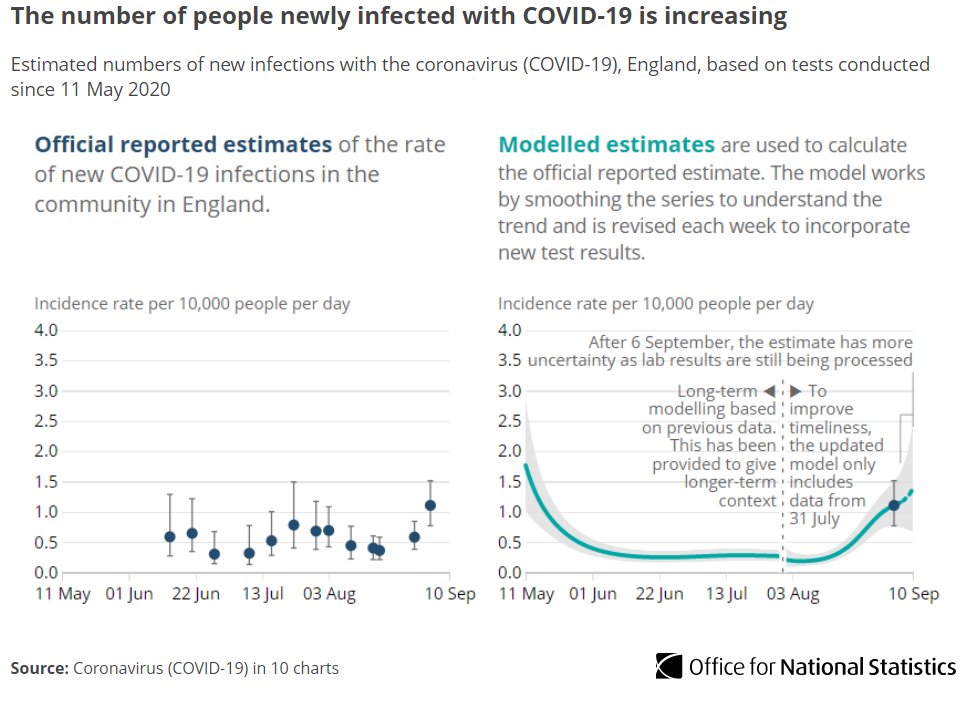
There has been a rise in new infections in England in recent weeks, following a low point in June that had levelled off in August.
These figures do not include people staying in hospitals, care homes or other institutional settings http://ow.ly/wDU150BzOEm ">https://ow.ly/wDU150BzO...
These figures do not include people staying in hospitals, care homes or other institutional settings http://ow.ly/wDU150BzOEm ">https://ow.ly/wDU150BzO...
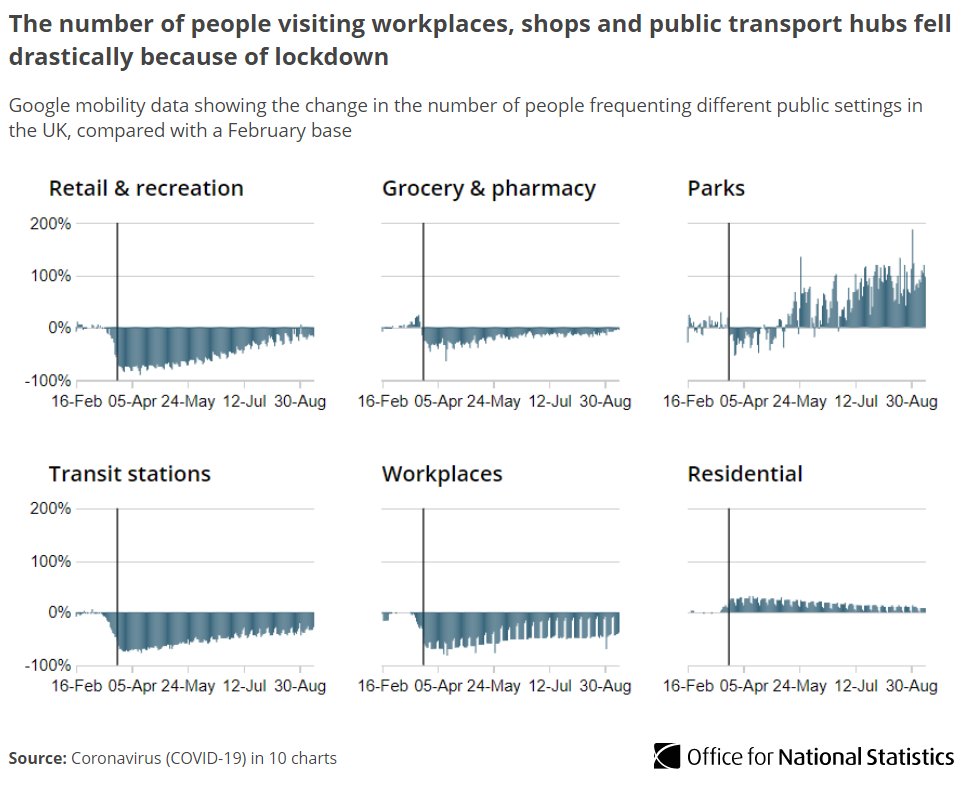
The #COVID19 lockdown has changed people’s lifestyles and habits.
Mobility levels at workplaces and on high streets remain lower than before, according to Google data, while people are continuing to spend more time around their homes and in public parks http://ow.ly/ik0P50BzP2Q ">https://ow.ly/ik0P50BzP...
Mobility levels at workplaces and on high streets remain lower than before, according to Google data, while people are continuing to spend more time around their homes and in public parks http://ow.ly/ik0P50BzP2Q ">https://ow.ly/ik0P50BzP...
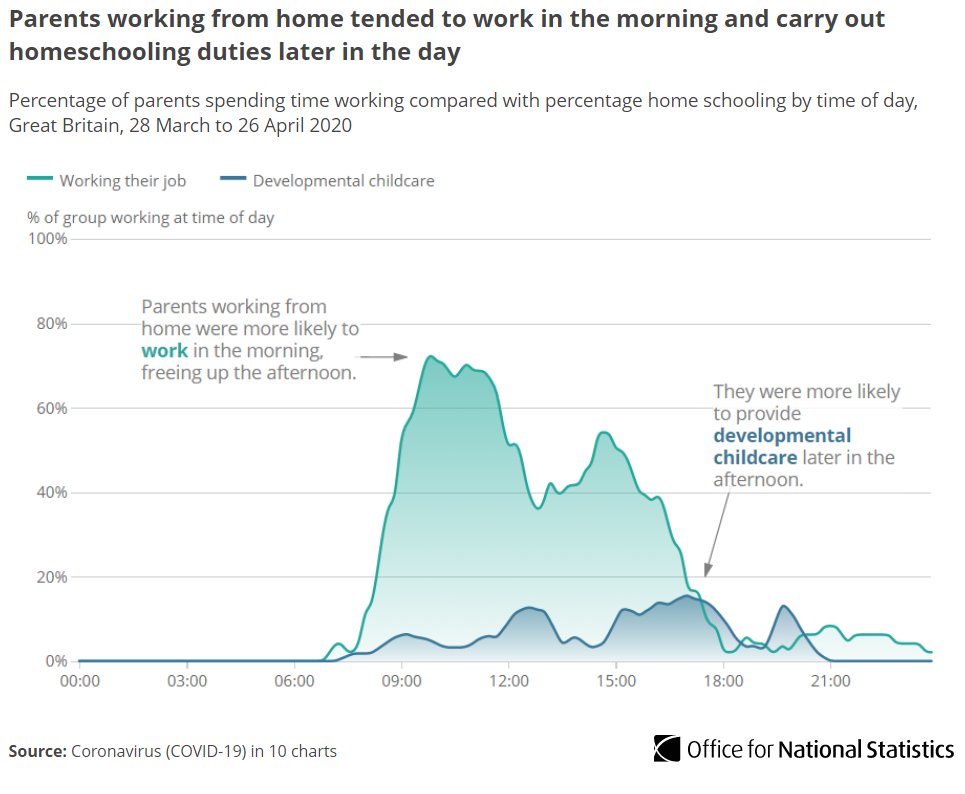
While schools were closed, parents had to juggle work with childcare responsibilities (including homeschooling).
Those working from home tended to use the mornings to complete work, with homeschooling mostly taking place in the late afternoon and evening http://ow.ly/p6G350BzPr1 ">https://ow.ly/p6G350BzP...
Those working from home tended to use the mornings to complete work, with homeschooling mostly taking place in the late afternoon and evening http://ow.ly/p6G350BzPr1 ">https://ow.ly/p6G350BzP...
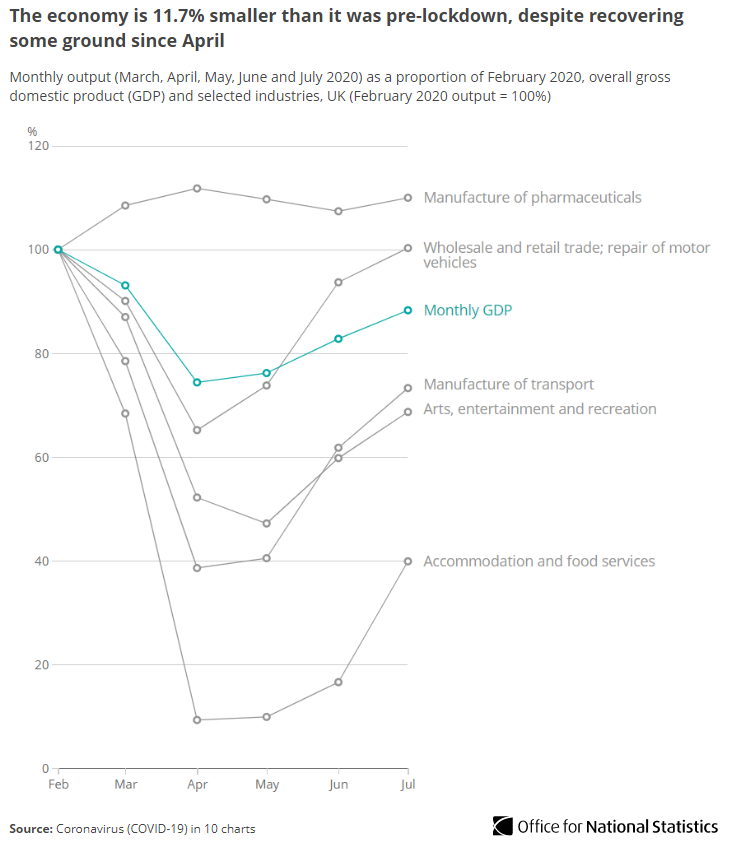
The #COVID19 lockdown had an inevitable impact on the economy, which shrunk by around a quarter between February and April (it has since recovered some ground between May and July).
The hospitality sector was among the worst hit http://ow.ly/J7cU50BzPFh ">https://ow.ly/J7cU50BzP...
The hospitality sector was among the worst hit http://ow.ly/J7cU50BzPFh ">https://ow.ly/J7cU50BzP...
32% of eligible jobs (9.6 million) were furloughed for at least part of the period between March and June.
With young people more likely to work in affected sectors such as hospitality, the proportion furloughed was higher (47%) among 16- to 24-year-olds http://ow.ly/NSU850BzQ1j ">https://ow.ly/NSU850BzQ...
With young people more likely to work in affected sectors such as hospitality, the proportion furloughed was higher (47%) among 16- to 24-year-olds http://ow.ly/NSU850BzQ1j ">https://ow.ly/NSU850BzQ...
Firms have scaled back hiring significantly.
There were 1.4 vacancies per 100 employee jobs in the three months to August, down from 2.7 at the same time last year and lower than at any time during the financial crisis of 2008 and 2009 http://ow.ly/JUTs50BzQ78 ">https://ow.ly/JUTs50BzQ...
There were 1.4 vacancies per 100 employee jobs in the three months to August, down from 2.7 at the same time last year and lower than at any time during the financial crisis of 2008 and 2009 http://ow.ly/JUTs50BzQ78 ">https://ow.ly/JUTs50BzQ...
A combination of increased government spending, reduced cash receipts and a fall in GDP has pushed public sector net debt at the end of July to 100.5% of GDP.
Before July, debt had not exceeded GDP since the financial year ending March 1961 http://ow.ly/S0HC50BzQd5 ">https://ow.ly/S0HC50BzQ...
Before July, debt had not exceeded GDP since the financial year ending March 1961 http://ow.ly/S0HC50BzQd5 ">https://ow.ly/S0HC50BzQ...

 Read on Twitter

 Blackhttps://abs.twimg.com/emoji/v2/... draggable="false" alt="▪️" title="Schwarzes kleines Quadrat" aria-label="Emoji: Schwarzes kleines Quadrat"> Bangladeshi and Pakistani https://abs.twimg.com/emoji/v2/... draggable="false" alt="▪️" title="Schwarzes kleines Quadrat" aria-label="Emoji: Schwarzes kleines Quadrat"> Indianhttps://abs.twimg.com/emoji/v2/... draggable="false" alt="▪️" title="Schwarzes kleines Quadrat" aria-label="Emoji: Schwarzes kleines Quadrat"> Other https://abs.twimg.com/emoji/v2/... draggable="false" alt="➡️" title="Pfeil nach rechts" aria-label="Emoji: Pfeil nach rechts"> https://ow.ly/mqkj50BzO..." title="Analysis from the height of the pandemic showed that the death rate from #COVID19 was significantly higher among the following ethnic groups compared with those of White ethnicity;https://abs.twimg.com/emoji/v2/... draggable="false" alt="▪️" title="Schwarzes kleines Quadrat" aria-label="Emoji: Schwarzes kleines Quadrat"> Blackhttps://abs.twimg.com/emoji/v2/... draggable="false" alt="▪️" title="Schwarzes kleines Quadrat" aria-label="Emoji: Schwarzes kleines Quadrat"> Bangladeshi and Pakistani https://abs.twimg.com/emoji/v2/... draggable="false" alt="▪️" title="Schwarzes kleines Quadrat" aria-label="Emoji: Schwarzes kleines Quadrat"> Indianhttps://abs.twimg.com/emoji/v2/... draggable="false" alt="▪️" title="Schwarzes kleines Quadrat" aria-label="Emoji: Schwarzes kleines Quadrat"> Other https://abs.twimg.com/emoji/v2/... draggable="false" alt="➡️" title="Pfeil nach rechts" aria-label="Emoji: Pfeil nach rechts"> https://ow.ly/mqkj50BzO..." class="img-responsive" style="max-width:100%;"/>
