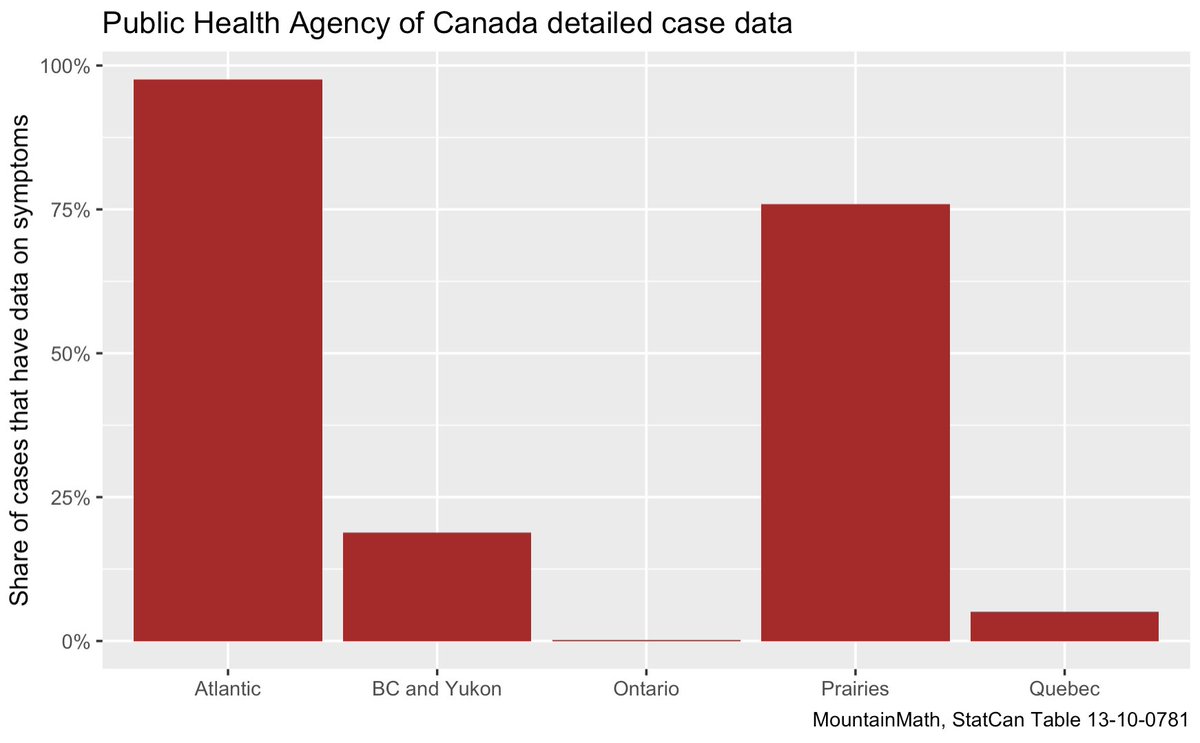
Took a quick peek at the new-ish national dataset on covid case data. In theory it has lots of interesting data, was interested in symptoms. But data fields don& #39;t seem to be standardized across provinces, and BC, Ontario and Quebec have few cases with any data on symptoms.
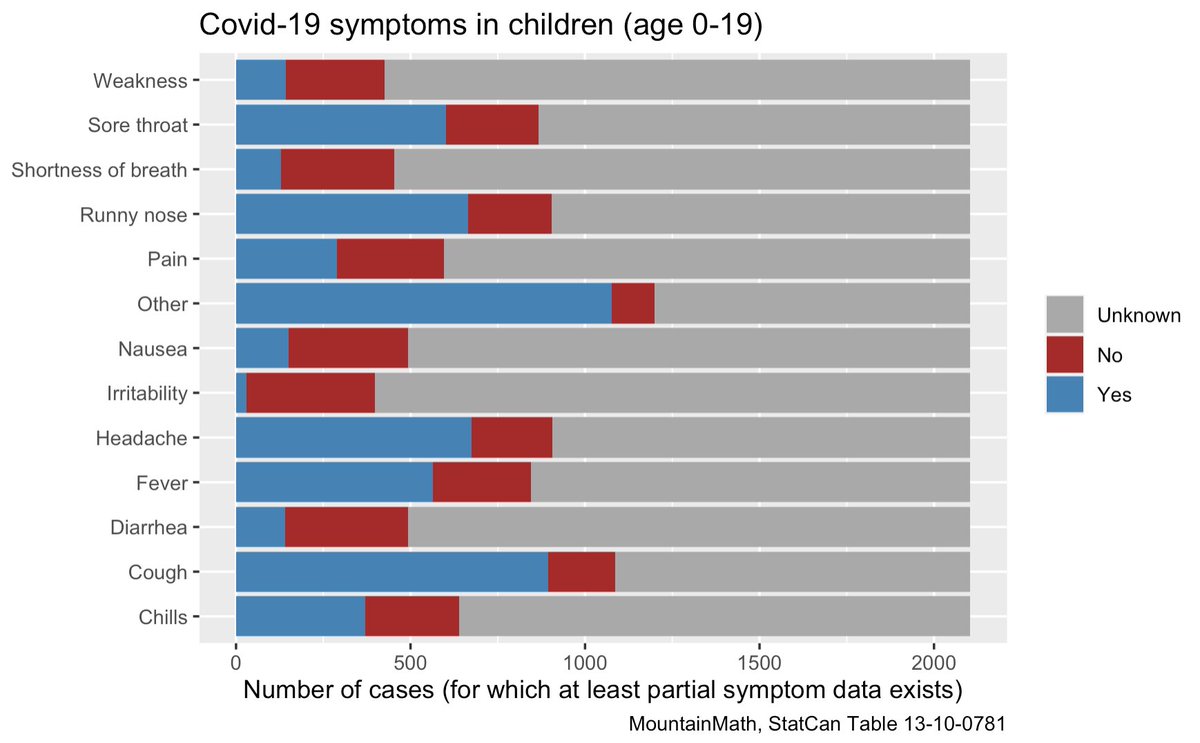
In theory this kind of dataset gives a lot of good insight into covid in Canada. In practice it needs an A-grade NA-jockey to get anything useful out of this. Out of the 9,282 children in the dataset, only 2,104 have any kind of data on symptoms.
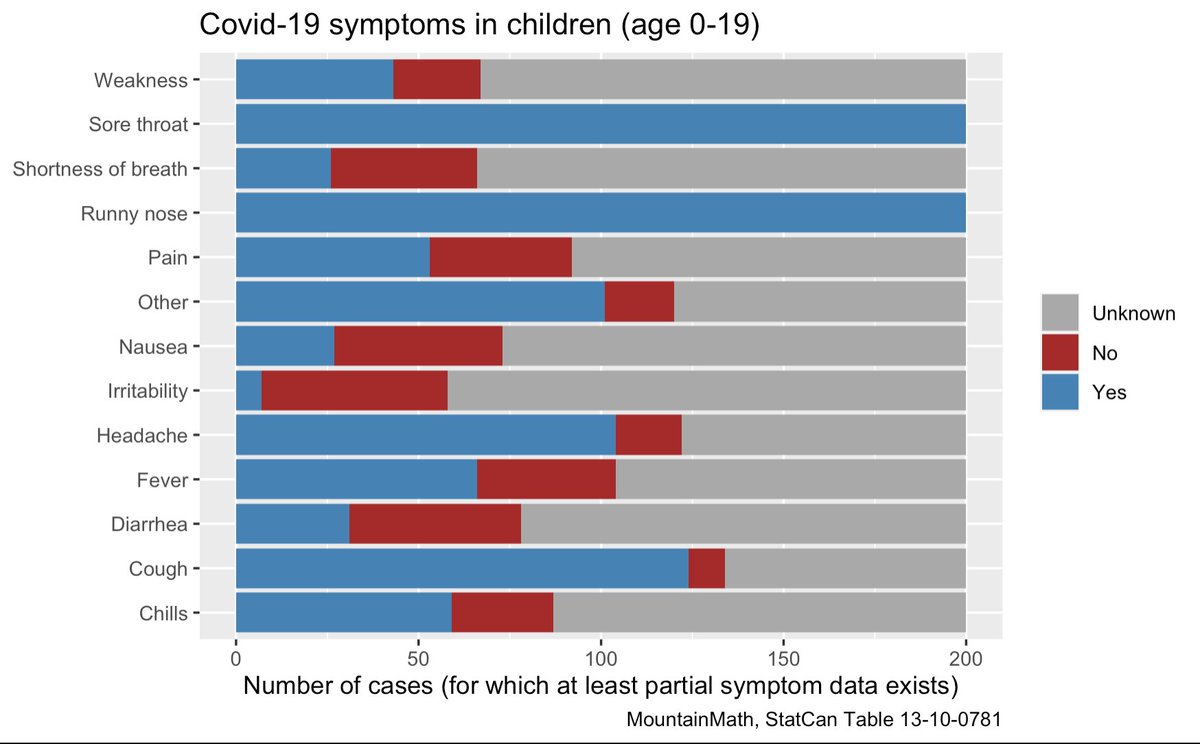
How can such data be used? For example, BC just changed their criteria for symptom screening for school attendance and dropped Runny nose and Sore thought. Have there been kids where these were the only reported symptoms? No. Although the dataset gets quite thin at this point.
Actually, that& #39;s not quite what the above graph says. It& #39;s just listing the frequency of symptoms among those that had a runny nose or sore throat. What we really want to know is if there are symptomatic kids that we are missing if we take runny nose and sore throat off the list.
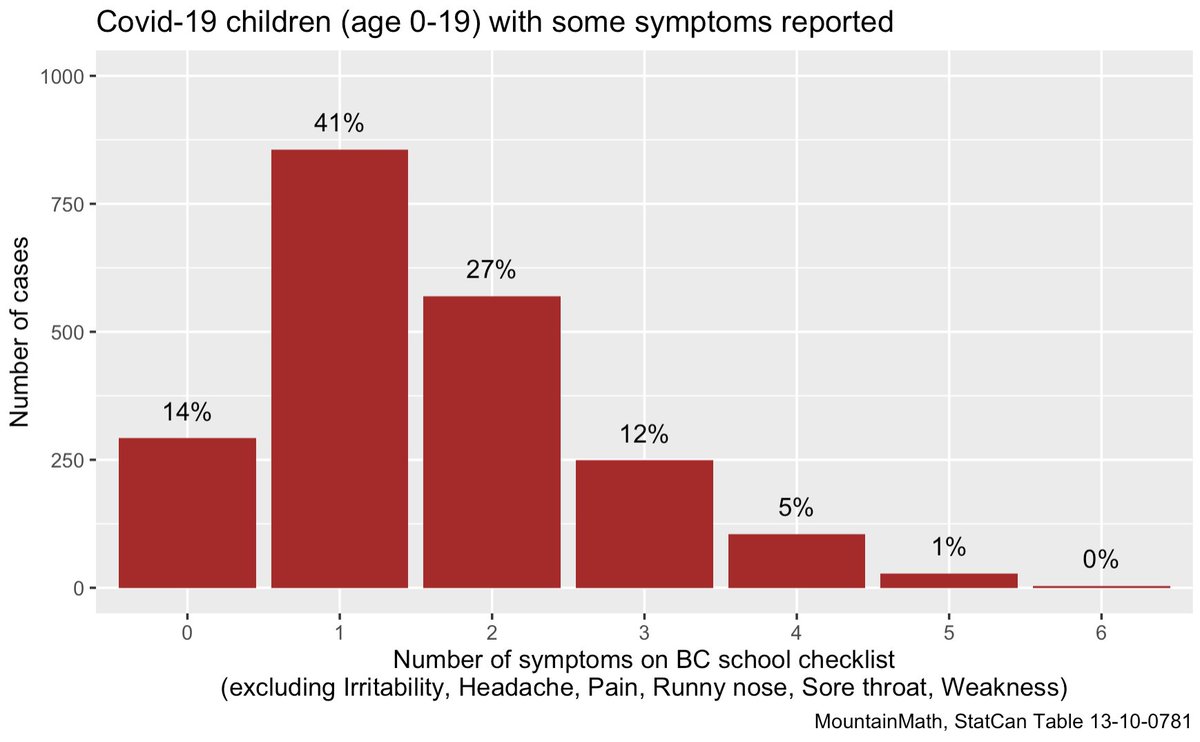
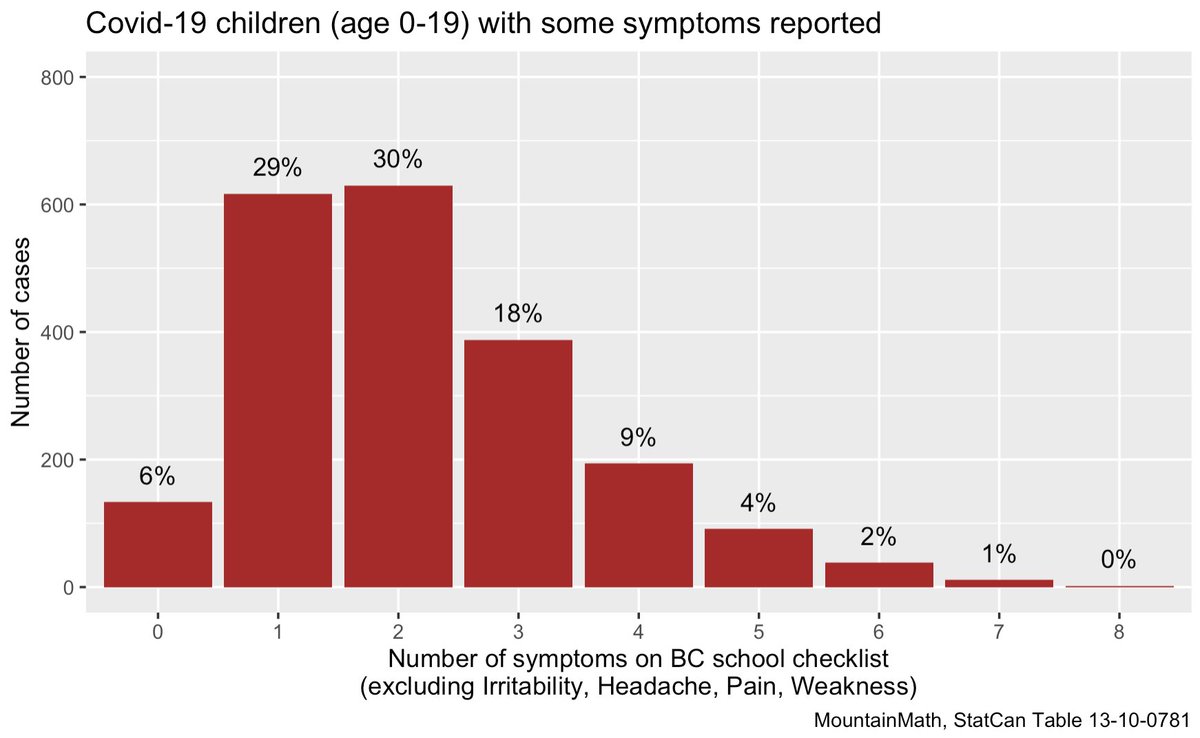
Here is the distribution of how many symptoms from the BC school checklist children for which we have some data on symptoms had. (This is still excluding asymptomatic children). So 14% of children with symptoms had none on the BC list.
If we kept runny nose and sore throat on the list we would catch a little over half of the symptomatic kids we otherwise missed, cutting it down from 14% to 6% missed.
The other 6% of kids had irritability, headache, pain and weakness as the only symptoms. We captured the "lack of taste/smell" as part of "other", which is not optimal.
*** Big caveat on thread: Data is messy and incomplete, this thread may be complete junk!
*** Big caveat on thread: Data is messy and incomplete, this thread may be complete junk!

 Read on Twitter