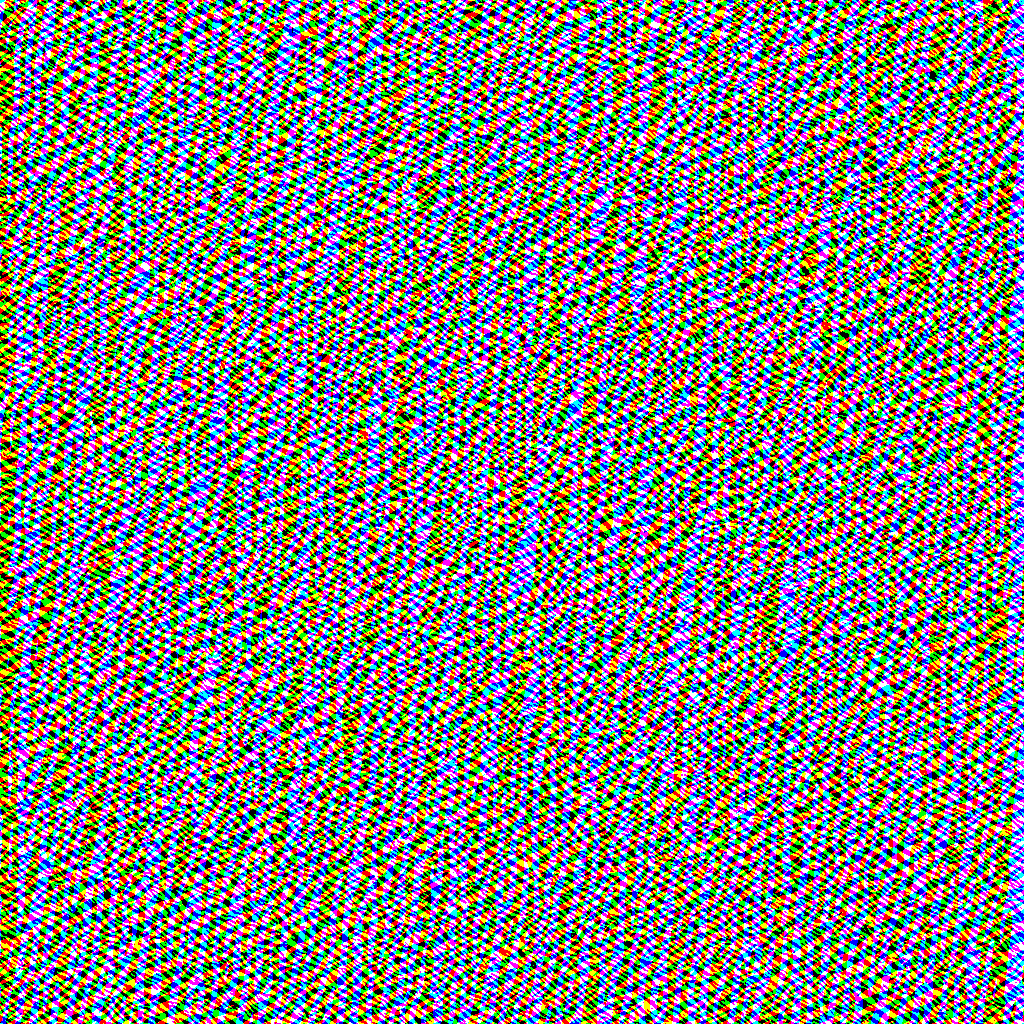
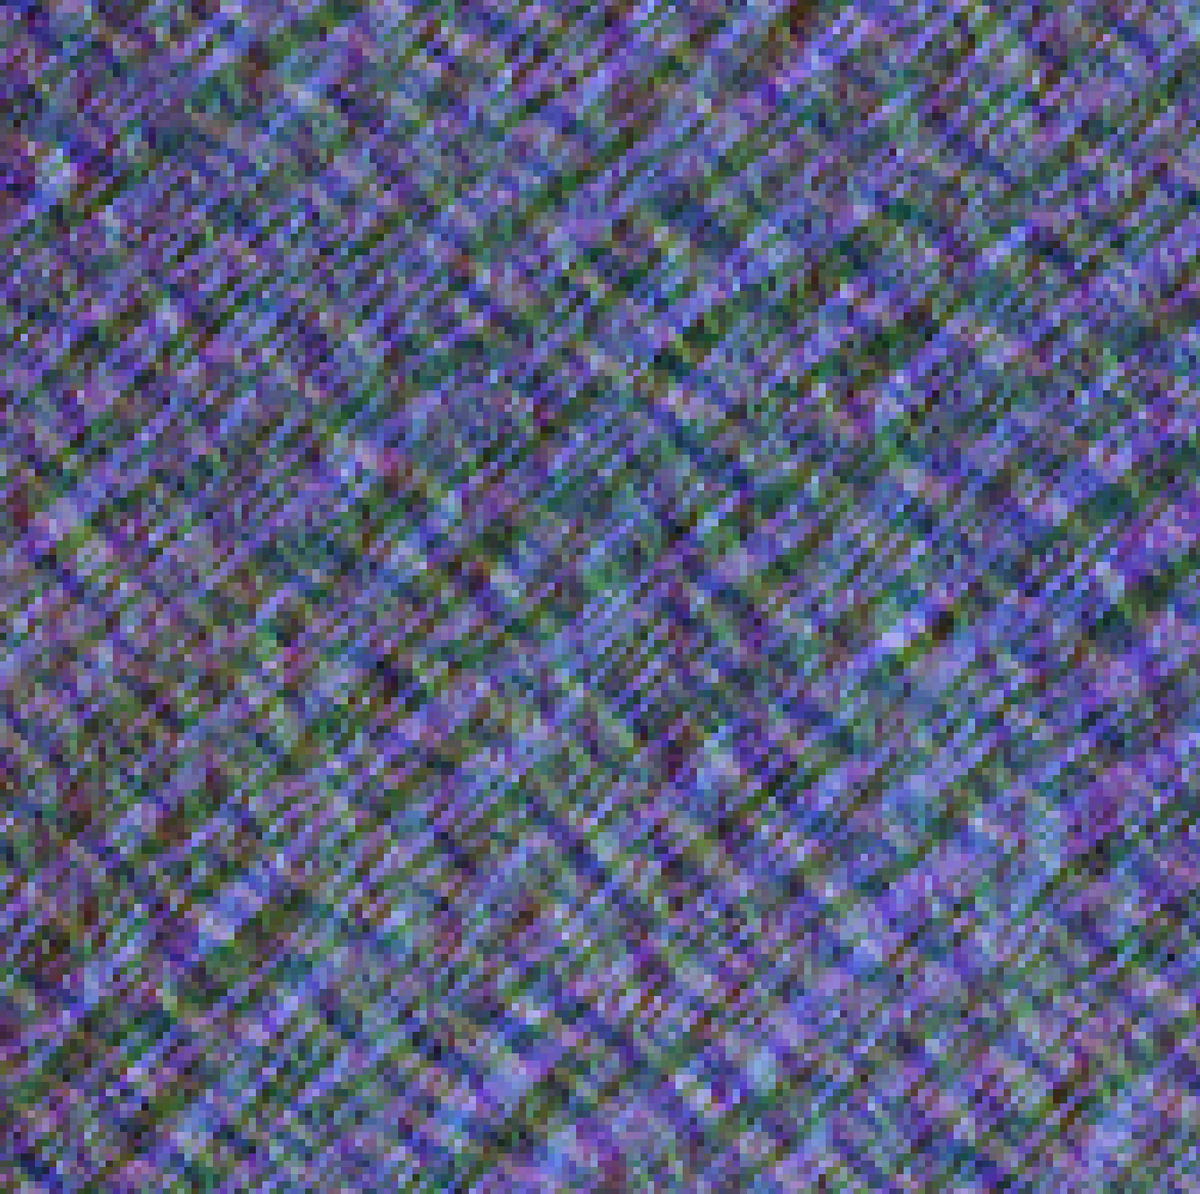
computer vision nerds: i’m trying to extract swell directions and amplitudes from satellite images. i know in theory i should be able to use a sliding FFT for this but i would love any more tips  https://abs.twimg.com/emoji/v2/... draggable="false" alt="🙏" title="Folded hands" aria-label="Emoji: Folded hands"> https://www.dropbox.com/s/vhb41rlikdsx1bf/high-resolution-duffs.jpg?dl=0">https://www.dropbox.com/s/vhb41rl...
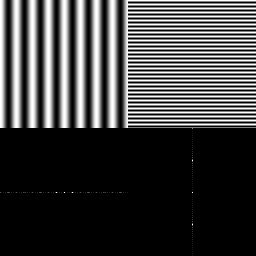
the basic idea is to look for peaks in the FT, but i have a feeling it’s not going to be anywhere near this clean  https://abs.twimg.com/emoji/v2/... draggable="false" alt="🙃" title="Auf den Kopf gestelltes Gesicht" aria-label="Emoji: Auf den Kopf gestelltes Gesicht"> https://www.cs.unm.edu/~brayer/vision/fourier.html">https://www.cs.unm.edu/~brayer/v...
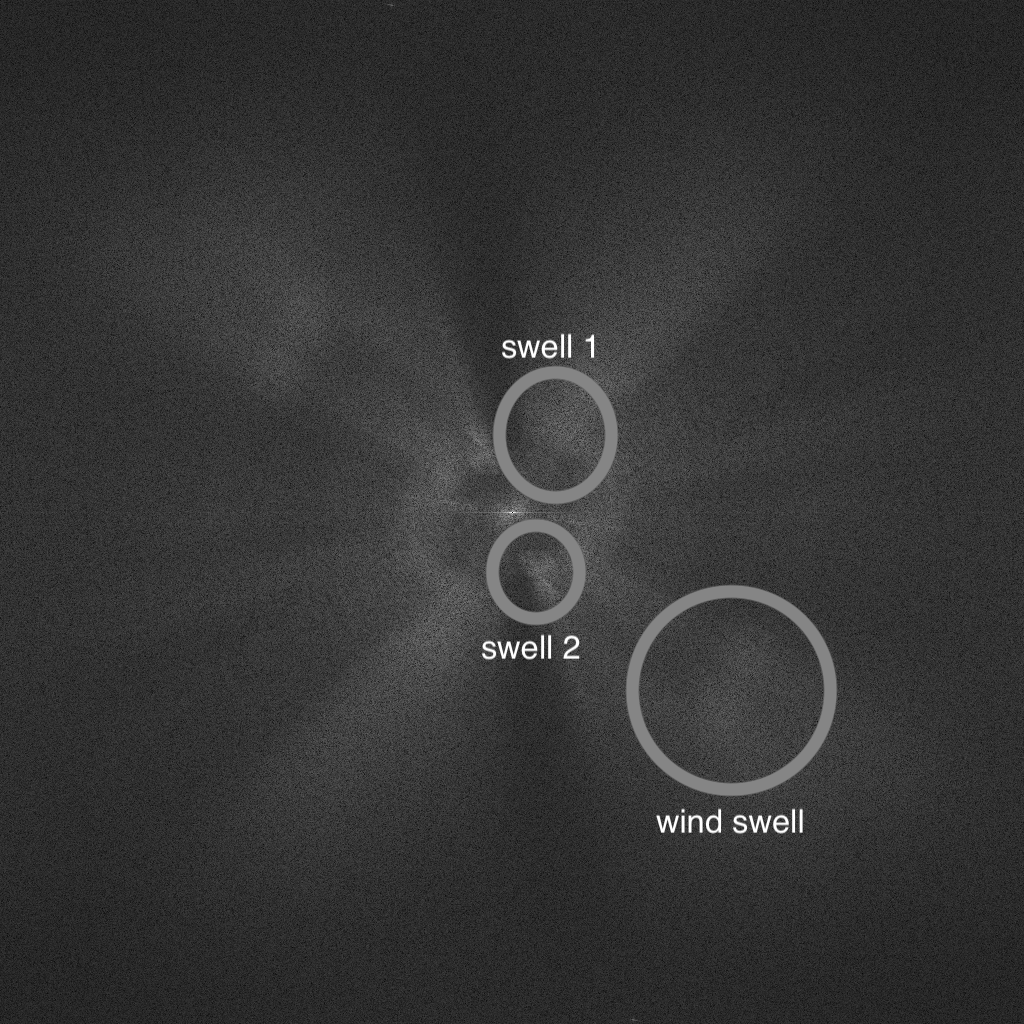
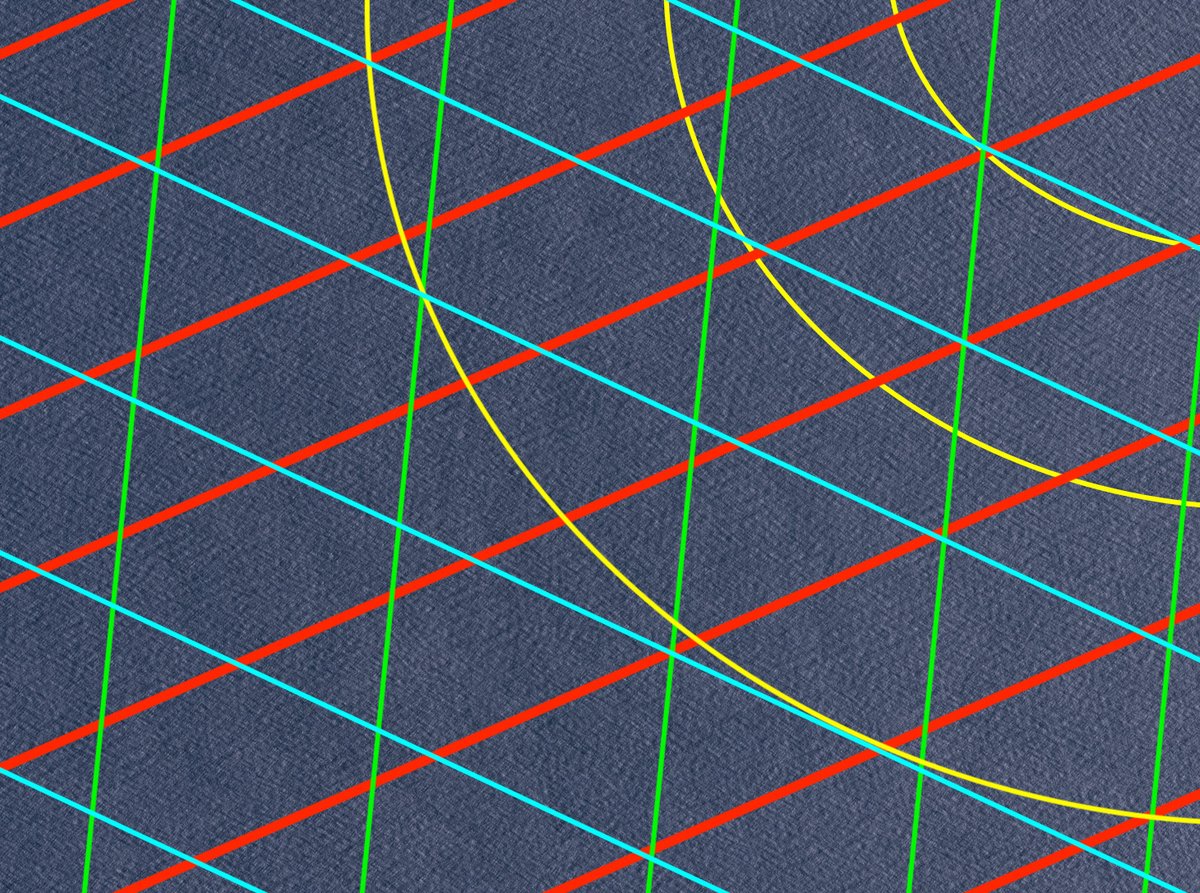
when you feed these images through a DFT, you do get a few splotches of energy that seem to correspond to swells. i highlight two lower frequency swells (which create small waves in the same direction) as well as one splotch that seems like wind swell.
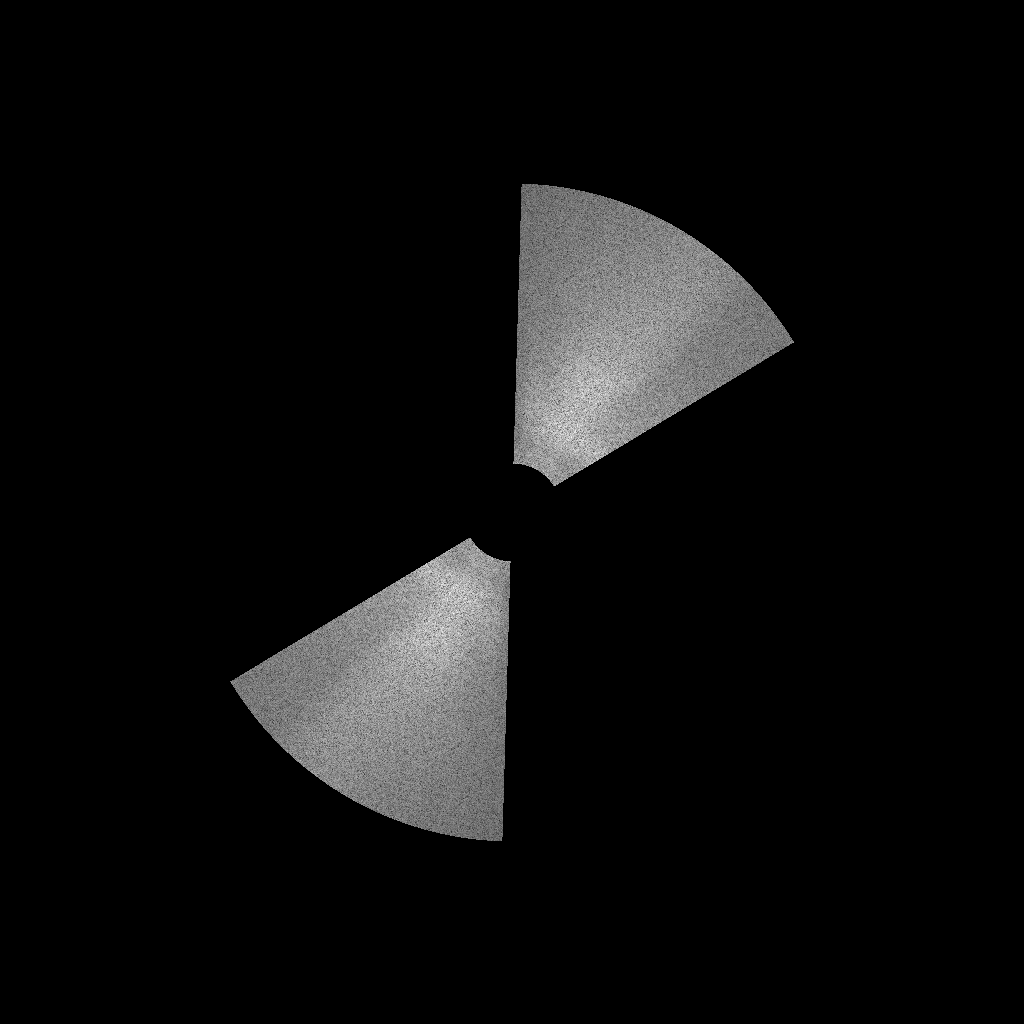
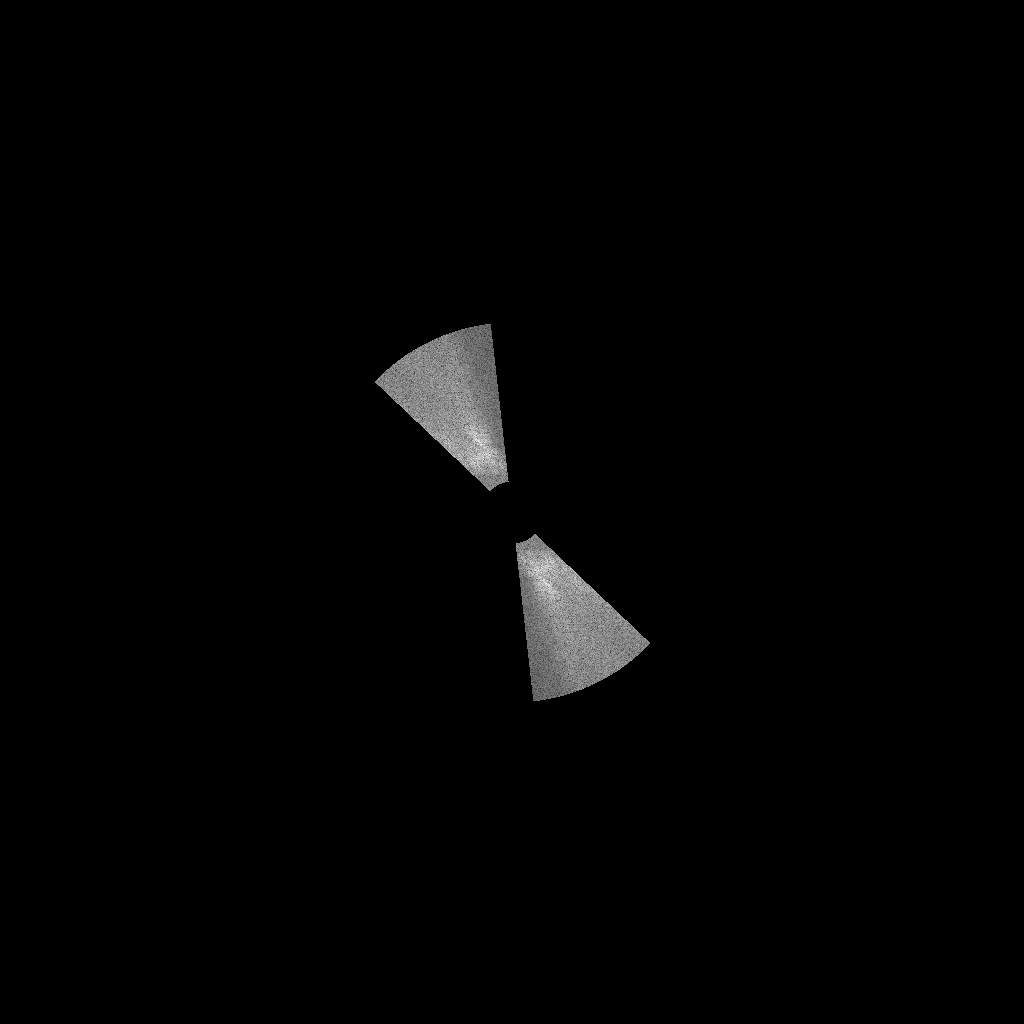
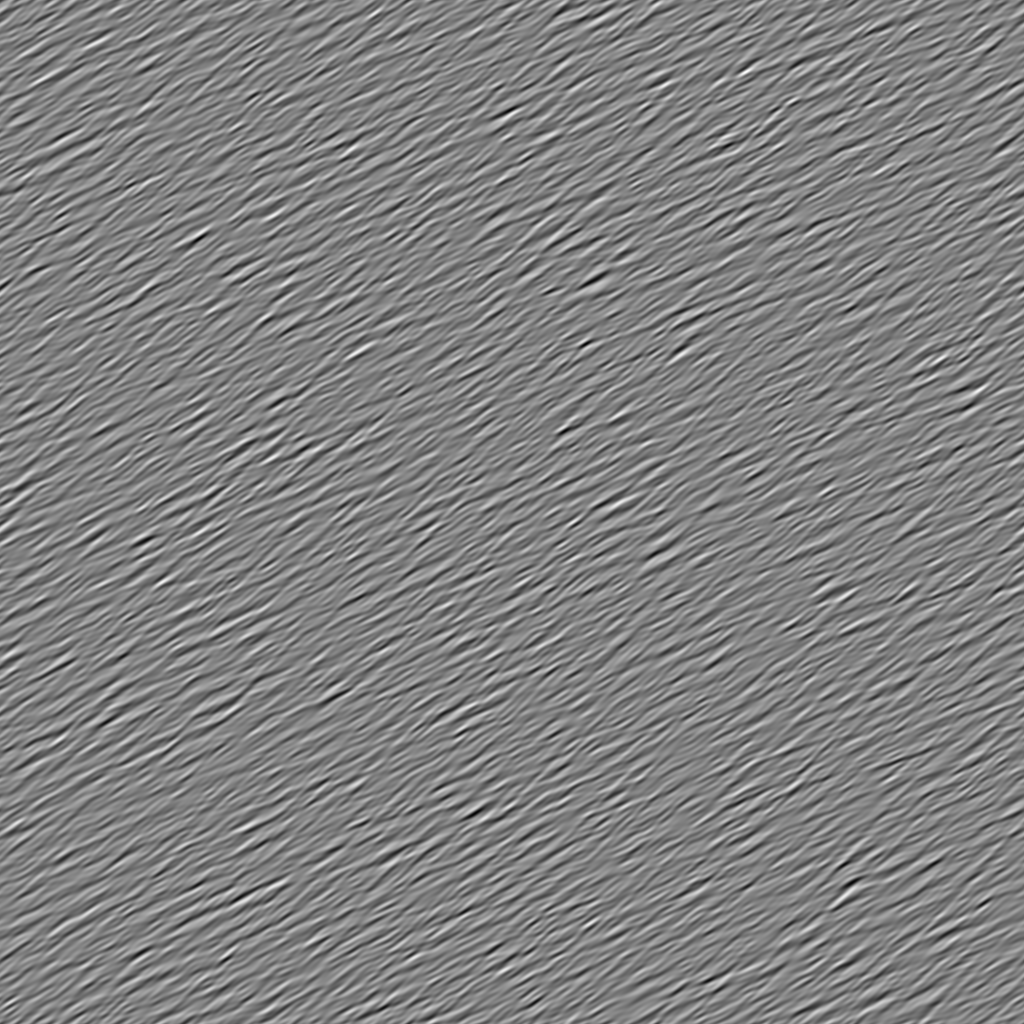
if you mask the relevant region with a frequency-bandpass and orientation-bandpass(?) filter then you can extract the two dominant swells. i& #39;m pretty sure these are from the southwest and southeast, but there is a 180° ambiguity with this analysis.
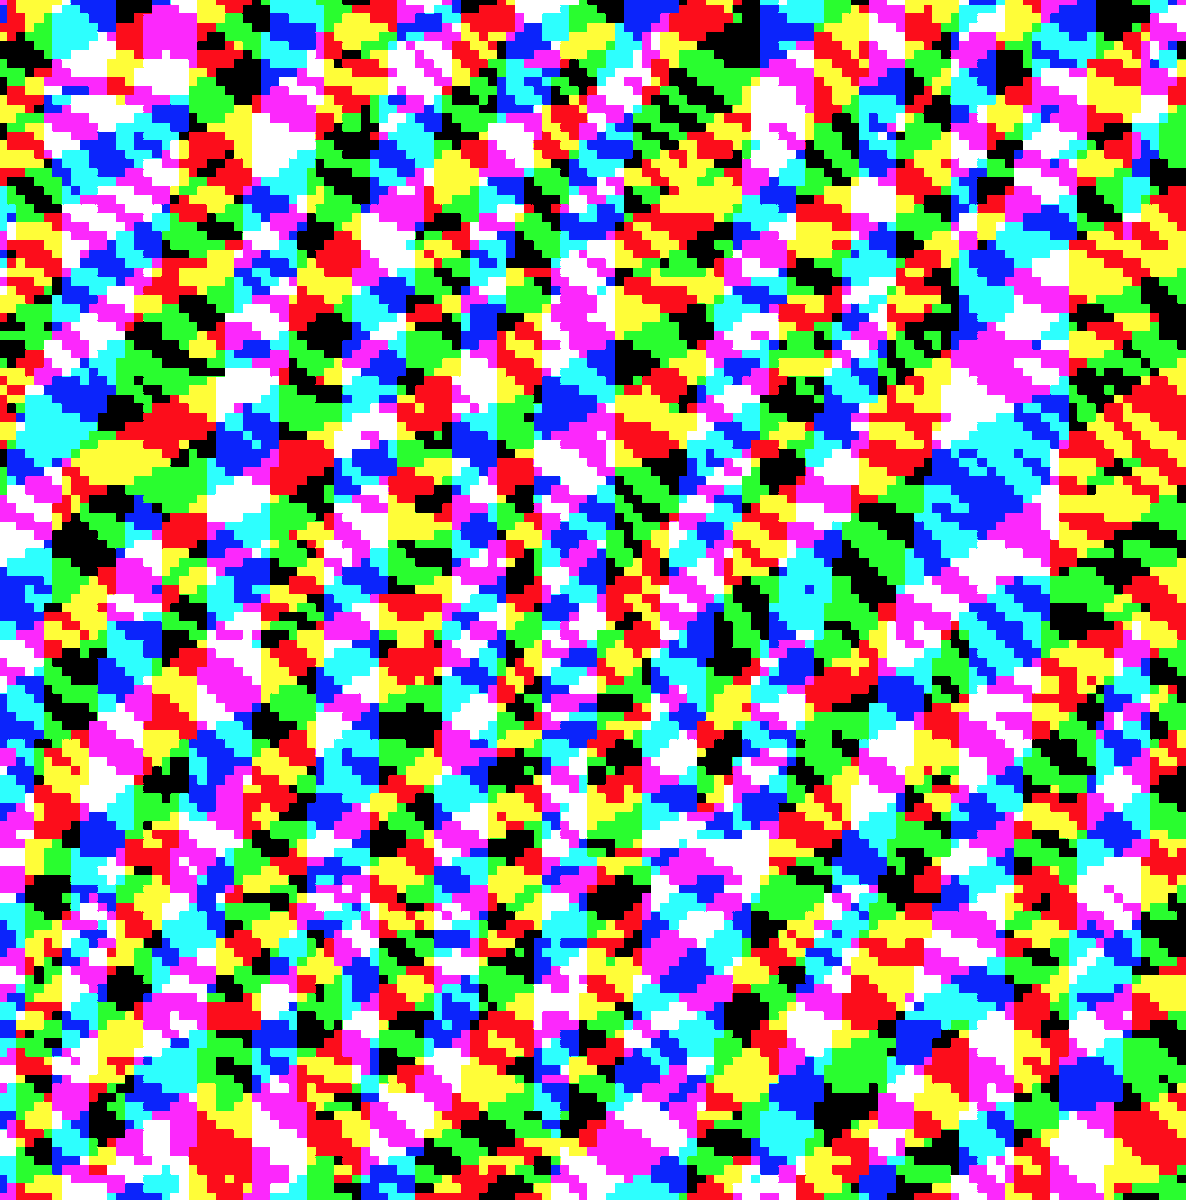
you can extract three swells and assign them to three color channels for a reconstruction in a single image. or you can extract 16 evenly spaced orientations and assign them to a hue rainbow, giving an orientation-colored image (don& #39;t know if there is a name for this..)

 Read on Twitter
 https://www.dropbox.com/s/vhb41rl..." title="computer vision nerds: i’m trying to extract swell directions and amplitudes from satellite images. i know in theory i should be able to use a sliding FFT for this but i would love any more tips https://abs.twimg.com/emoji/v2/... draggable="false" alt="🙏" title="Folded hands" aria-label="Emoji: Folded hands"> https://www.dropbox.com/s/vhb41rl..." class="img-responsive" style="max-width:100%;"/>
 https://www.cs.unm.edu/~brayer/v..." title="the basic idea is to look for peaks in the FT, but i have a feeling it’s not going to be anywhere near this clean https://abs.twimg.com/emoji/v2/... draggable="false" alt="🙃" title="Auf den Kopf gestelltes Gesicht" aria-label="Emoji: Auf den Kopf gestelltes Gesicht"> https://www.cs.unm.edu/~brayer/v..." class="img-responsive" style="max-width:100%;"/>

