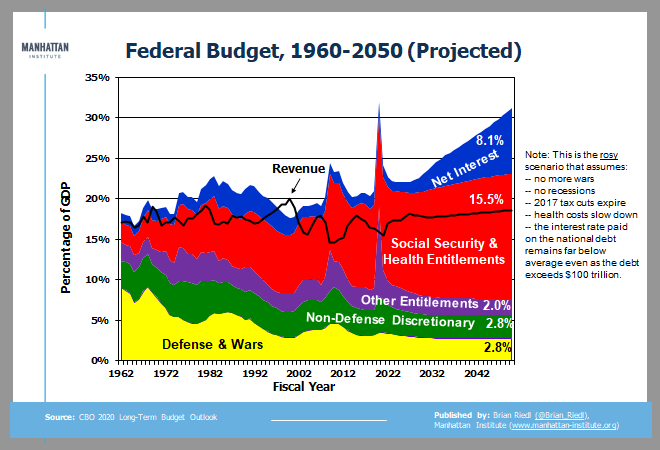
Chartstorm: Today, CBO new released the new 30-year budget baseline. This rosy scenario assumes the 2017 tax cuts expire, no new tax/spending legislation, and low interest rates.
Spending soars to 31.2% of GDP, revenues rise to 18.6%. The 40-yr averages are 20% and 17%. (1/)
Spending soars to 31.2% of GDP, revenues rise to 18.6%. The 40-yr averages are 20% and 17%. (1/)
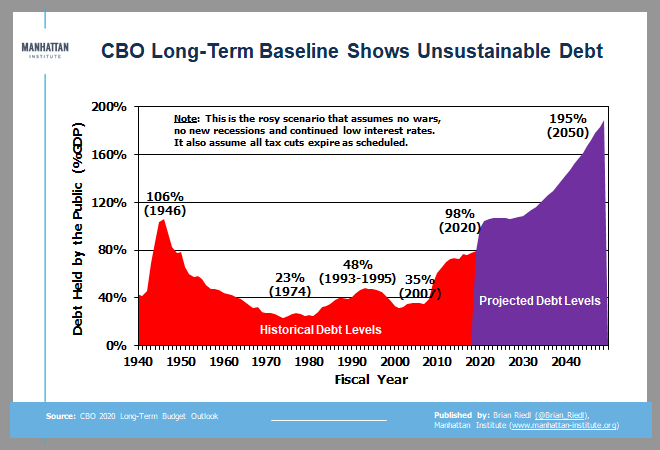
Overall, debt would rise to nearly 200% of GDP under CBO& #39;s rosy scenario. And if interest rates rise, add 15% of GDP debt per for every percentage point. (CBO assumes rates gradually rise to 4.4% over three decades) (2/)
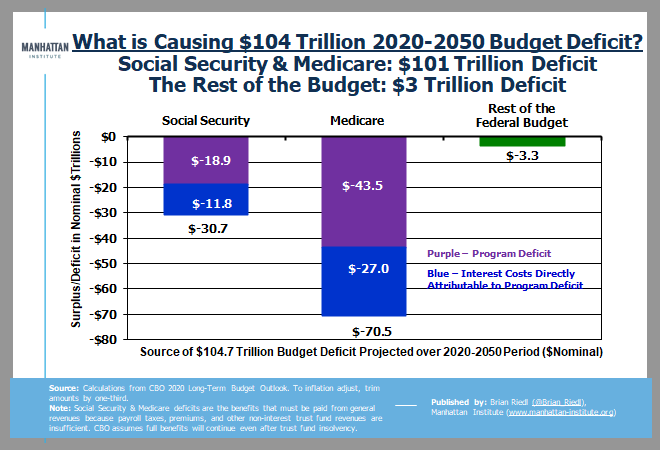
What& #39;s driving this debt? Nearly all $104 trillion in projected budget deficits over 30 years comes from sharply rising general revenue transfers needed to make up Social Security and Medicare& #39;s annual cash deficits. That& #39;s the ballgame. (3/)
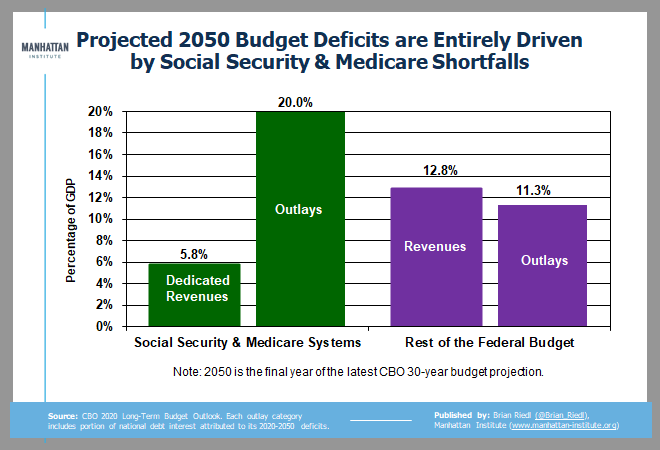
In fact, by 2050 the Medicare & Social Security systems will be running a staggering 14.2% of GDP annual cash shortfall (including the resulting interest costs). The rest of the budget will be running a surplus. (4/)
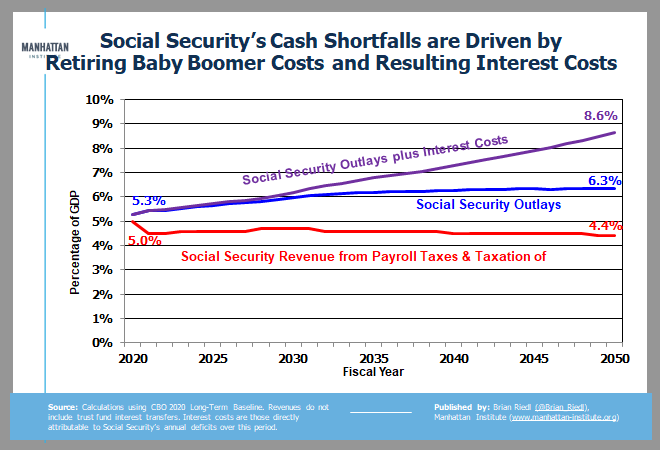
Social Security is straightforward: It will run a pretty steady 1.9% of GDP annual cash deficit - but including the interest costs of these yearly deficits will push that annual shortfall to 4.2% of GDP. (5/)
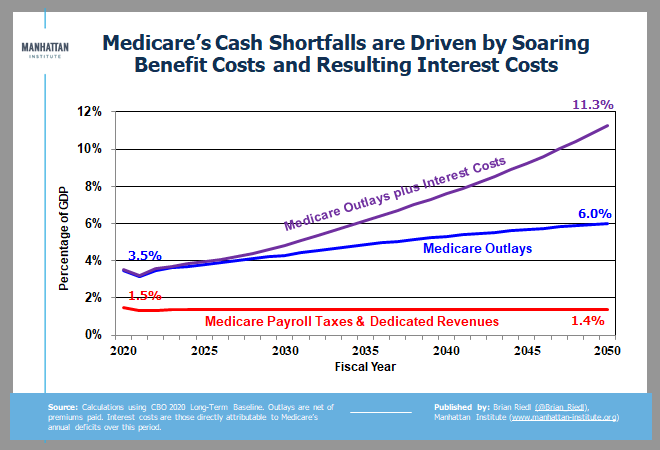
Medicare is in much worse shape. Its annual cash shortfall will leap from 2.0% to 4.6% of GDP -- or 9.9% when including the interest costs. That& #39;s the equivalent of a $2 trillion annual cash shortfall in today& #39;s GDP. (6/)
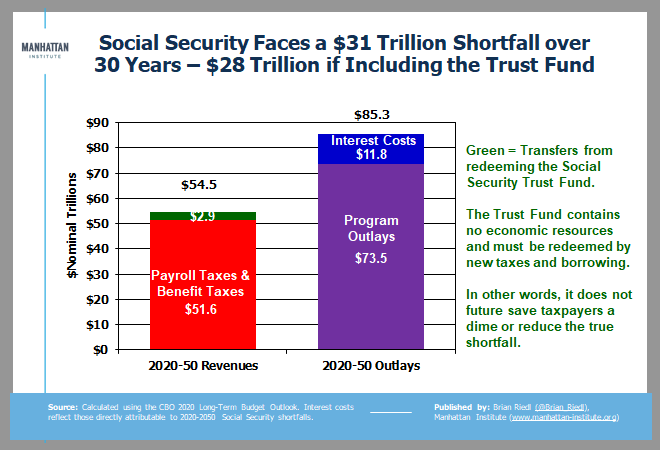
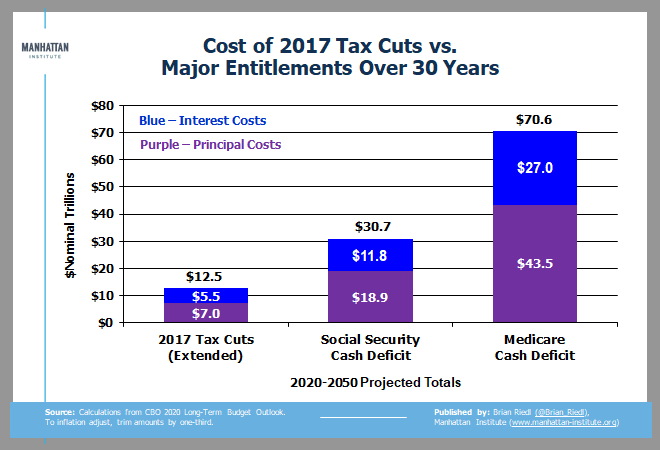
Overall, Social Security will collect $52 trillion in dedicated taxes, and pay out $74 trillion in benefits (plus $12T in interests costs).
Repaying the SocSec Trust Fund (also from new taxes) covers less than $3 trillion of the gap. Its not the cause of these deficits. (7/)
Repaying the SocSec Trust Fund (also from new taxes) covers less than $3 trillion of the gap. Its not the cause of these deficits. (7/)
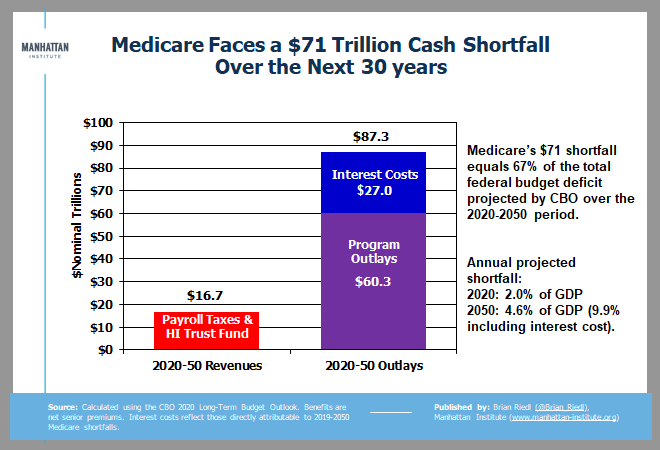
Medicare is in deep trouble. It will collect $17 trillion in payroll (and other) taxes, and pay out $60 trillion in benefits (net of premiums) - while also costing $27 trillion in interest. That $71 trillion shortfall is responsible for 67% of all budget deficits over 30 yrs (9/)
By the way, advocates of Medicare-for-all should grapple with the current Medicare system& #39;s $70 trillion shortfall over 30 years (9.9% of GDP by 2050). Perhaps we should figure out how to pay for our current commitments before making expensive new ones. (10/)
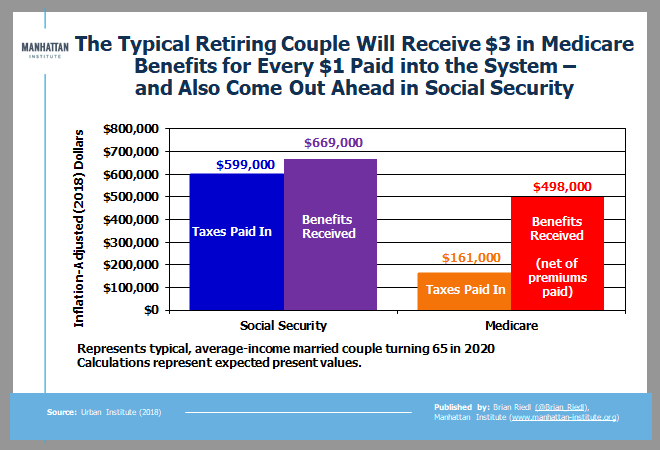
The Social Security & Medicare shortfalls are driven by: A) 74 million retiring baby boomers, and B) systems that pay the typical retiree much more in benefits than they ever contribute in taxes & premiums (even adjusted into present values) (/11)
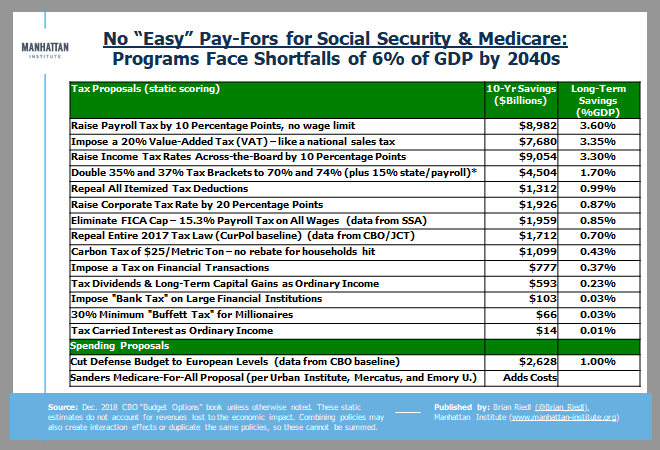
Because everyone has their "easy" (and mathematically-wrong) tax solution -- here is CBO data on how much the typical taxes would rise.
And yes, eliminating the SocSec wage cap would raise 0.85% of GDP - but SocSec& #39;s baseline shortfall rises 1.9%, so need much more. (12/12)
And yes, eliminating the SocSec wage cap would raise 0.85% of GDP - but SocSec& #39;s baseline shortfall rises 1.9%, so need much more. (12/12)

 Read on Twitter