@SalomonJA makes the suggestion that we may be on course for a plateau in the number of new daily COVID19 deaths in the USA. Or at least a much less rapid rate of decrease than we’ve seen recently.
Here& #39;s a thread that mostly concurs with this suggestion /1 https://twitter.com/SalomonJA/status/1307785896452792320">https://twitter.com/SalomonJA...
Here& #39;s a thread that mostly concurs with this suggestion /1 https://twitter.com/SalomonJA/status/1307785896452792320">https://twitter.com/SalomonJA...
(particularly the second possibility) and draws on several other models and additional analysis to support it. 2/
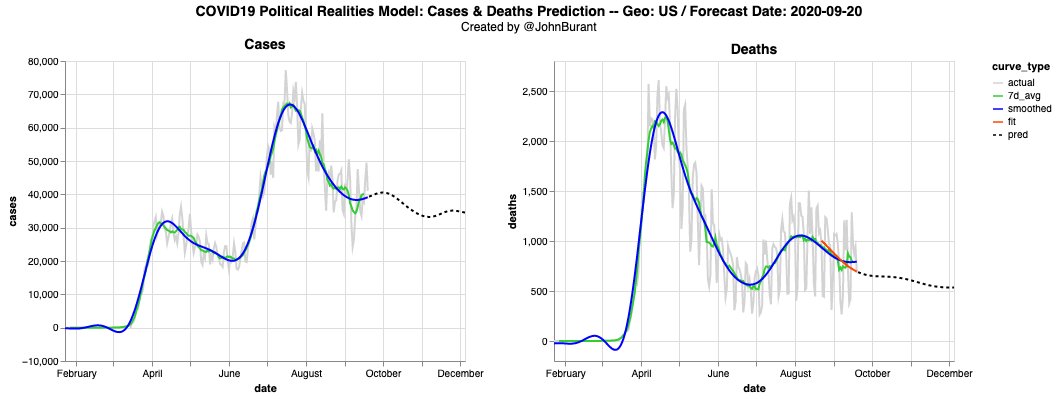
First, the projections from another model: Mine. While it certainly can’t be said that it’s been one of the “most widely watched” mortality projection models, it has during its lifetime been among the most accurate submitted to the @reichlab’s Covid19 Forecast Hub & @cdcgov. 3/
For the medium term, it now has projections that are less optimistic than they were only a couple weeks ago. Two weeks ago, the model projected approximately 3,000 deaths during the last week of October. As of one week ago this had increased to approximately 3,500. 4/
Currently the model is estimating approximately 4,000 for that week. 5/
In the short term, its predictions remain consistent with those over the past several weeks, i.e., for continued modest decrease in deaths. 7/
This model projects mortality based on observed confirmed case count (with predicted future case development based on historical precedent applied to current trends). So it builds in effects from possibly increasing case counts (as @SalomonJA observed, case counts may 8/
indeed be ticking up at the moment, even taking into account Labor Day reporting delay issues). With regard to case counts, my model currently projects roughly flat cases of 40,000 per day through early October. 9/
For the record, the historical accuracy of this model in comparison with others can be seen here (line “JCB-PRM”)
https://twitter.com/JohnBurant/status/1305964605336944640?s=20
10/">https://twitter.com/JohnBuran...
https://twitter.com/JohnBurant/status/1305964605336944640?s=20
10/">https://twitter.com/JohnBuran...
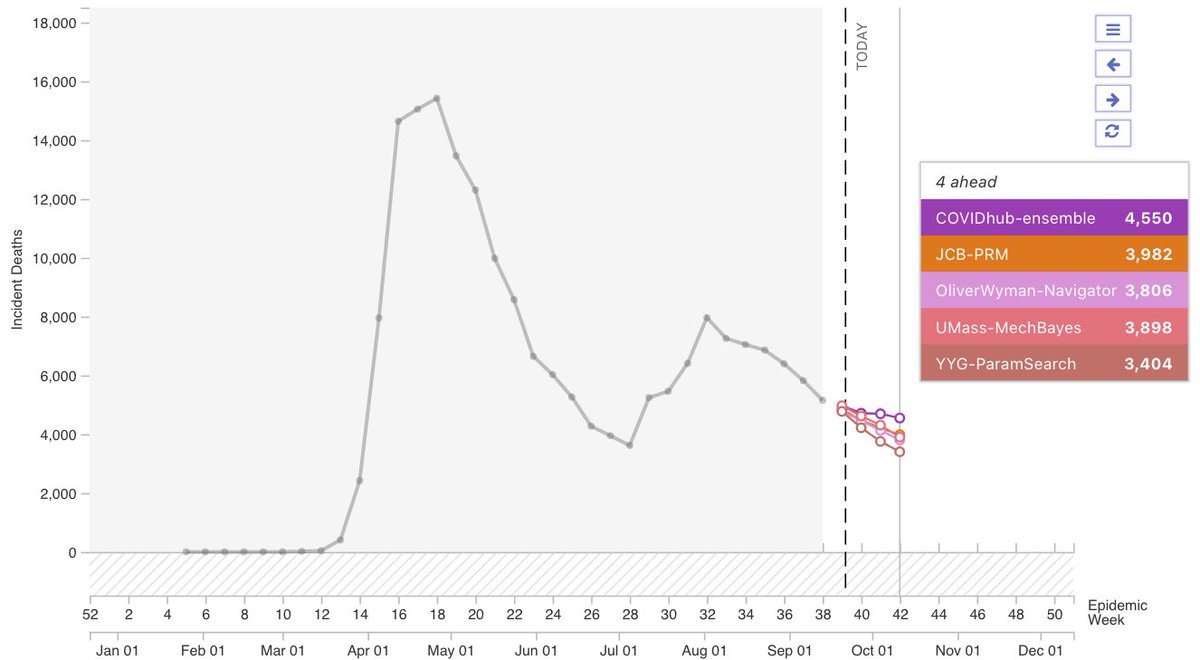
The second major point in this thread draws on two other models present at the @reichlab Forecast Hub that have historically been among the most consistently accurate. These are the @OliverWyman Pandemic Navigator and the UMass-MechBayes models (dev by Reich & collabs). 11/
This snapshot shows the latest predictions available (as of the beginning of week 38, i.e. Monday 14th Sept). As I understand it, both of these models also draw on confirmed cases as an input. While they show continued decline in deaths, and have lower projections than 12/
the COVIDhub-ensemble, they are still above the more optimistic of the two models @SalomonJA uses in his analysis ( @youyanggu’s ParamSearch model). 13/
@youyanggu’s model is noteworthy for several reasons, and so it’s worth it to compare with in this context as @SalomonJA has done. First off, over the long term it has as good a record of accuracy as, though not appreciably different from, these other models. 14/
There’s no debate about that. Secondly, by using solely deaths as the time-varying input (as I understand it), this model was able to make sense of the epidemic and make reasonable predictions very early on, when case counts were essentially useless. 15/
This was very valuable and as a result got a lot of attention. Looking back at the last couple of times there was a turnaround in deaths shows some supporting evidence for use of case counts in making predictions as well, however, now that they are more reliable 16/
and consistent than they were in the spring. And it shows some support for the ensemble approach. Thus, it also supports @SalomonJA’s prediction of a leveling-off. 17/
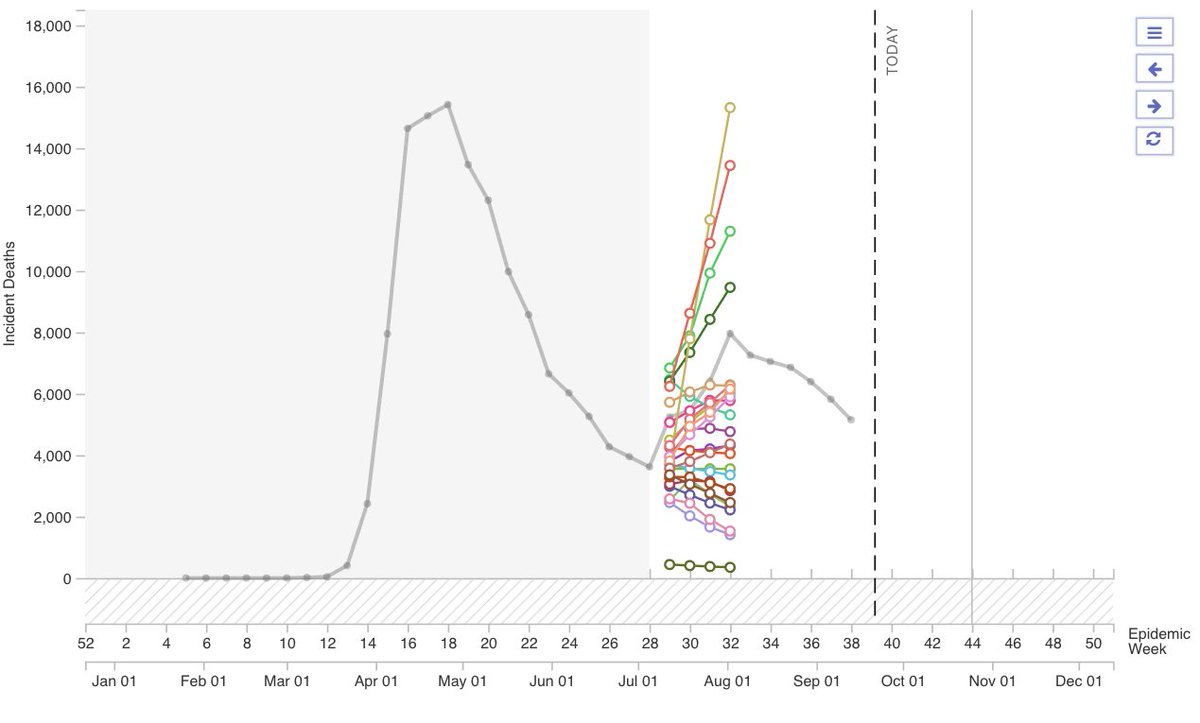
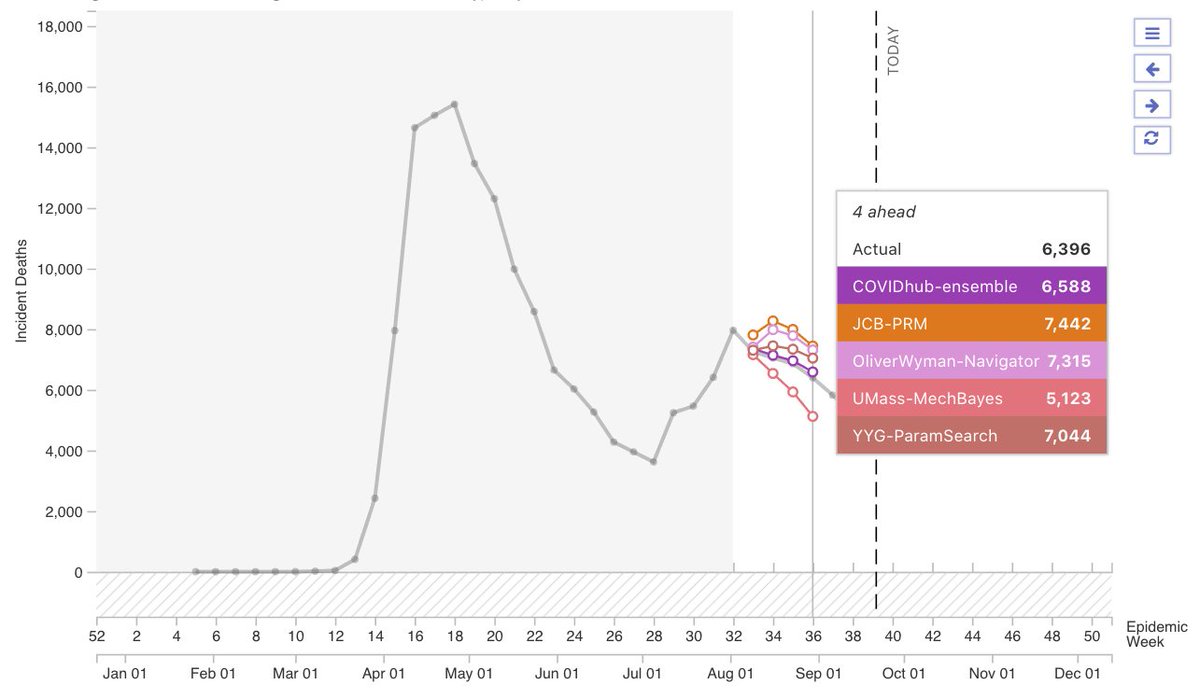
From week 28 to week 31 (i.e., July), there was a substantial increase in deaths, due to the explosions in infections in the South and the West. Most models did not capture this ahead of time: 18/
Notably, however, the @OliverWyman models and the UMass-MechBayes model did a fairly good job, the latter in particular. The ensemble model and the YYG-ParamSearch model got the right direction but made substantial underestimates). 19/
(Note: During the very last week shown here, there was a change in reporting methodology in Texas at the end of July that was largely responsible for the big bump that week; no model could anticipate that.) 20/
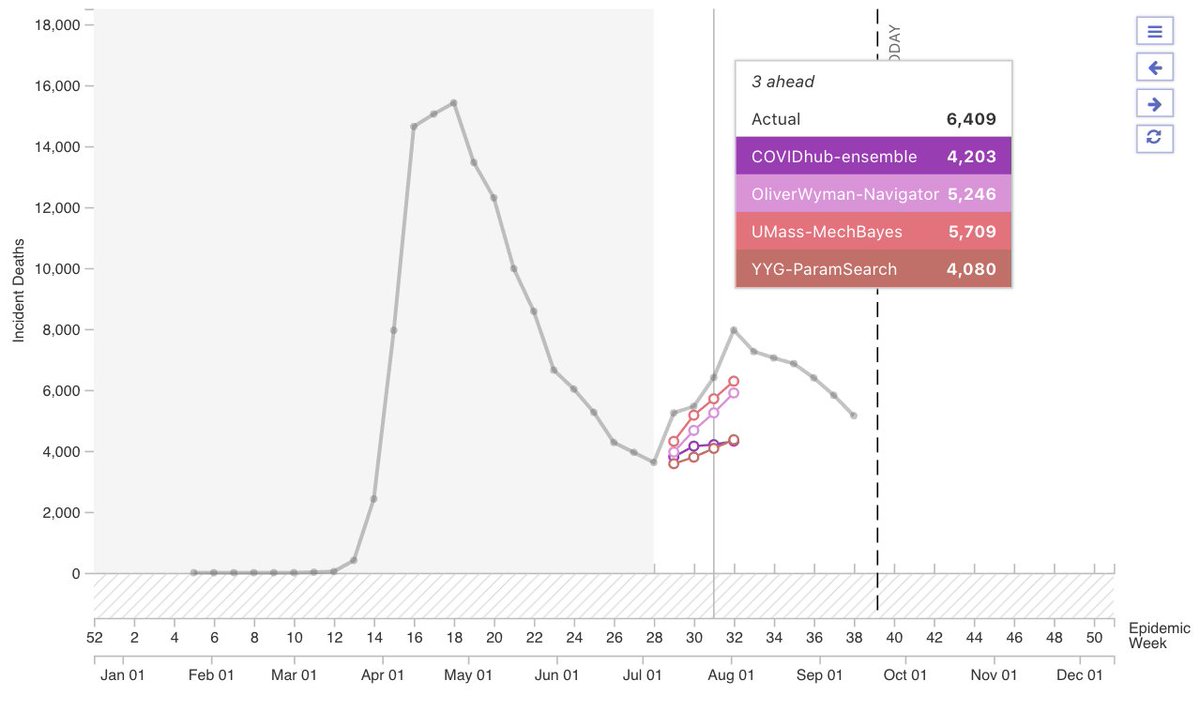
In contrast, when deaths began to decline again in week 32, the ensemble nailed it. YYG-ParamSearch did better than the models that take into account confirmed cases, though none were all that great. Only UMass-MechBayes got the trend completely right over the following 21/
four weeks, but its estimates were substantially lower than reality. That YYG-ParamSearch did well in a period of declining deaths might not be a surprise: One might expect a model trained mostly during periods of decreasing deaths would predict decreasing deaths quite well. 22/
(N.B., I certainly haven’t worked the innards of the model, as the SEIR layer of the model is publicly available but the machine learning layer is not. So: caveat that is speculative.) 23/
For several reasons, I have not attempted here any analysis of the other model @SalomonJA draws on, the IHME model. First, they haven’t submitted forecast to the hub as regularly as other modeling teams, and so data consistent with other models is not (as easily) available 24/
for IHME. Second, their forecasts have very often just not been accurate. This has recently been much discussed on Twitter in light of their recent 400k-death- by-New-Year prediction. More relevant, however, the broad-based analysis of historical accuracy I linked to above 25/
In light of that, taking time to track down (and harmonize) data they haven’t submit to the Forecast Hub or spending time assessing what they have submitted there isn’t really worth it. 26/
In conclusion: Though I’d like to be wrong, I believe we are indeed likely to see daily deaths leveling off somewhat in the United States. Whether this is a flat plateau or just a less rapid decline remains to be seen. The majority of the most accurate 27/
models (including mine) predict the latter. Notably, the most optimistic model (and one that has indeed been historically accurate), does not yet show much signal suggesting this outcome, at least as of projections submitted last Monday. 28/
The ensemble is the most pessimistic and comes closest to predicting a plateau. END/

 Read on Twitter