It& #39;s late, but I didn& #39;t forget death day.
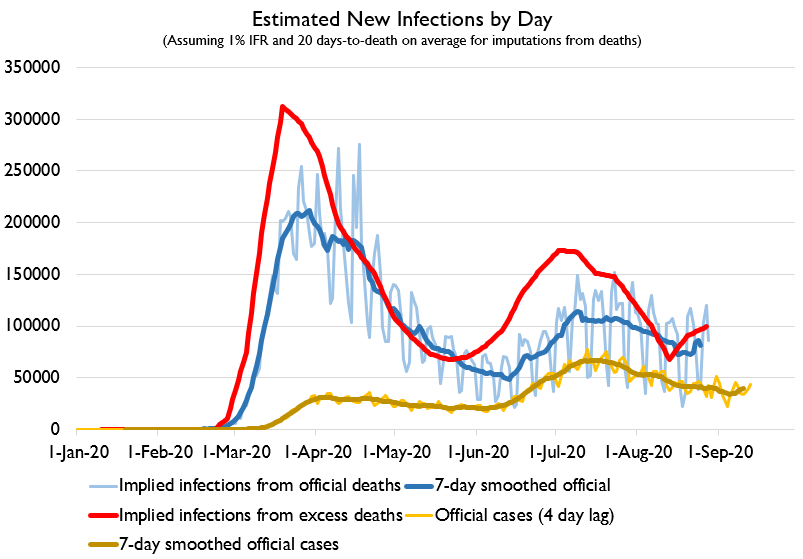
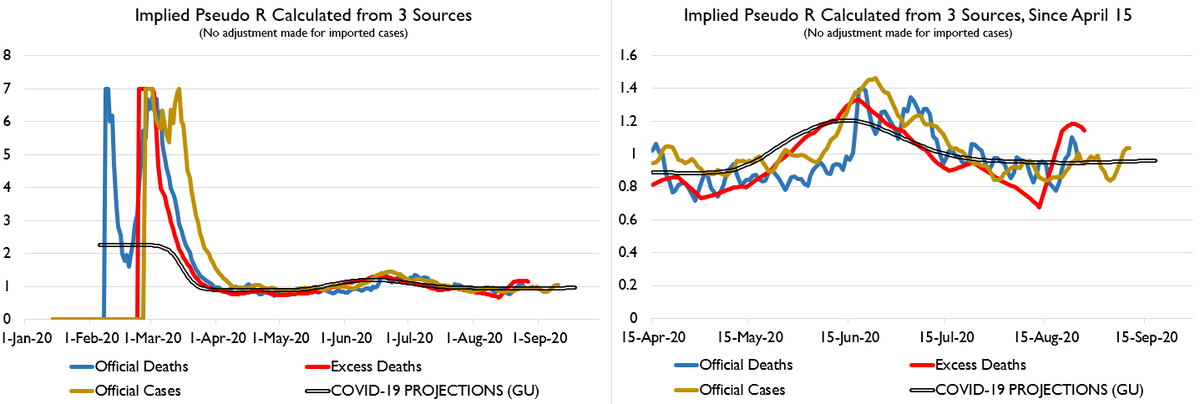
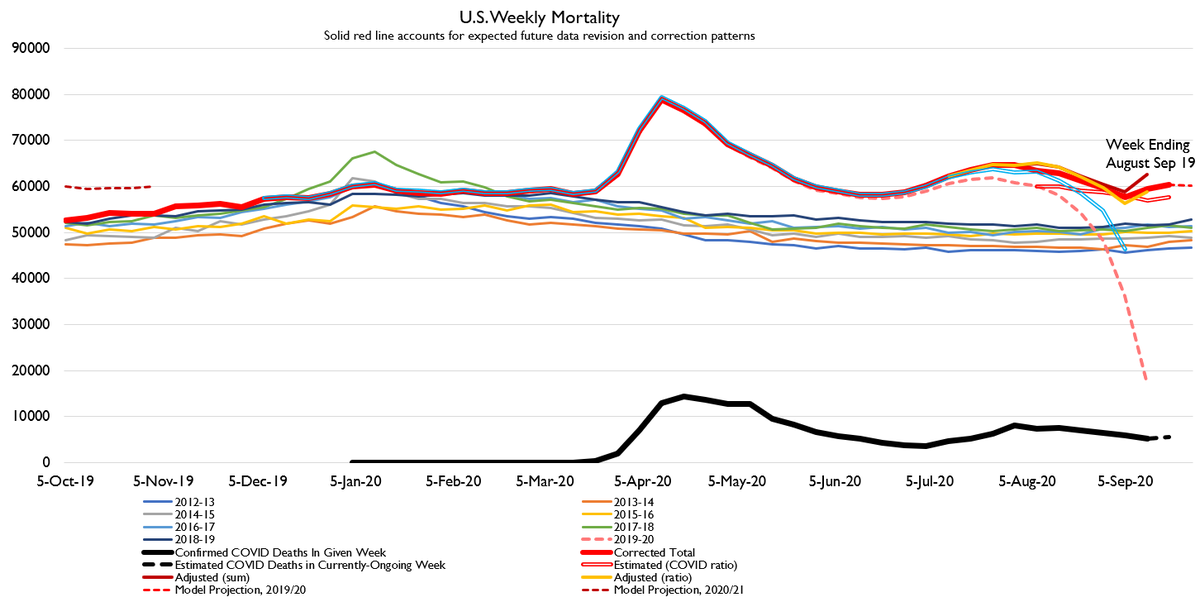
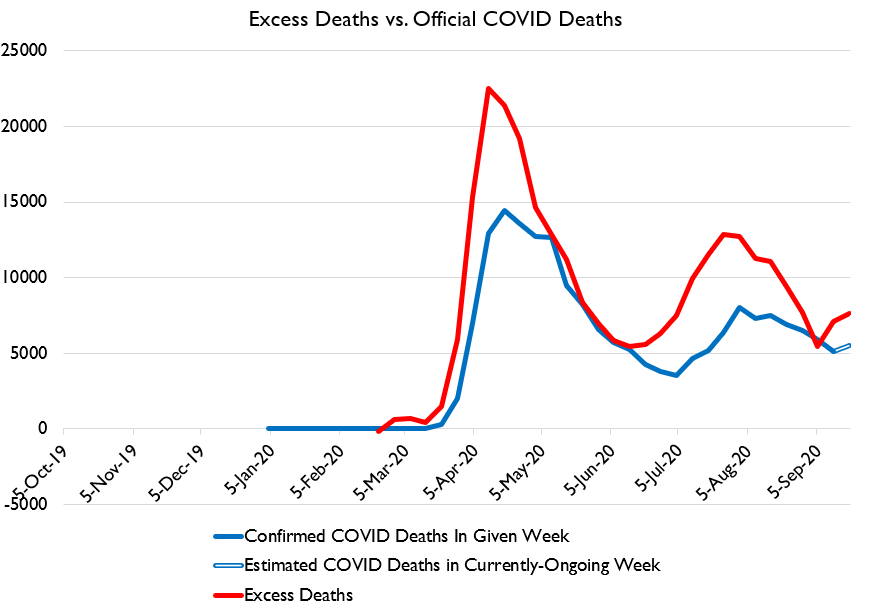
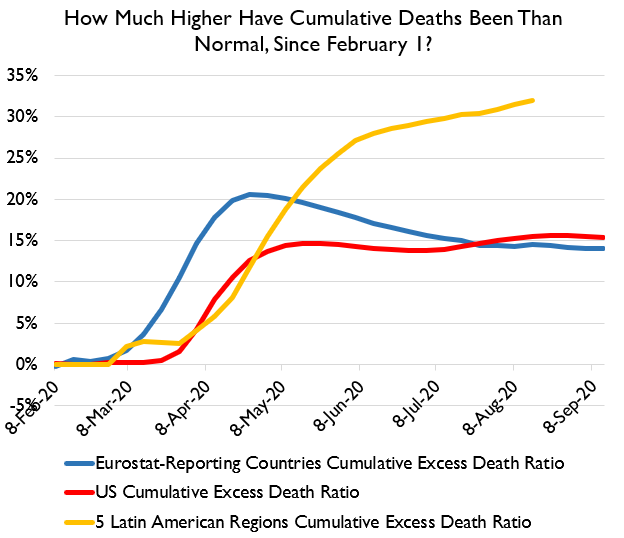
And the news is bad. Estimated R values are up for several indicators. Excess deaths are up. My "normal by Thanksgiving" hopes of the last few weeks have been dashed.
And the news is bad. Estimated R values are up for several indicators. Excess deaths are up. My "normal by Thanksgiving" hopes of the last few weeks have been dashed.
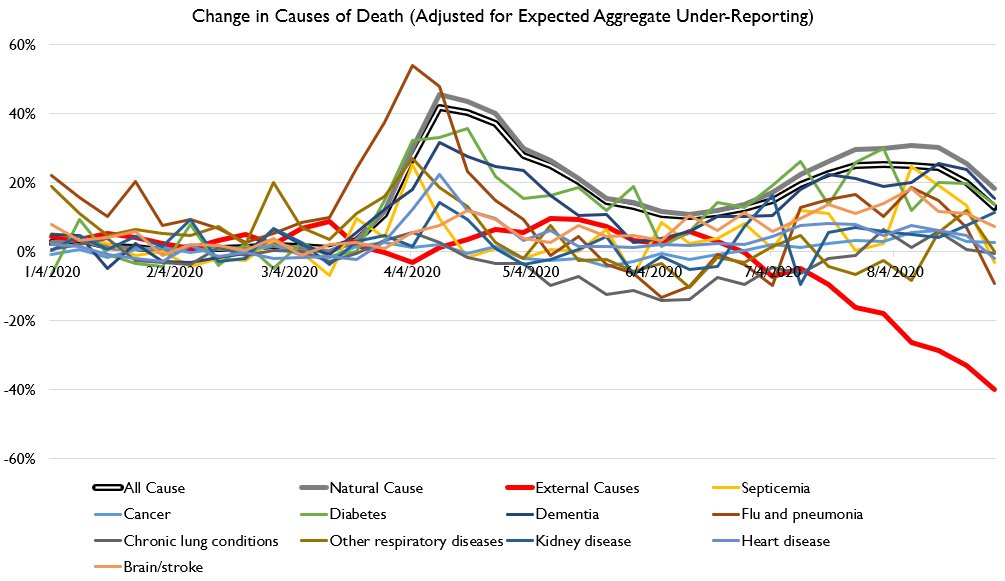
A quick note that I did a thread yesterday about CAUSE OF DEATH DATA, and why cause of death data shows up that rising deaths ARE CAUSED BY COVID, not drug ODs and suicides. The full thread is here: https://twitter.com/lymanstoneky/status/1306697636494356480?s=20">https://twitter.com/lymanston...
The big takeaway from the thread was this graph, showing that virtually all causes of death have spiked in tandem with COVID deaths, EXCEPT external causes, which would include suicide, murder, drug OD, etc.
In fact, while there may be data quality issues here, external-causes deaths appear to be running BELOW normal, suggesting "epidemic of lockdown-induced suicide" narratives are probably not correct.
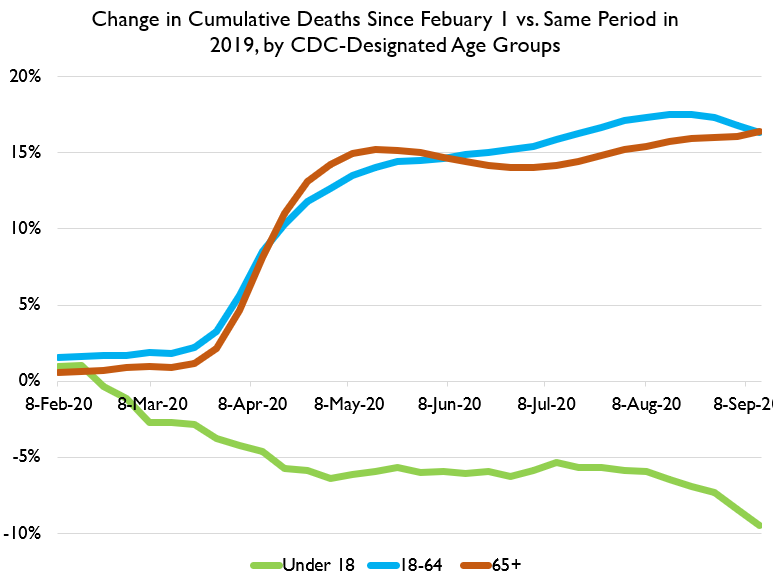
We can also look at deaths by age. Same story holds as has been the case for a while: deaths are down for kids and up for others.
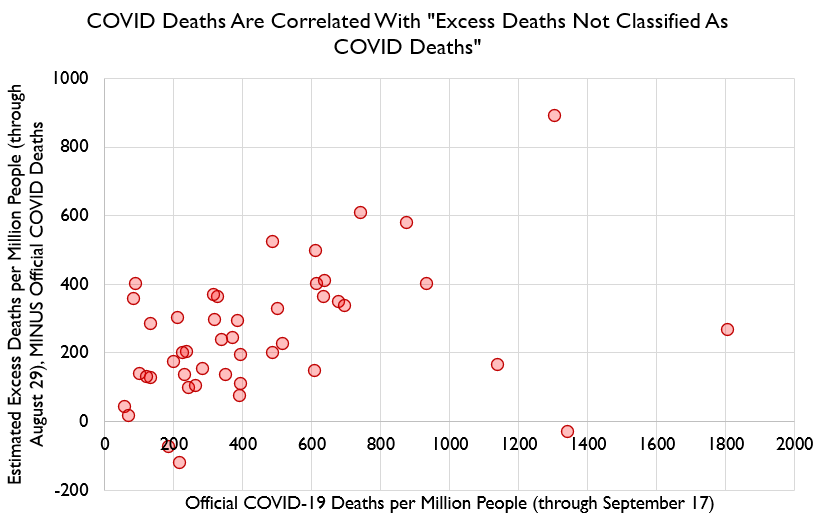
Excess deaths spike WHEN COVID deaths spike, they spike WHERE COVID deaths spike, and the residual of excess minus official COVID deaths is ALSO correlated with COVID deaths. In other words, EXCESS DEATHS ARE COVID DEATHS.
That one in the residual plot which has high deaths and a very low residual is Massachusetts because Massachusetts has a remarkably good vital stats system; remember how I did that series on MA vital stats back to 1844 a while back? They& #39;re good at their jobs!

 Read on Twitter