MASTER-CLASS on OPEN INTEREST
OI is the most important tool for Leverage Trading.
It& #39;s the best tool to judge
- Long/Short sentiment.
- True volume strength.
- Market Structure.
- True Liquidity.
- Shift in trend
Please share it. Every trader needs it.
THIS IS ALL YOU NEED.
OI is the most important tool for Leverage Trading.
It& #39;s the best tool to judge
- Long/Short sentiment.
- True volume strength.
- Market Structure.
- True Liquidity.
- Shift in trend
Please share it. Every trader needs it.
THIS IS ALL YOU NEED.
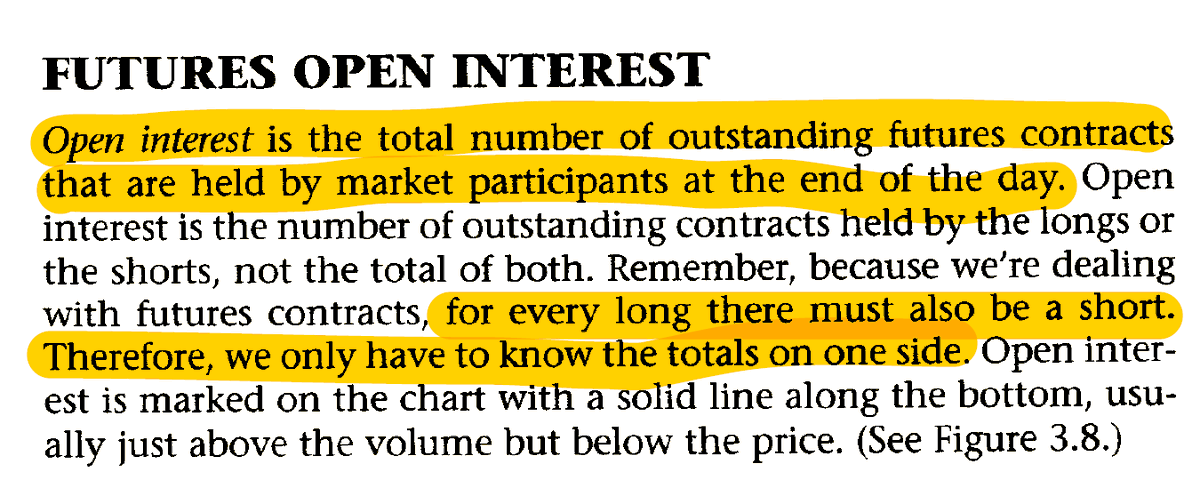
Open interest is the metric that tells you the number of open derivatives contracts (Futures or options).
Each contract has 2 sides. Buyer and the seller or longs and shorts.
The number of open(active) trade contracts is called Open Interest.
Each contract has 2 sides. Buyer and the seller or longs and shorts.
The number of open(active) trade contracts is called Open Interest.
People often confuse volume and OI. While they are related, they aren& #39;t the same.
Volume talks about the number of contracts traded during a day. Buy + Sell = 1 Contract Volume.
Open Interest is explained below.
Volume talks about the number of contracts traded during a day. Buy + Sell = 1 Contract Volume.
Open Interest is explained below.
OI talks about Open contracts i.e. Open positions.
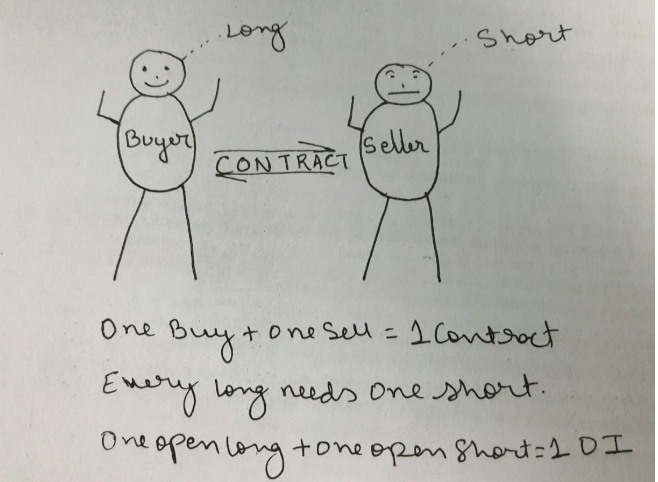
Each contract has 2 sides. A buying (Long) and a selling (Short) side.
Hence in one trade, a buyer goes long and the seller goes short. This forms one contract and not two.
This one contract is denoted as 1 Open Interest.
Each contract has 2 sides. A buying (Long) and a selling (Short) side.
Hence in one trade, a buyer goes long and the seller goes short. This forms one contract and not two.
This one contract is denoted as 1 Open Interest.
OI Calculation.
It& #39;s not difficult and you can understand it very easily, with some patience.
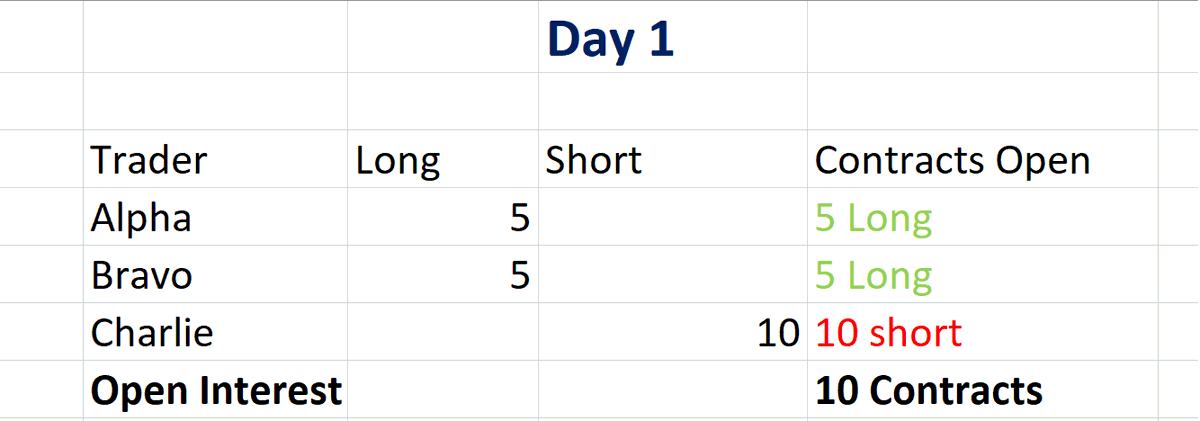
3 Traders A B C are in the market.
A and B think the price will go up and enter a long of 5 contracts each.
C thinks the price will go down and enter a short of 10 contracts.
It& #39;s not difficult and you can understand it very easily, with some patience.
3 Traders A B C are in the market.
A and B think the price will go up and enter a long of 5 contracts each.
C thinks the price will go down and enter a short of 10 contracts.
In the above case, A and B have entered 10 longs together and C has entered 10 shorts.
The total contracts open in the market are 10 and hence the Open Interest is 10.
The total contracts open in the market are 10 and hence the Open Interest is 10.
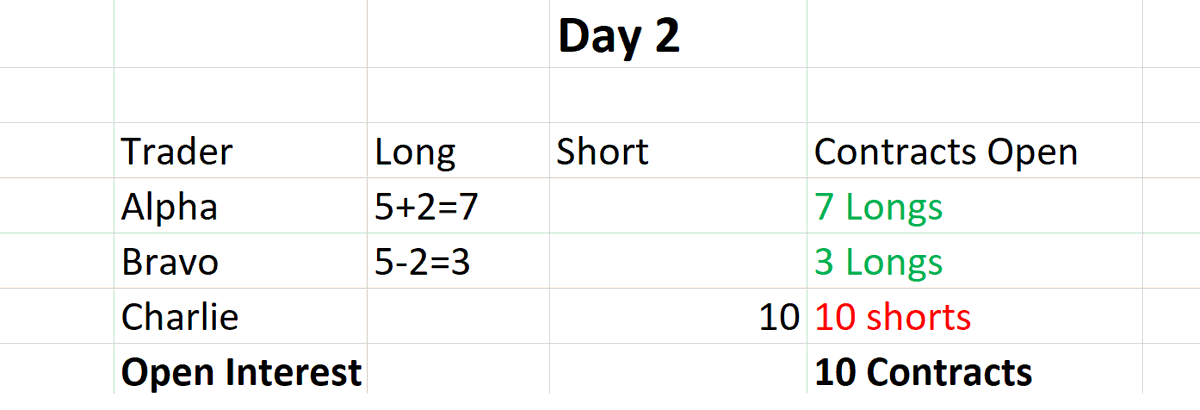
On Day 2
A decides to add 2 longs.
B decides to close 2 longs.
C does nothing.
The total open contracts remain the same.
Conclusion - OI doesn& #39;t change when contacts are transferred.
It changes only when newer contracts are created amongst the participants or be new players.
A decides to add 2 longs.
B decides to close 2 longs.
C does nothing.
The total open contracts remain the same.
Conclusion - OI doesn& #39;t change when contacts are transferred.
It changes only when newer contracts are created amongst the participants or be new players.
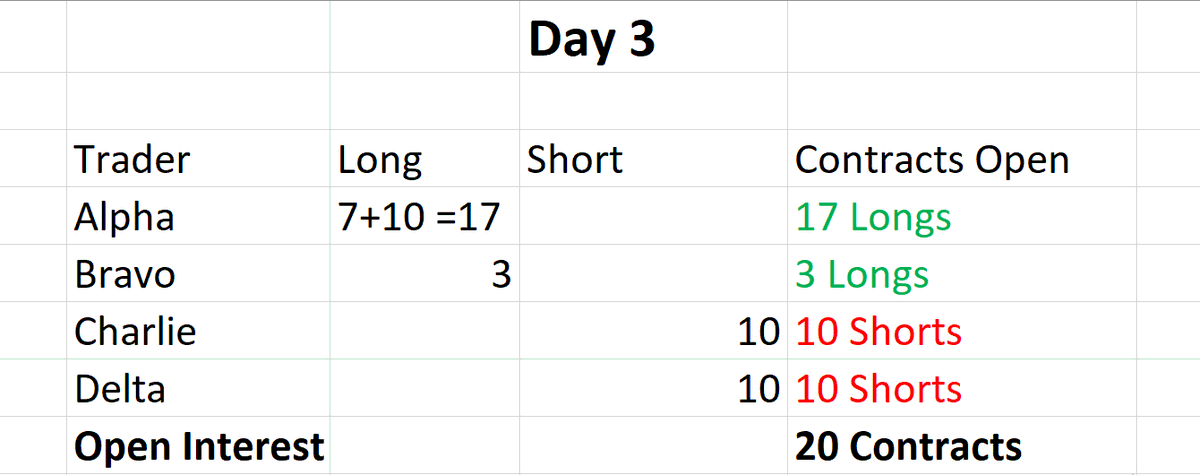
Day 3
D, a new trader enters the market with 10 short Entries.
A increases his long entry by 10.
Total open contracts =20
Conclusion- New open interest is created when new contracts are created, either through new traders or through new market participants.
D, a new trader enters the market with 10 short Entries.
A increases his long entry by 10.
Total open contracts =20
Conclusion- New open interest is created when new contracts are created, either through new traders or through new market participants.
Key takeaways from the calculation.
1. OI means open contracts/positions.
2. There has to be a long for every short, hence derivatives trading is often called a zero-sum game.
3. OI will increase only when new contracts are created in the market.
1. OI means open contracts/positions.
2. There has to be a long for every short, hence derivatives trading is often called a zero-sum game.
3. OI will increase only when new contracts are created in the market.
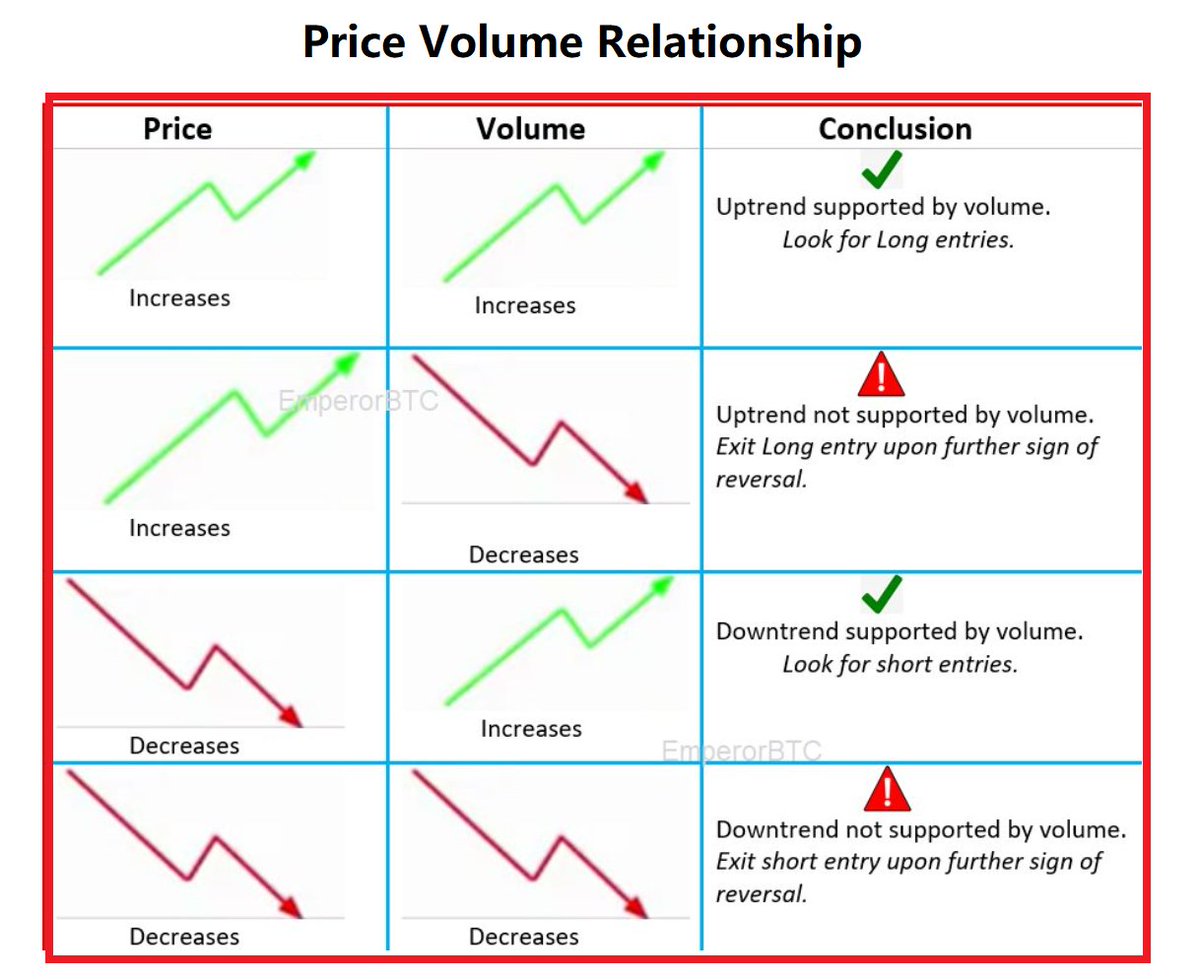
Like volume (explained in the chart below), OI has no use on its own.
It& #39;s just data.
However, when studied along with price, it becomes one of the most important tools for leverage trading, ever.
I always use OI data for swing trading.
Explained Below.
It& #39;s just data.
However, when studied along with price, it becomes one of the most important tools for leverage trading, ever.
I always use OI data for swing trading.
Explained Below.
Open Interest, like price, is continuous data. The new contracts opened are added to the existing OI and that becomes the new OI value.
Volume, on the other hand, is calculated per day and is not continuous.
Volume, on the other hand, is calculated per day and is not continuous.
Let us now understand the 4 different scenarios in open interest and how to use them.
1. Long Build-Up
2. Long Covering(Unwinding)
3. Short Build-Up
4. Short Covering(Unwinding)
1. Long Build-Up
2. Long Covering(Unwinding)
3. Short Build-Up
4. Short Covering(Unwinding)
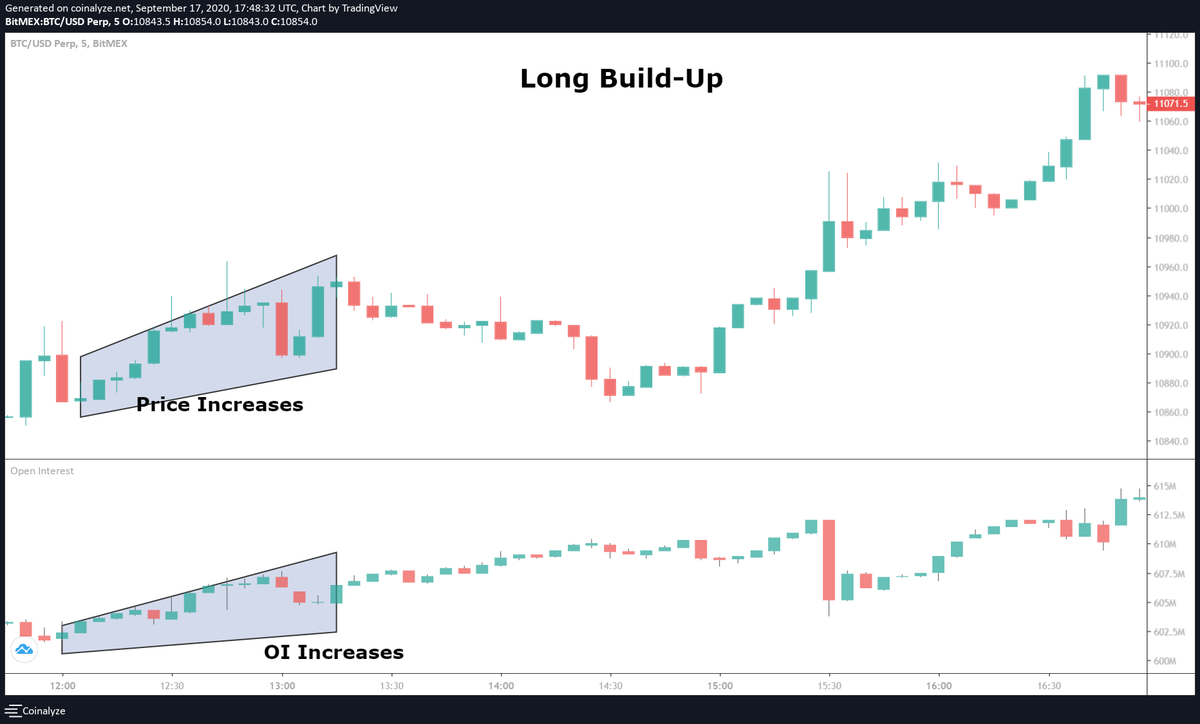
1. Long Build-Up.
Price goes up
OI goes up
A scenario where the price of the asset and the OI increases simultaneously is called a long Build up.
Here the market participants are entering into new contracts and the long sentiment is stronger, pushing the prices higher.
Price goes up
OI goes up
A scenario where the price of the asset and the OI increases simultaneously is called a long Build up.
Here the market participants are entering into new contracts and the long sentiment is stronger, pushing the prices higher.
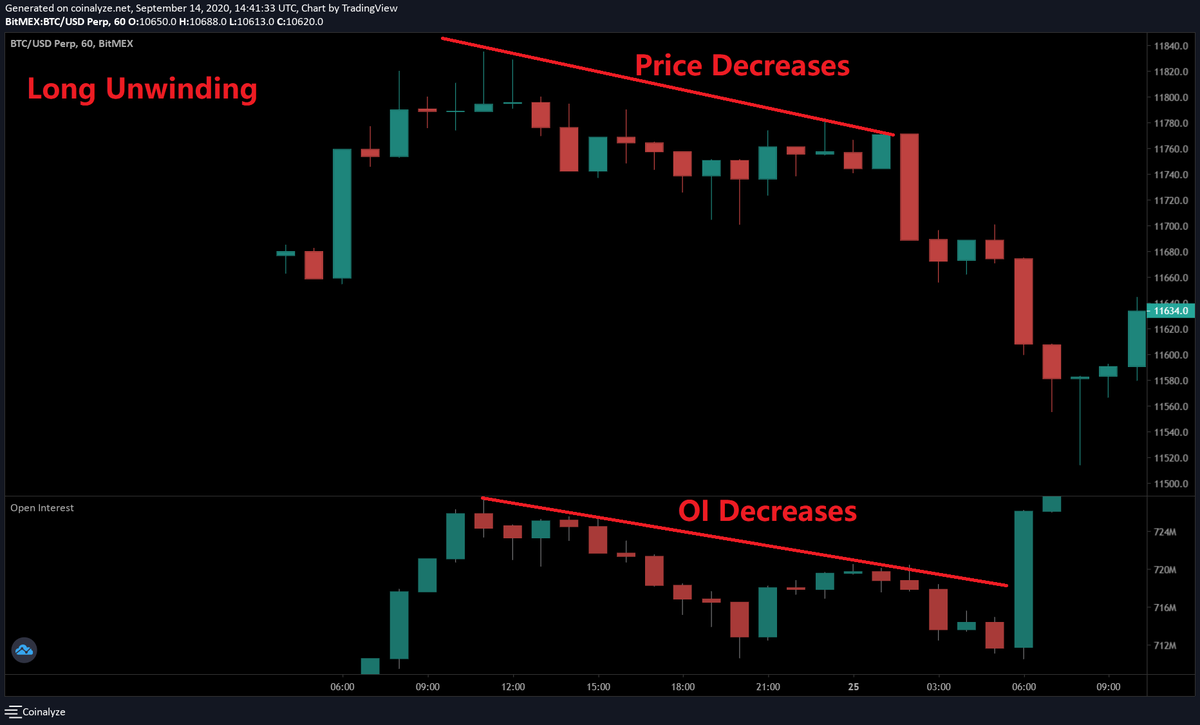
2. Long Covering/Unwinding.
Price Down
OI Decrease
In this scenario the OI and the price both decrease.
This happens because Long previously entered are taking profits i.e. Contracts are being closed, reducing the OI.
Price Down
OI Decrease
In this scenario the OI and the price both decrease.
This happens because Long previously entered are taking profits i.e. Contracts are being closed, reducing the OI.
This is also a declaration of larger traders covering (closing) their longs since they feel the target has been reached or the trend has reversed.
This mostly occurs after the price has seen a substantial rise (See the chart above) and is looking for a retracement or a Reversal.
This mostly occurs after the price has seen a substantial rise (See the chart above) and is looking for a retracement or a Reversal.
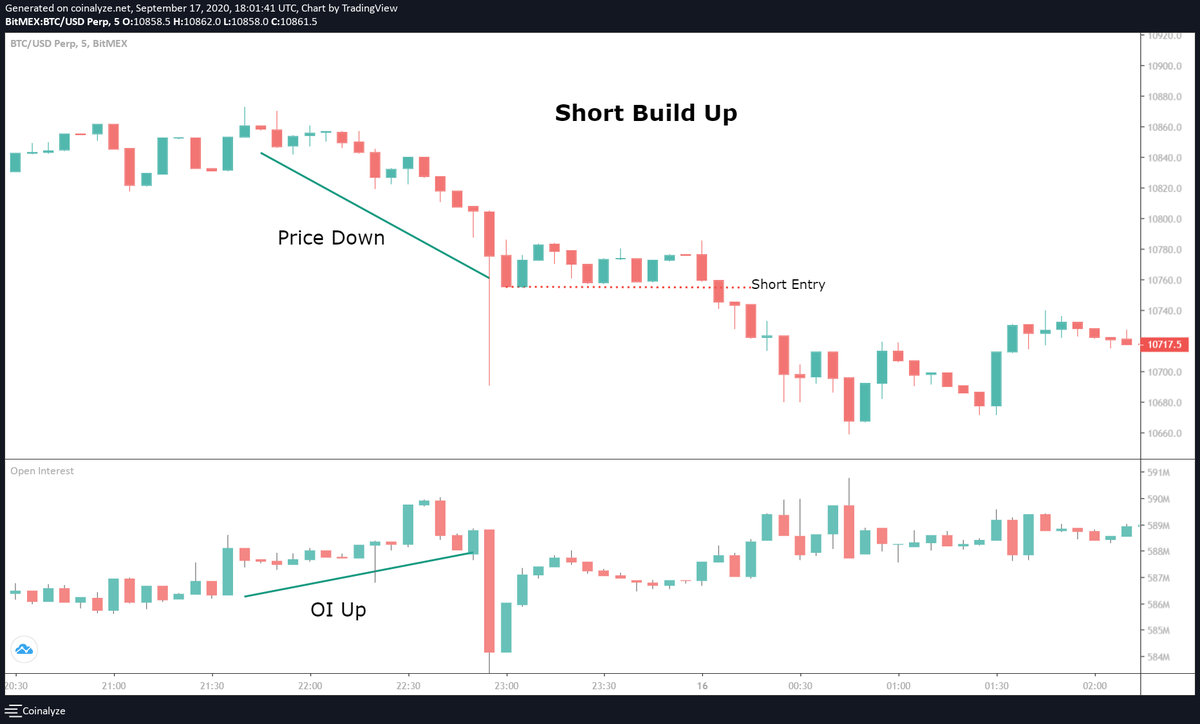
3. Short Build-Up
Price down
OI Up
In this scenario the price goes down with the OI increasing.
The sentiment to open up a short trade is stronger.
New contracts are being formed and hence the OI is increasing.
Short entry scenario explained.
Price down
OI Up
In this scenario the price goes down with the OI increasing.
The sentiment to open up a short trade is stronger.
New contracts are being formed and hence the OI is increasing.
Short entry scenario explained.
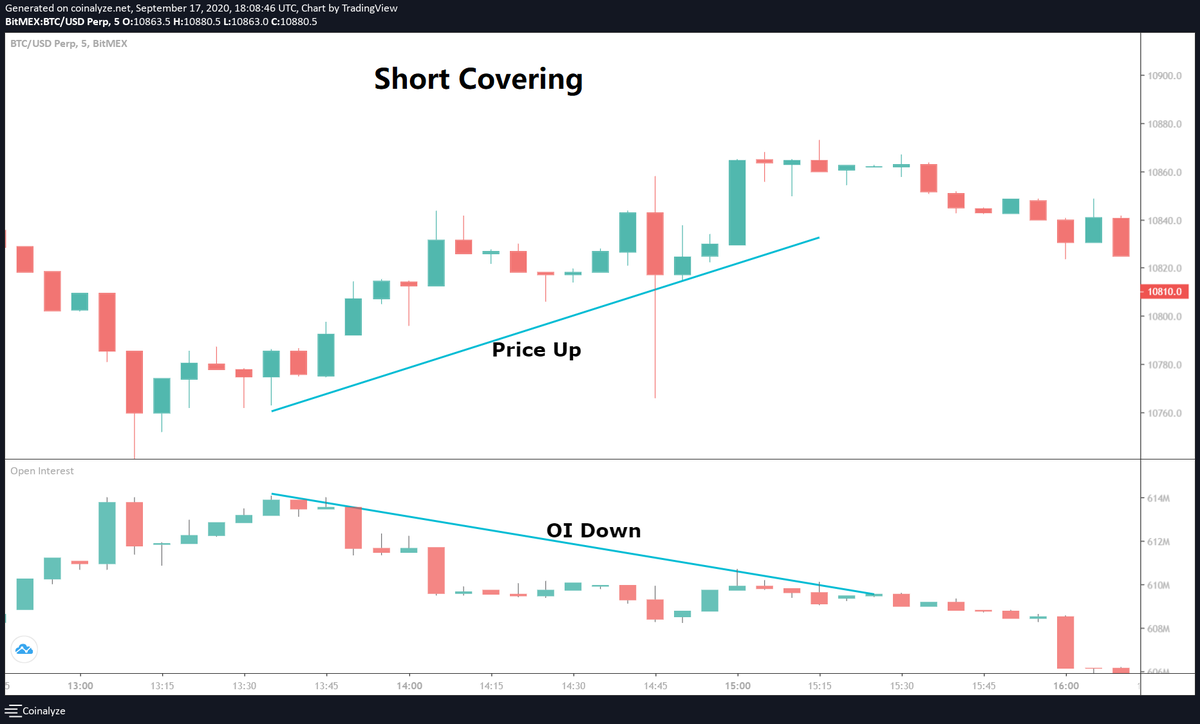
4. Short Covering (Unwinding)
Price up
OI Down
Here the price increases with the OI decreasing.
This means that the people who had entered into a short position are closing their entries.
This generally occurs after the price has made a substantial correction.
Price up
OI Down
Here the price increases with the OI decreasing.
This means that the people who had entered into a short position are closing their entries.
This generally occurs after the price has made a substantial correction.
The Open interest data when studied with Price movement, becomes a very strong indicator to be used with Price Action Trading.
Below we will understand two setups for different scenarios, Long and a Short entry.
Please take the time to study them in detail.
Below we will understand two setups for different scenarios, Long and a Short entry.
Please take the time to study them in detail.
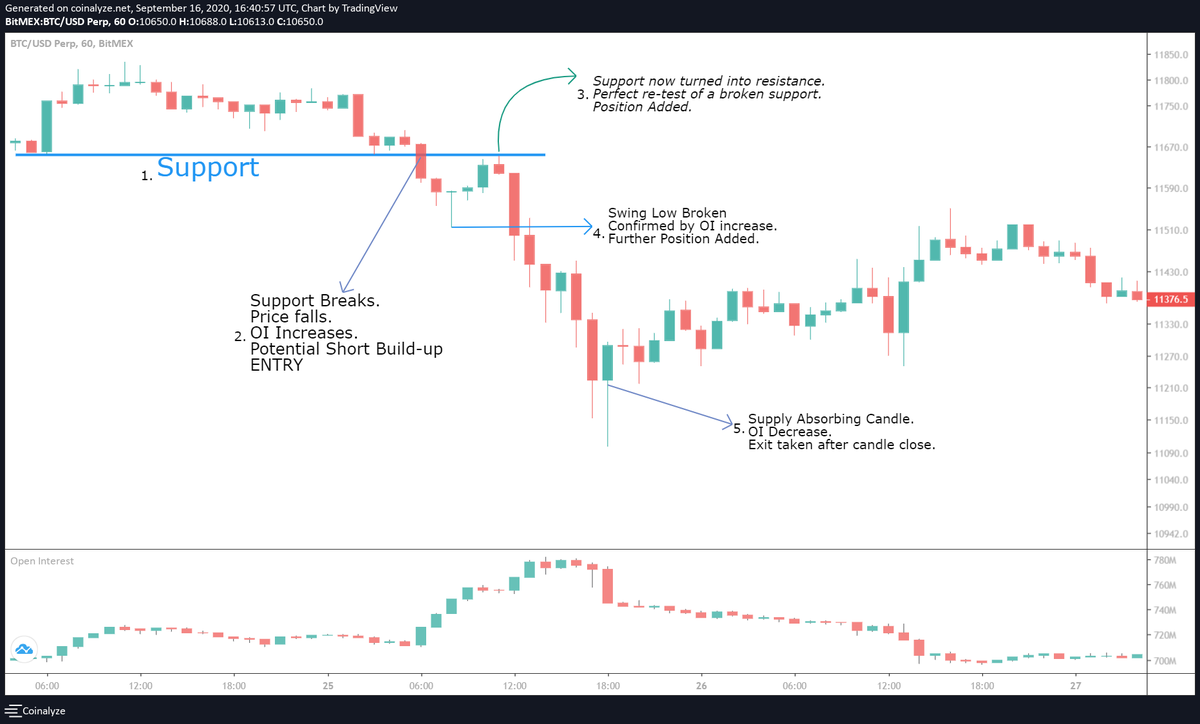
Short Build-up Explained in 1 chart.
1. Short Build up.
2. Support break.
3. Retest of support invalidation.
4. Short entry with OI confirmation.
5. Position addition.
6. Exit with Supply absorbing candle.
1. Short Build up.
2. Support break.
3. Retest of support invalidation.
4. Short entry with OI confirmation.
5. Position addition.
6. Exit with Supply absorbing candle.
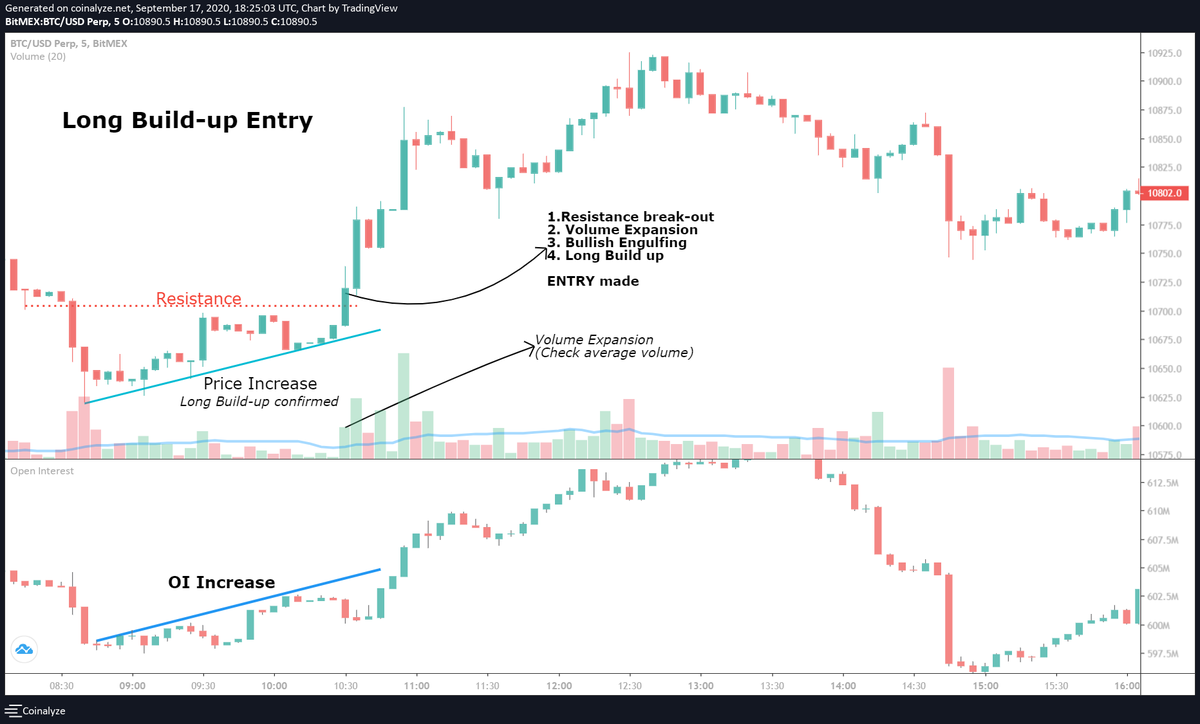
Long Build-up Explained in 1 chart.
1. Long Build
2. Resistance break
3. Volume Expansion
4. OI Confirmation
Study this in detail, how OI confirms a long using OI.
1. Long Build
2. Resistance break
3. Volume Expansion
4. OI Confirmation
Study this in detail, how OI confirms a long using OI.
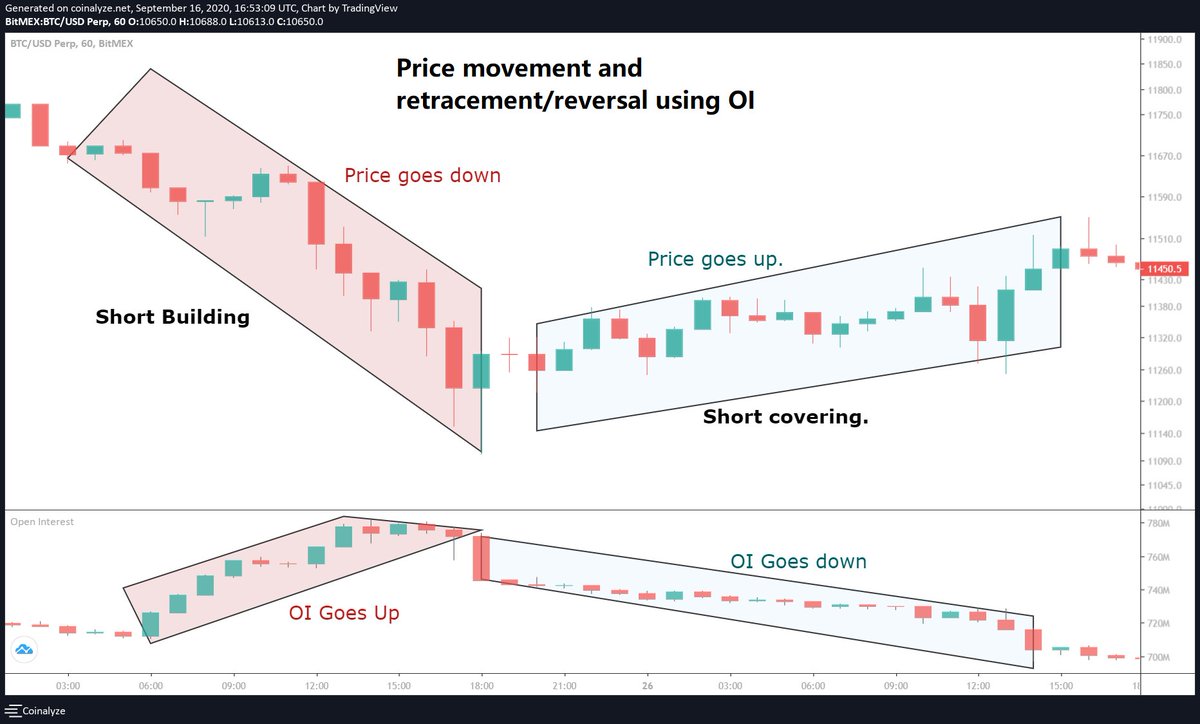
Let& #39;s look at price movement and how it& #39;s indicated by OI.
Here we see a clear Short buildup, where price Decreases while OI increases.
When the target for a short entry is achieved, the bigger players exit their contracts, leading to a reduction in OI and relief bounce.
Here we see a clear Short buildup, where price Decreases while OI increases.
When the target for a short entry is achieved, the bigger players exit their contracts, leading to a reduction in OI and relief bounce.
Avoiding false reversals.
Reversal points are used to enter a swing trade.
However, many traders get trapped in a FALSE reversal.
Here is an example to a voice a false reversal using OI.
Reversal points are used to enter a swing trade.
However, many traders get trapped in a FALSE reversal.
Here is an example to a voice a false reversal using OI.
Open interest is the most important day trading tool.
Many traders don& #39;t understand it enough.
This thread is all you need.
Read it multiple times, practice it on live charts.
Share and leave a like if this was helpful.
Will continue to make more detailed threads.
EmperorBTC
Many traders don& #39;t understand it enough.
This thread is all you need.
Read it multiple times, practice it on live charts.
Share and leave a like if this was helpful.
Will continue to make more detailed threads.
EmperorBTC

 Read on Twitter