Thread on a few on-chain Bitcoin charts. Data sourced from @coinmetrics.
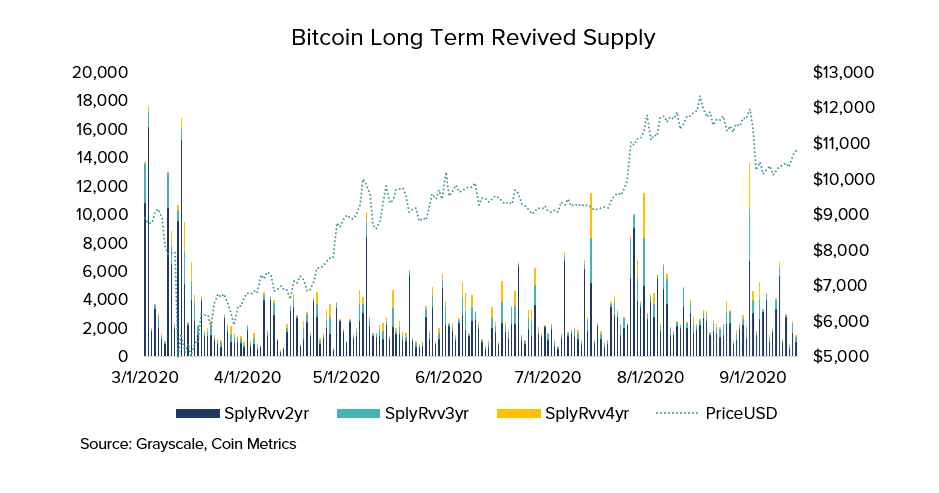
To start September, there was a spike in older revived supply - coins that had not moved in a long time. Note the spike in March for comparison.
To start September, there was a spike in older revived supply - coins that had not moved in a long time. Note the spike in March for comparison.
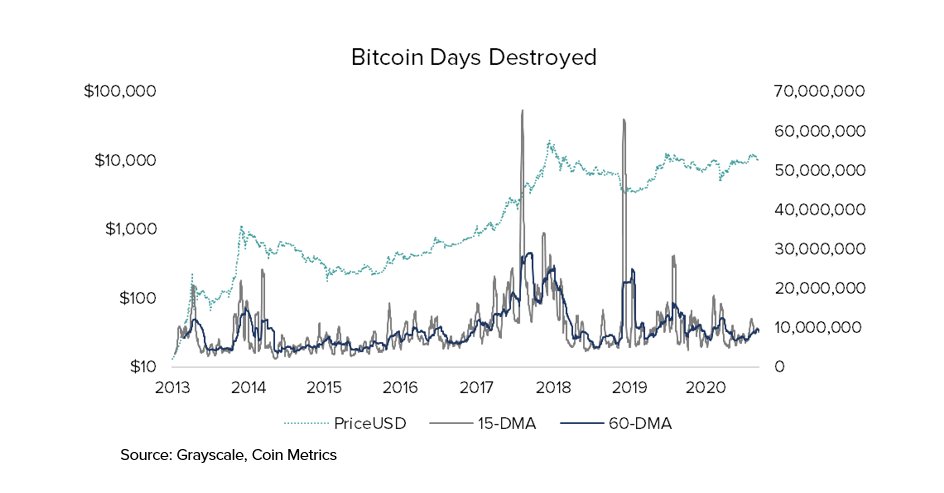
We can zoom out and cut the same data in a different way. The increase in Bitcoin Days Destroyed is barely a blip on the radar relative to historical data.
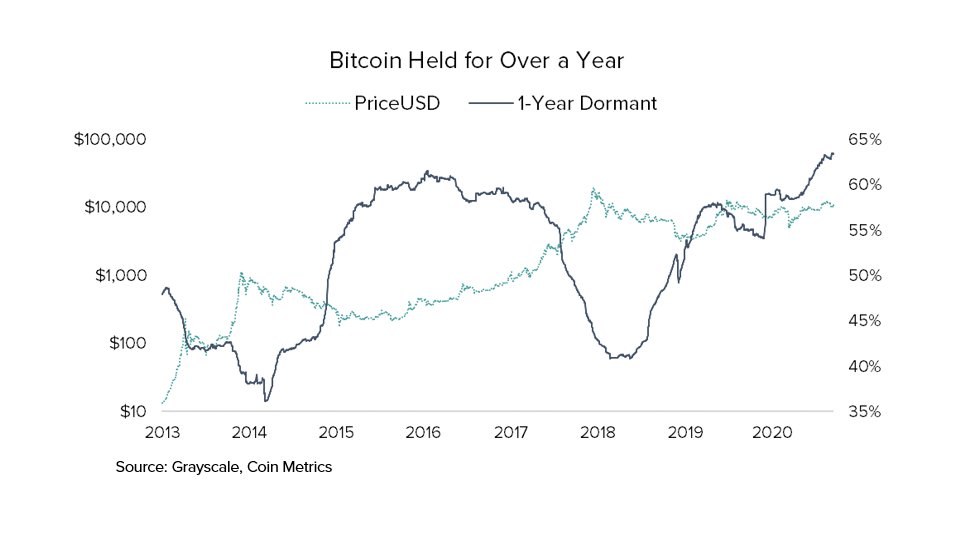
Bitcoin held for over a year continues to make new highs. Only about 36% of Bitcoin supply has moved in the last year.
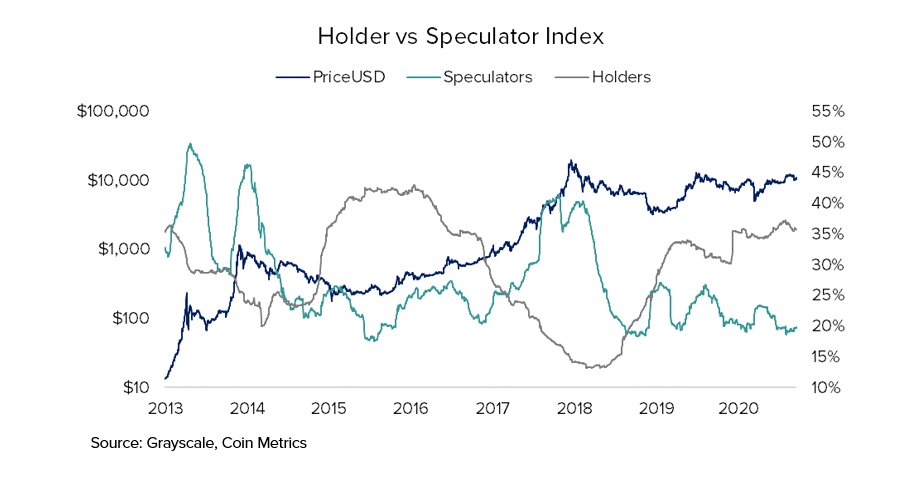
More detail on these metrics can be found in the @Grayscale Valuing Bitcoin report. https://grayscale.co/insights/valuing-bitcoin/">https://grayscale.co/insights/...

 Read on Twitter


