A thread on GDP:
Recently you should have witnessed everyone talking about India& #39;s GDP contraction in news, social media, etc.,
Today I will try to explain GDP in a simple way. Grab a bowl of Maggi noodles and let& #39;s get started
Recently you should have witnessed everyone talking about India& #39;s GDP contraction in news, social media, etc.,
Today I will try to explain GDP in a simple way. Grab a bowl of Maggi noodles and let& #39;s get started
You measure distance in miles, you measure time in seconds and you measure an economy in GDP terms.
The full form is Gross domestic product. Basically, what it tells you is the & #39;total market value of all the finished goods & services produced within a country for a period& #39;
The full form is Gross domestic product. Basically, what it tells you is the & #39;total market value of all the finished goods & services produced within a country for a period& #39;
How do we calculate such a number? The approach is simple. We calculate it using consumption, investment, government expenditure, exports, and imports data.
The formula is C + I + G + NX = GDP
The formula is C + I + G + NX = GDP
C = Consumers expenditure
I = Businesses capital expenditure
G = Government expenditure
NX = Net exports
Now as u can see since we add expenditures of consumers, businesses, government to calculate GDP, this method is named as expenditure approach
I = Businesses capital expenditure
G = Government expenditure
NX = Net exports
Now as u can see since we add expenditures of consumers, businesses, government to calculate GDP, this method is named as expenditure approach
To give you a rough idea,
•The consumers spend on cars, ACs, mobile phones, etc.,
•The businesses spend on plant & machinery, furniture, etc.,
•The government spend on infrastructure, payroll, equipment, etc.,
•And then net exports (Exports - imports)
•The consumers spend on cars, ACs, mobile phones, etc.,
•The businesses spend on plant & machinery, furniture, etc.,
•The government spend on infrastructure, payroll, equipment, etc.,
•And then net exports (Exports - imports)
Besides all this, there is one crucial point to be noted. Think for a second, if we increase our prices by 100% in a year, our GDP also gets increased by 100%. To solve this concern, we use real GDP growth (adjusted for price increases aka inflation)
Now, let& #39;s move on to the real data published & have a look at it
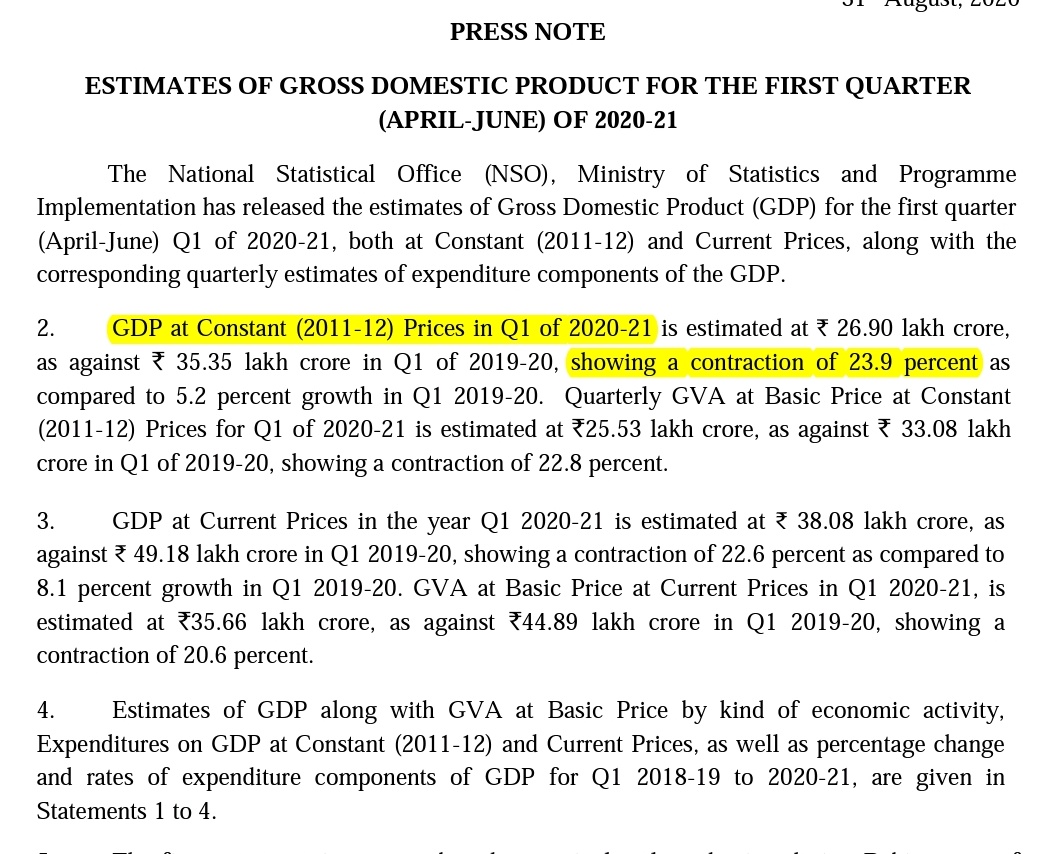
In the above image, it says that GDP at constant prices contracted by 23.9%. Constant prices adjust for inflation whereas current prices don& #39;t adjust for inflation. They collect data from various sources & calculate them.
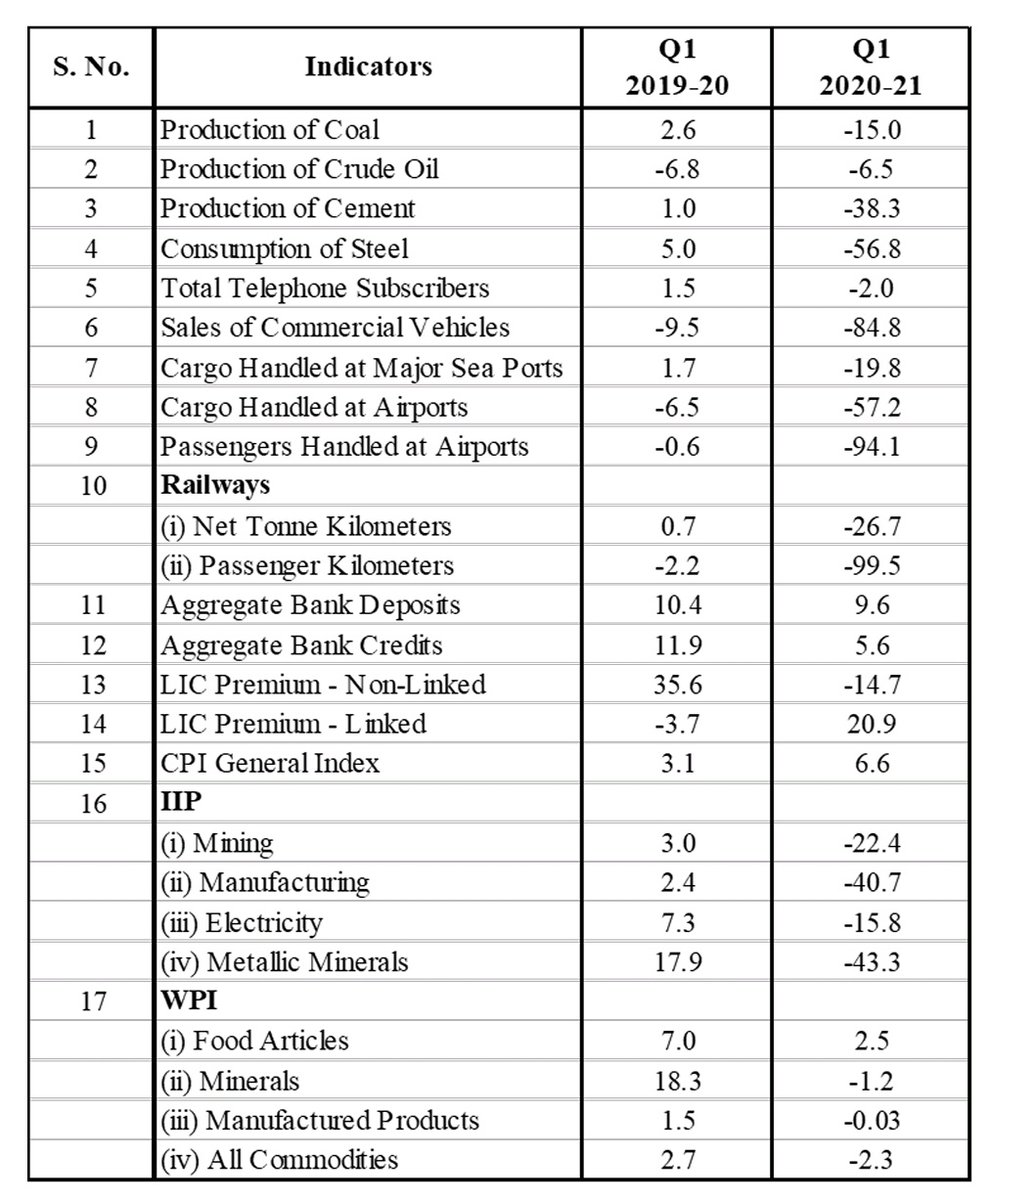
Next, the document provides a percentage change in the main indicators like coal production, sale of commercial vehicles, airports data, cement production, bank deposits, LIC premiums, etc.
Main observations:
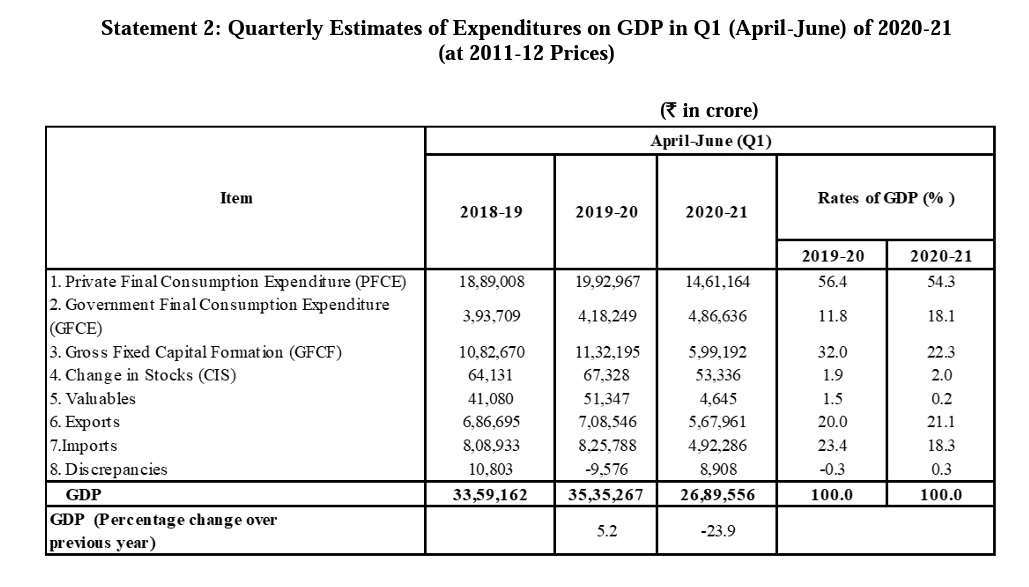
•Consumption forms a major part of GDP around 54% & declined by 27% during the quarter
•Gross fixed assets formation declined by 45%
•Govt expenditure increased by 16%
•Consumption forms a major part of GDP around 54% & declined by 27% during the quarter
•Gross fixed assets formation declined by 45%
•Govt expenditure increased by 16%
•Change in stocks, valuables form only a small portion of GDP
•We got net exports of INR 75,675 crores which haven& #39;t happened in previous periods
•Finally at the end, we find percentage change in GDP is 23.9% that appeared in headlines everywhere
•We got net exports of INR 75,675 crores which haven& #39;t happened in previous periods
•Finally at the end, we find percentage change in GDP is 23.9% that appeared in headlines everywhere
Besides this, you get sectoral data of 8 major industries & % change. You can get the next release of GDP data on the PIB website and at that time, try to do an analysis on your own.
That& #39;s it, folks. Like & retweet, if u find the thread value-added. Have a great day.
That& #39;s it, folks. Like & retweet, if u find the thread value-added. Have a great day.
Request you to have a look at the thread
@Vivek_Investor @dmuthuk @FinMedium @finbloggers @stocktalk_in @Dinesh_Sairam @FI_InvestIndia @EWFA_ @deepakshenoy @varinder_bansal @AdeParimal @adi2five @gvkreddi @MashraniVivek @ms89_meet @RichifyMeClub @Prashanth_Krish @datta_arvind
@Vivek_Investor @dmuthuk @FinMedium @finbloggers @stocktalk_in @Dinesh_Sairam @FI_InvestIndia @EWFA_ @deepakshenoy @varinder_bansal @AdeParimal @adi2five @gvkreddi @MashraniVivek @ms89_meet @RichifyMeClub @Prashanth_Krish @datta_arvind

 Read on Twitter


