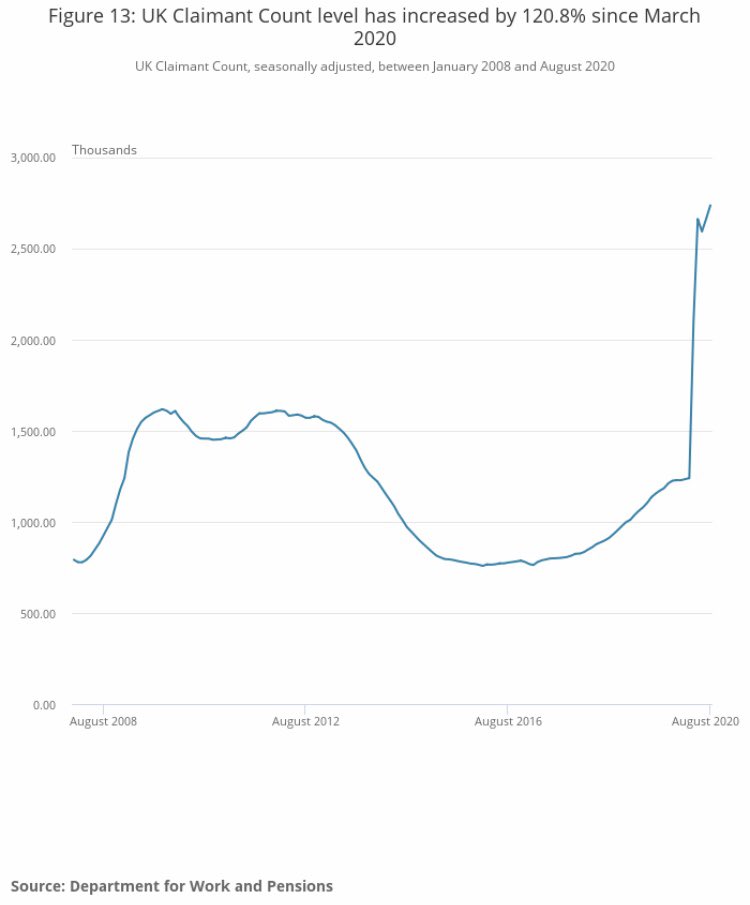
A lot of papers reporting the headline figure of 695k lost jobs since March 2020 from the ONS, but a couple of other graphs to note in the recent release (link attached too for anyone who enjoys reading unemployment reports on a Tuesday morning)
https://www.ons.gov.uk/employmentandlabourmarket/peopleinwork/employmentandemployeetypes/bulletins/employmentintheuk/september2020">https://www.ons.gov.uk/employmen...
https://www.ons.gov.uk/employmentandlabourmarket/peopleinwork/employmentandemployeetypes/bulletins/employmentintheuk/september2020">https://www.ons.gov.uk/employmen...
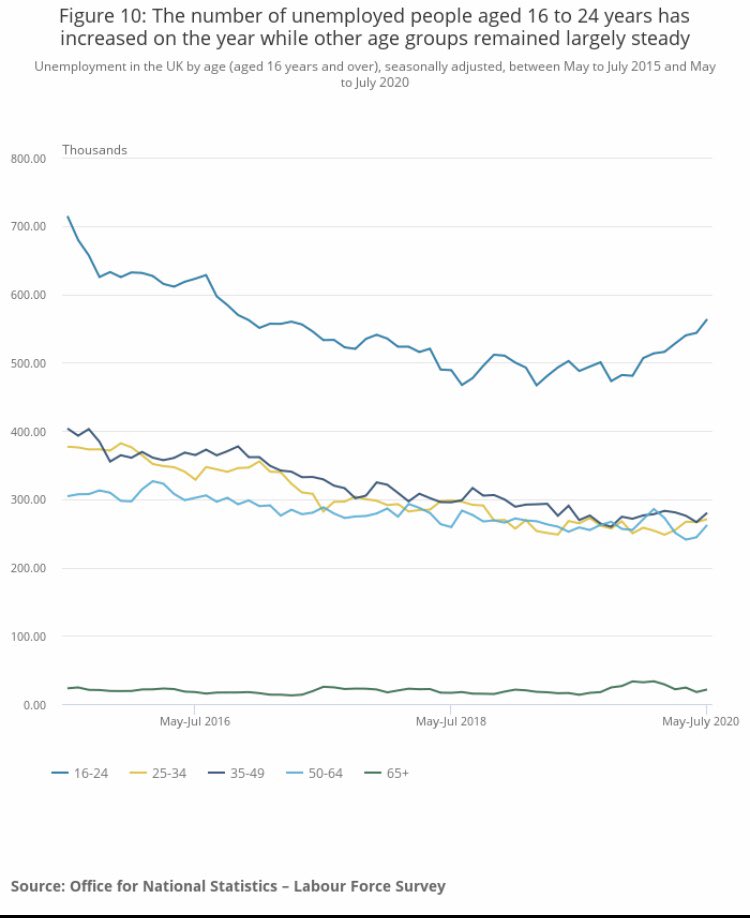
1. We’re not all in the same boat - 16-24 have seen a material uptick in unemployment vs other age groups. This is likely a reflection of younger people occupying retail/hospitality sectors, one of the most structurally hit areas. It also explains the gov’s ‘Kickstart’ policy.
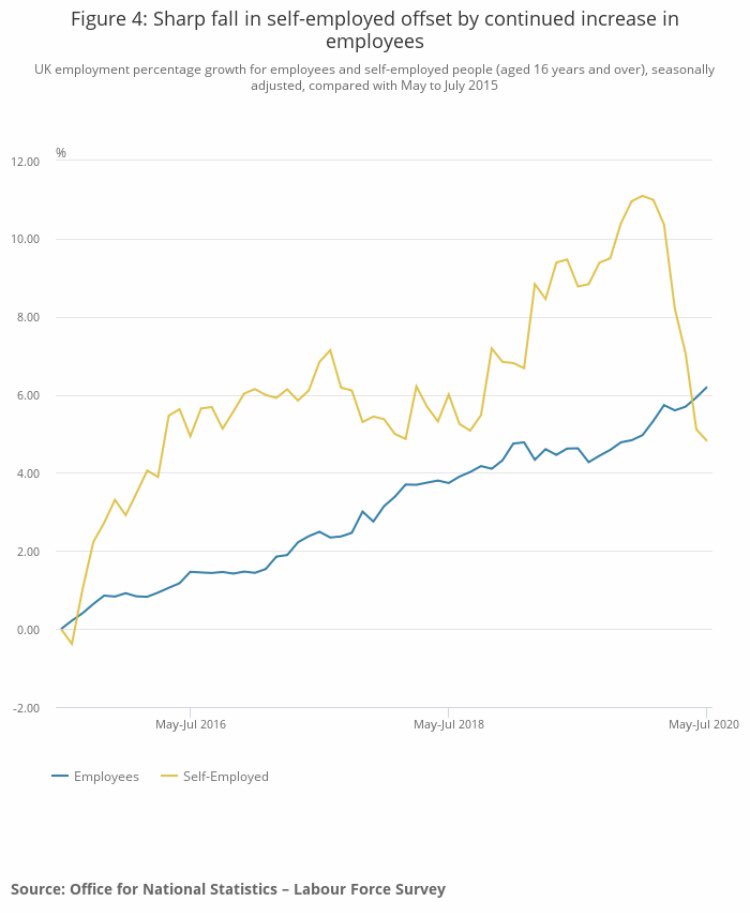
2. The entrepreneurial landscape of the U.K. hasn’t traditionally performed vs its international peers and the pandemic has exacerbated moves back into employment- out of self employment, this makes sense as a flight to safety and hence the number of ‘employees’ steadily rising

 Read on Twitter


