Registered vehicles on UK roads:
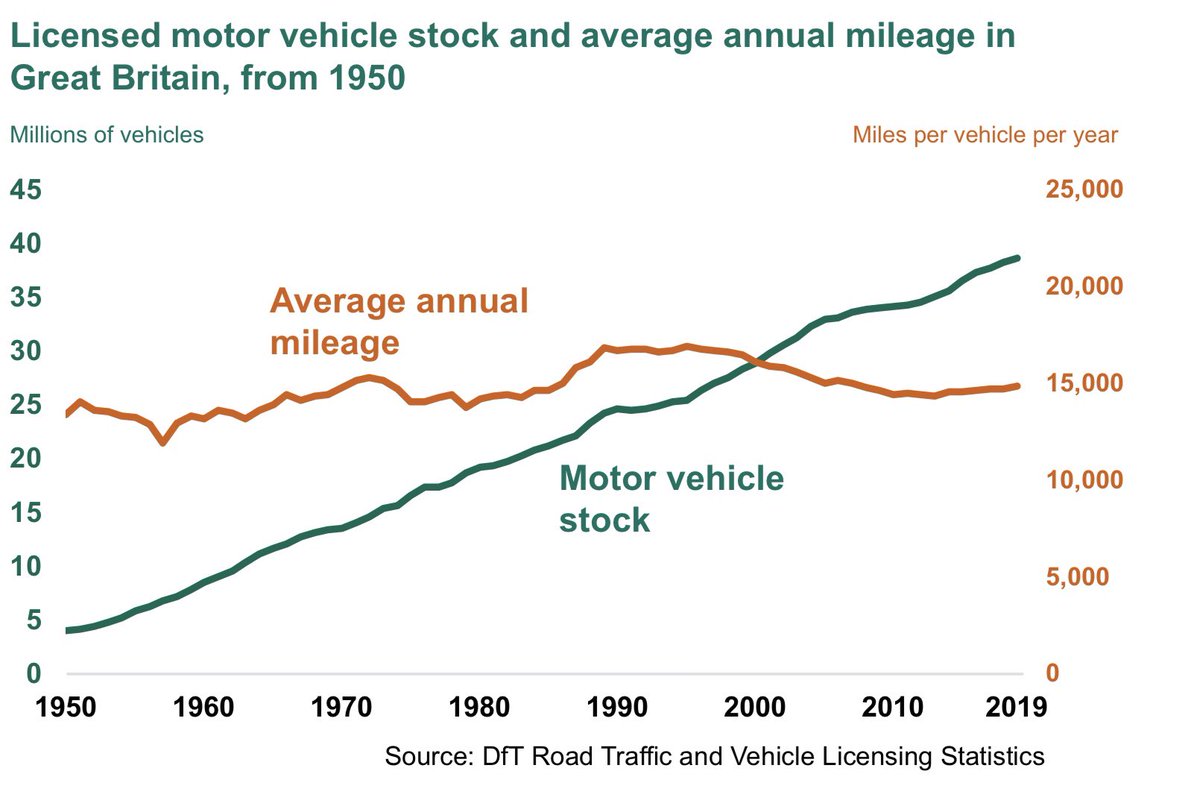
1991: 20 million
2007: 27 million
2016: 37 million
2020: 38.3 million
(2022: 40 million)
Congestion is caused — and air pollution is made worse — not by cycleways, but by too many motor vehicles.
1991: 20 million
2007: 27 million
2016: 37 million
2020: 38.3 million
(2022: 40 million)
Congestion is caused — and air pollution is made worse — not by cycleways, but by too many motor vehicles.
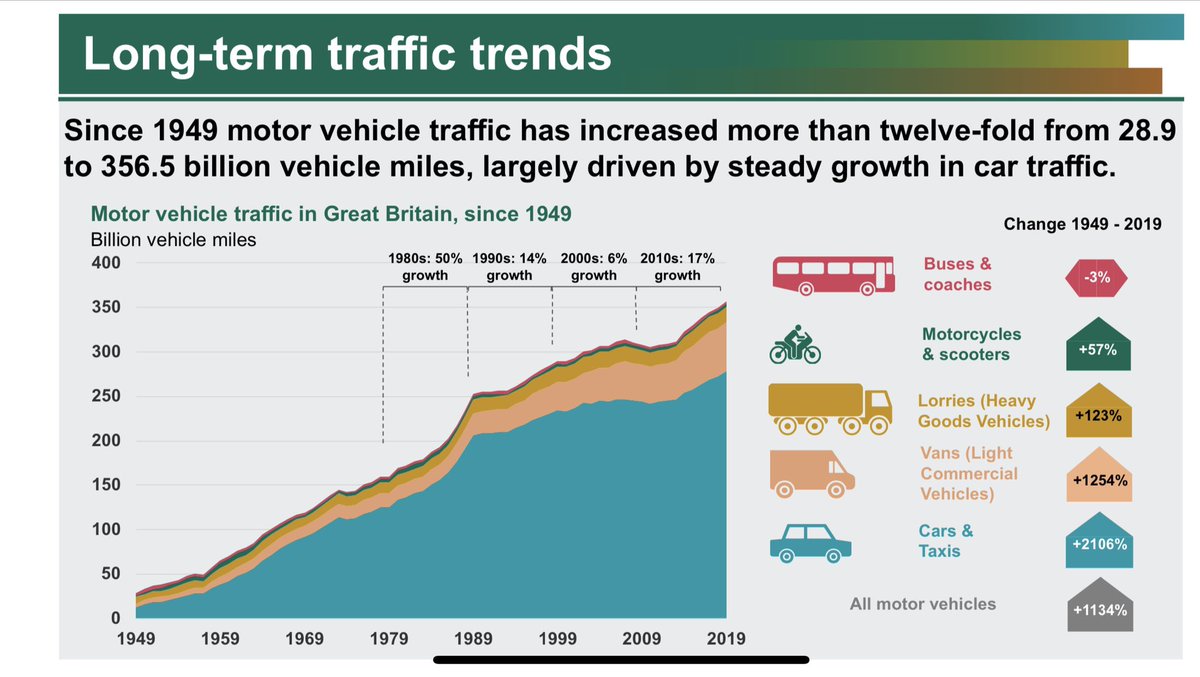
Here, in graph form, is the point I was making earlier about the actual cause of congestion: it’s an excess of motor vehicles, not a few cycleways. Source: @DfTstats issued today. https://assets.publishing.service.gov.uk/government/uploads/system/uploads/attachment_data/file/916496/road-traffic-estimates-in-great-britain-2019.pdf">https://assets.publishing.service.gov.uk/governmen...
Since 1949, miles travelled by motor vehicles has increased twelvefold. Our roads can’t take that many cars, vans and trucks (and building new urban roads is out of the question in most towns and cities, and they would fill to capacity anyway).
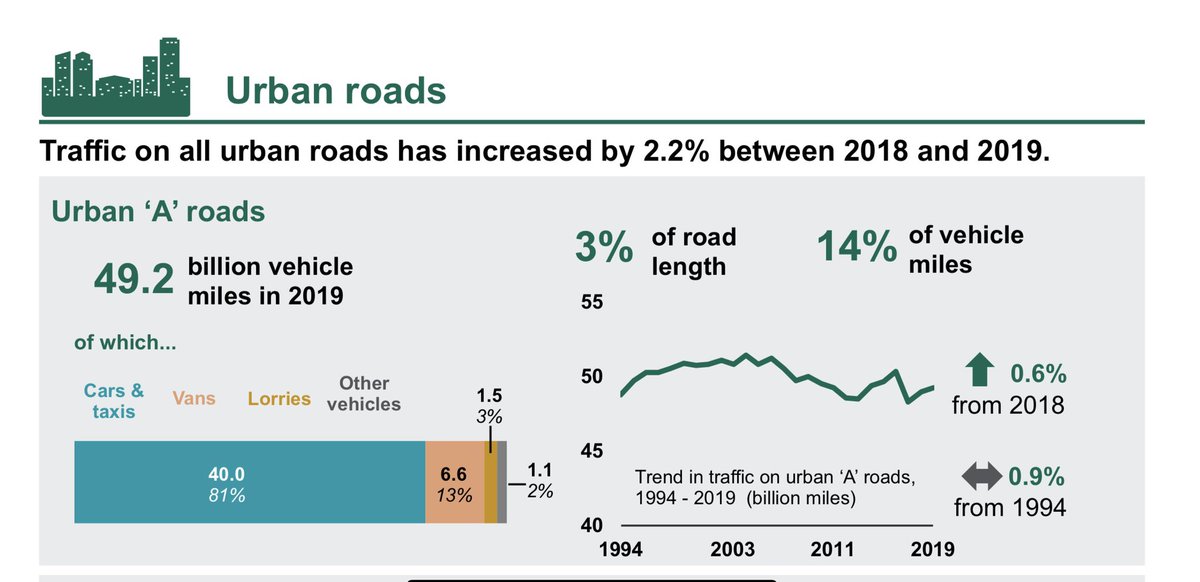
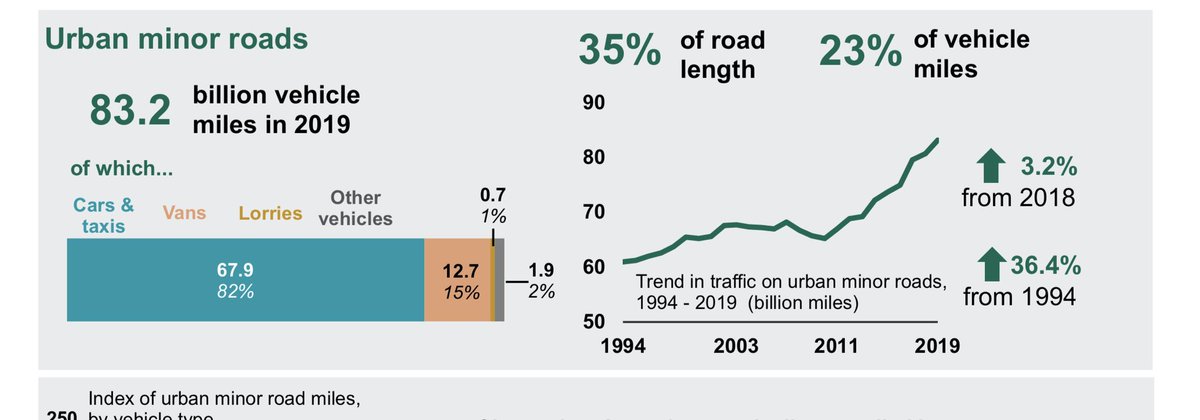
And urban minor roads — residential areas, then — have seen an increase in motor traffic of 36.4% since 1994. LTNs aim to reduce the increasingly painful scourge of such rat-running.
And note how, on average, rat-running by motorists is up by more than 3% in just one year. That’s intolerable, especially as in some areas it will be much higher than this.
I’m not pulling these shocking stats out of thin air. They are contained in new @DfTstats publication, issued today. https://assets.publishing.service.gov.uk/government/uploads/system/uploads/attachment_data/file/916496/road-traffic-estimates-in-great-britain-2019.pdf">https://assets.publishing.service.gov.uk/governmen...

 Read on Twitter


