Most traders make decisions w/out *effective* context. This leads to reactive emotion-driven actions which result in buying tops & selling bottoms.
Here’s what we can learn from a former Delta Force Commander on how to make better decisions & not get bucked by trends.Thread..1/
Here’s what we can learn from a former Delta Force Commander on how to make better decisions & not get bucked by trends.Thread..1/
2/ In the final days of “Stress Phase” (the last test to gain entrance into Delta Force) Peter Blaber was 15hrs into a maneuver. He was tired, delirious, and lost in the mountains of VA when he was “forced” to run at full speed and jump off a cliff…
3/ Blaber, in his discombobulated state, thought he was being chased by an angry Black Bear. It was only after tumbling hundreds of feet (losing his map & flashlight) that he looked back up to the cliff’s edge, and realized it was just a pig.
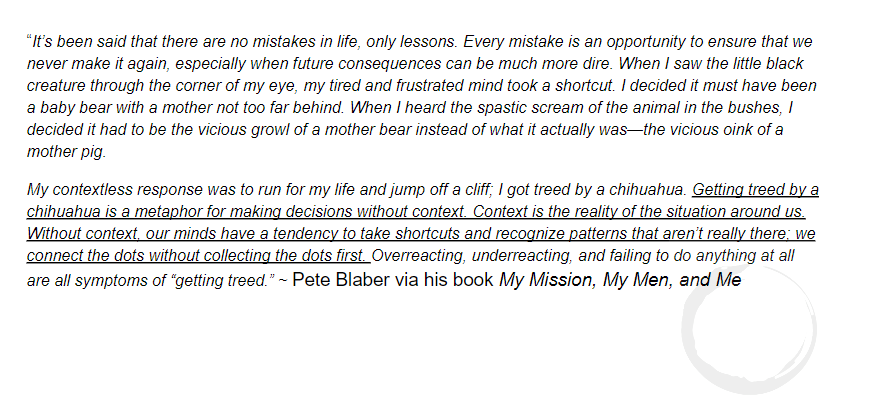
Here’s Blaber on what he learned.
Here’s Blaber on what he learned.
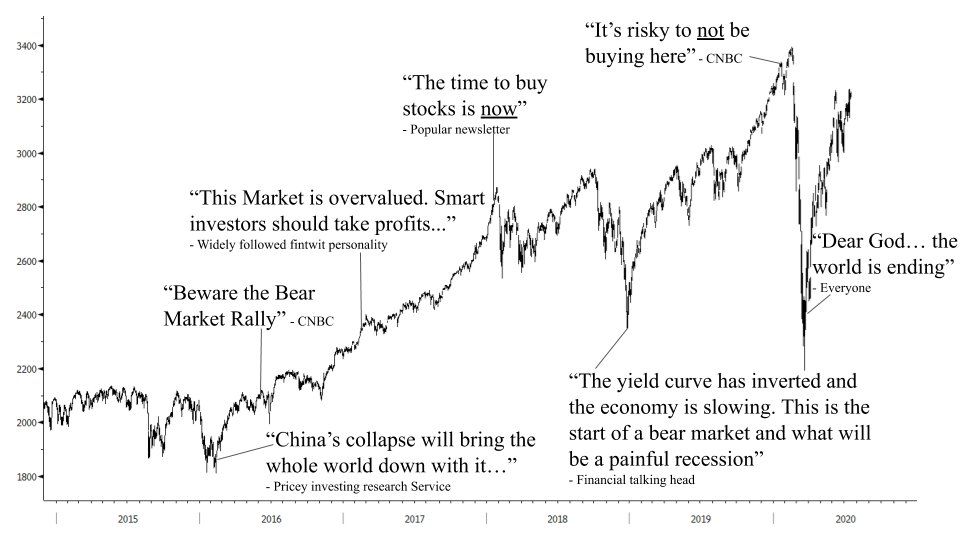
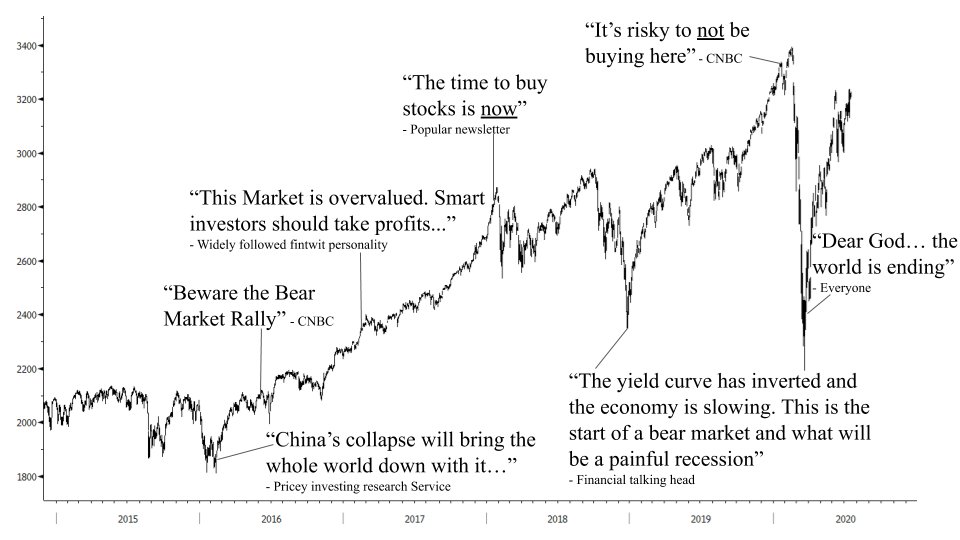
4/ Like Blaber, traders & investors get “treed by chihuahua’s” ALL the time… They make biased decisions from points of emotion such as fear and greed. As a result, they have a tendency “to recognize patterns that aren’t really there”. Countless examples below....
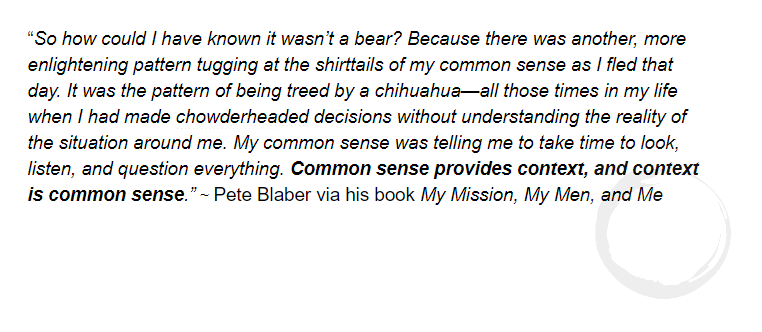
5/ This is due to our cognitive wiring (1) Our brains operate on pattern recognition & prefer simple linear answers & (2) Information overload results in cognitive tunneling, especially when emotions such as fear & greed run hot. Luckily, we can overcome this. Here’s Blaber again
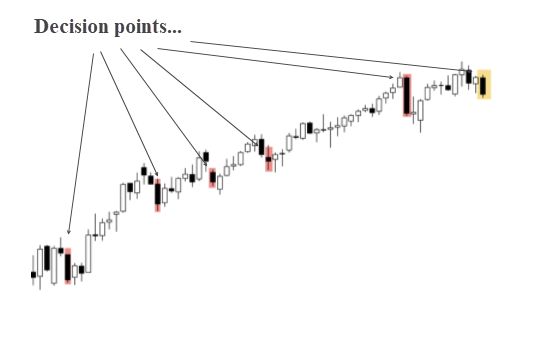
6/ In markets, *effective* context is invaluable and a well-tested process is essential to consistently make +EV decisions over the long haul. Because, as market participants, we’re faced with countless decision points along a trend & these open us up to costly mistakes...
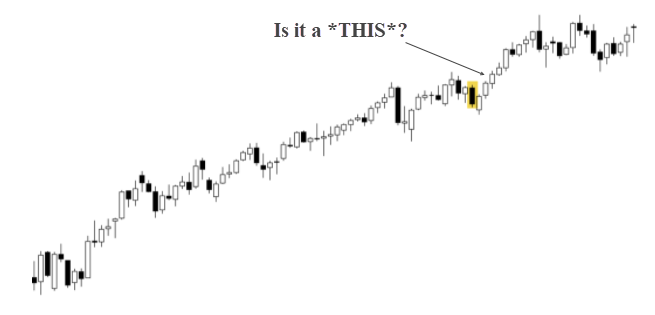
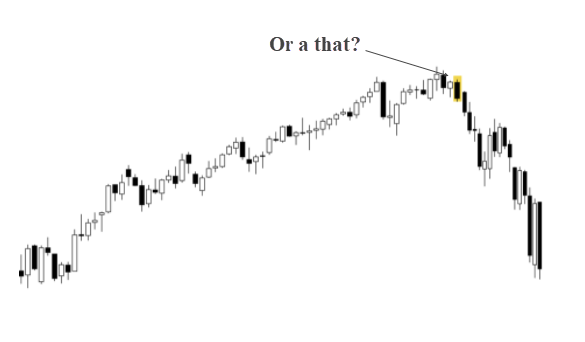
7/ At these points we have to decide whether a dip is a *THIS* or a *THAT*. Most sit on the sidelines for the meat of a trend. They console themselves with ALL the reasons why the trend will end and they expect every dip to be the BIG one but 80% of dips in trends get bought
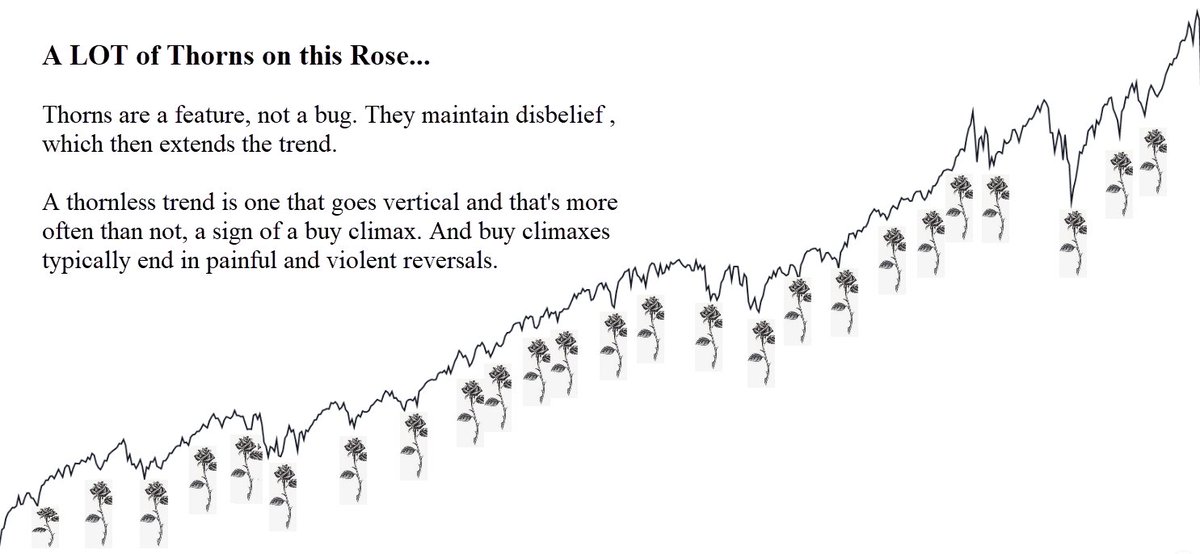
8/ The oscillations, the dips, the volatility along the way are the price the player pays to ride out a big trend. A trend is like a rose. Its dips are thorns. These thorns are a feature, not a bug. Experienced traders know a thorn is an opportunity to enter or add to a position.
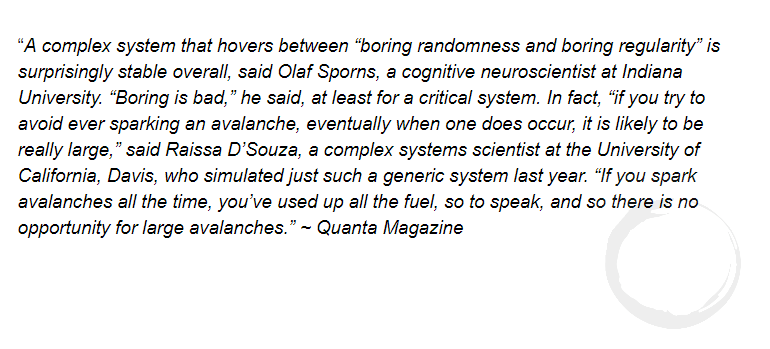
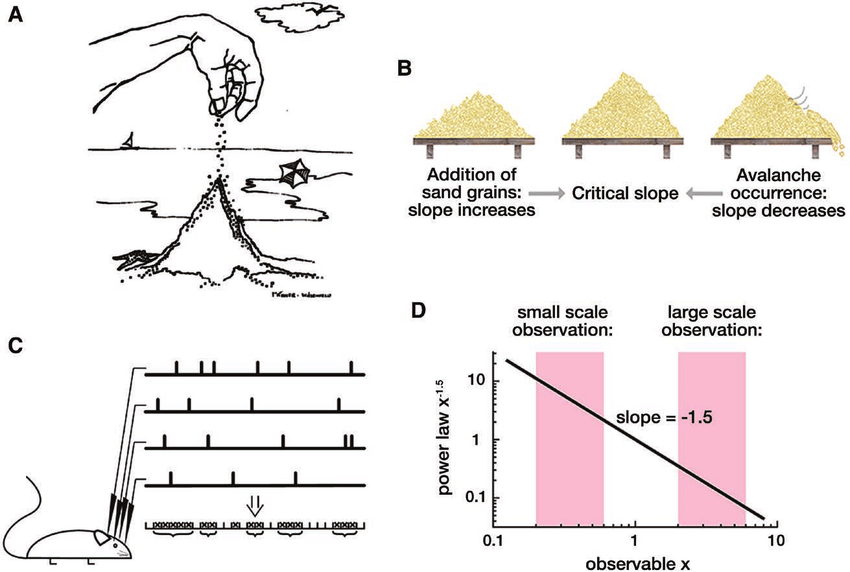
9/ Thorns perpetuate disbelief in the trend. They keep positioning/sentiment from reaching a point of criticality that = trend fragility & raises the odds of a full-blown phase-shift (reversal). This is true for all complex systems as noted by Quanta.
10/ Frequent dips prevent major selloffs & lengthen the duration of a trend. Knowing this, your process should *exploit* & harvest the positive function of thorns and NOT let them shake you out of position. To do this, you NEED a framework that gives you *effective* context.
11/ At MO we use the Trifecta Lens, which is a 3-part decision tree that operates off simple {if this, then that} conditional statements to quantify key breadth, liquidity, and sentiment indicators in order to give us objective points of context.
12/ It’s comprised of (1) a Setup (2) Conditions and (3) a Trigger. A Setup is a technical point on a chart. In physics terms, it would be called the critical point. The zone at which a complex system sits between order and disorder.
13/ If our Setup is a measure of frequency then Conditions are a measure of the potential amplitude or the overall fragility of the trend at that point in time. They give the probabilities for a phase-shift. A reversal of trend...
14/ A Trigger is simply a setup bar that leads to an action; an entry, exit, add to, or reduction of a position. It’s an additional and critical contextual point that precedes a trading action (ie, bearish follow-through after price hits the lower BB the previous day).
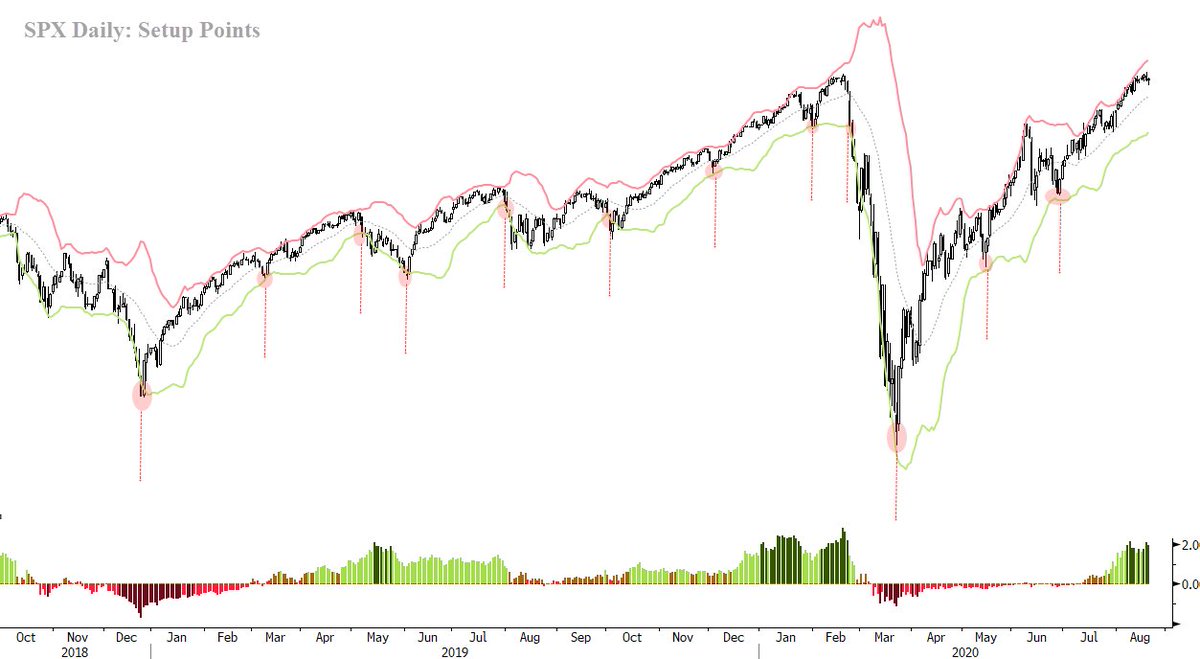
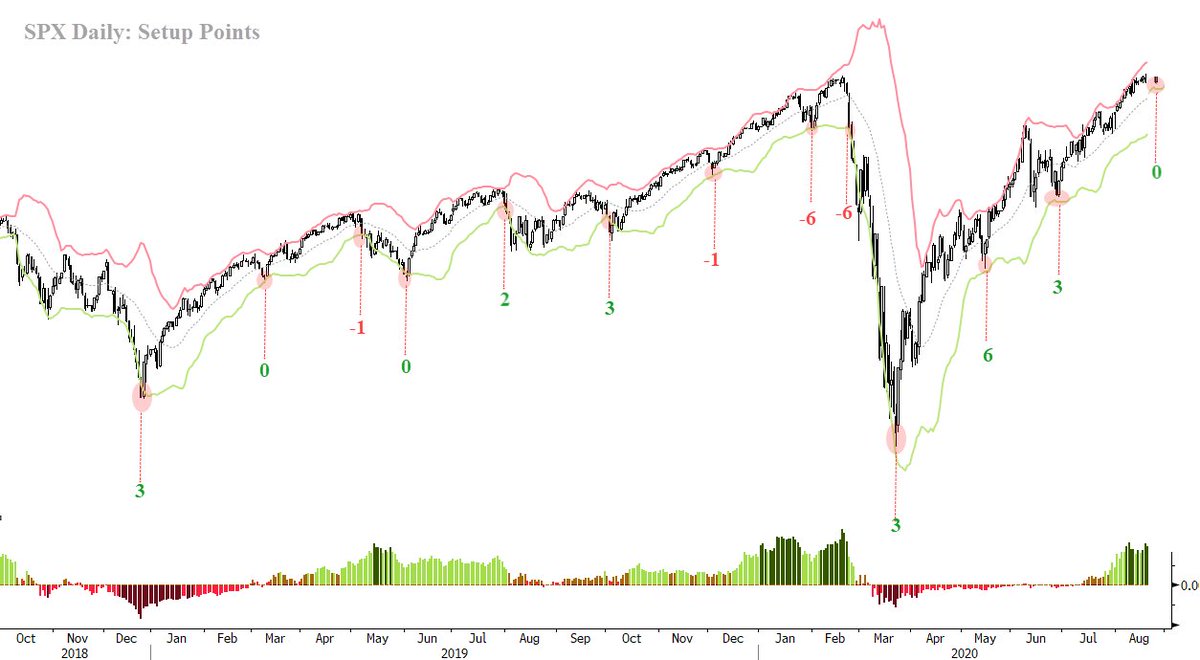
15/ Here’s a chart showing the decision points or Setups on the $SPY over the last 2-years (setups highlighted in red).
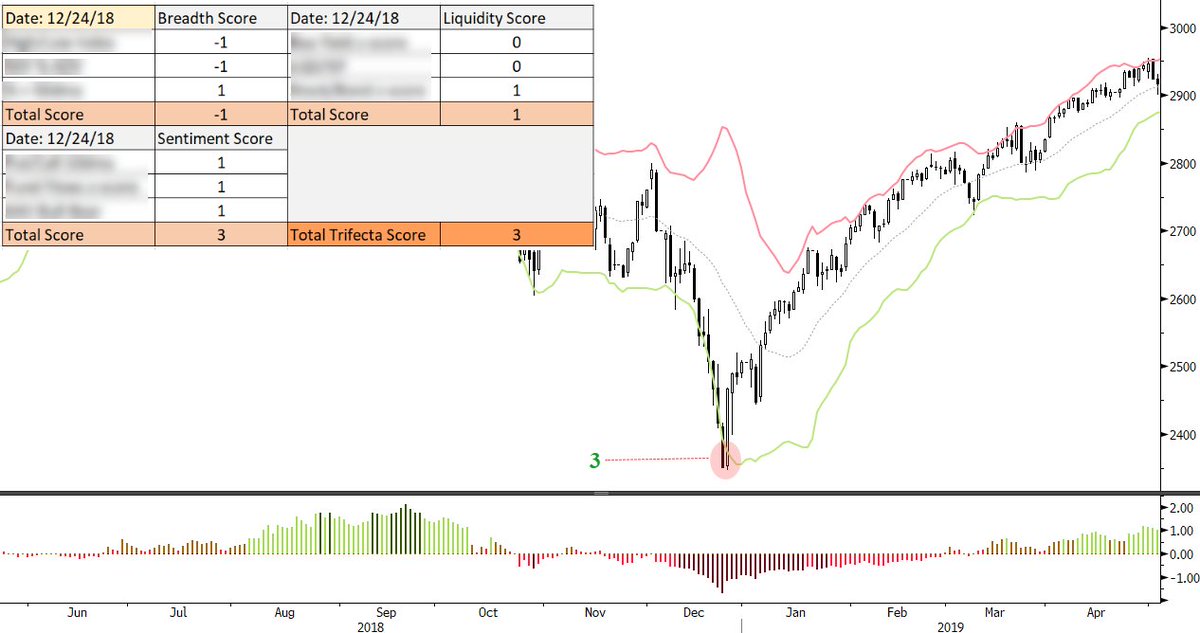
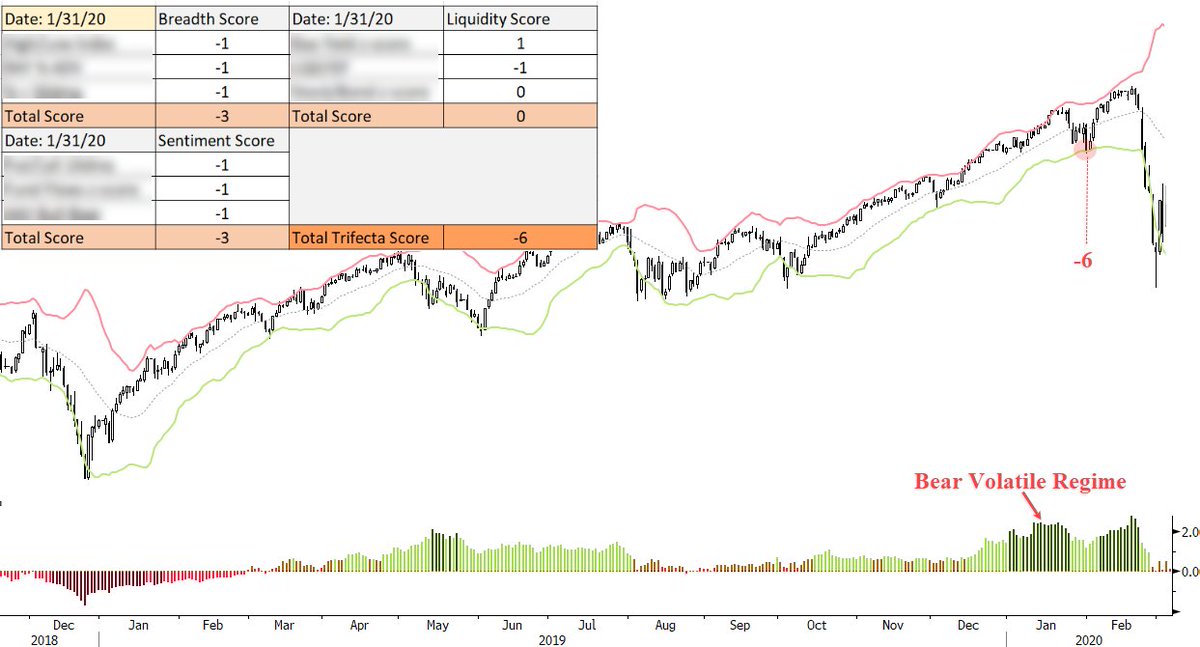
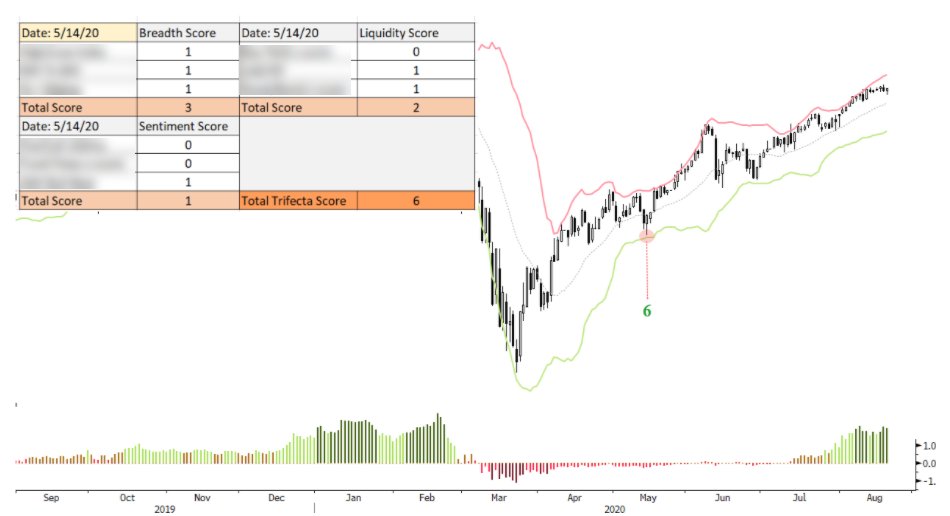
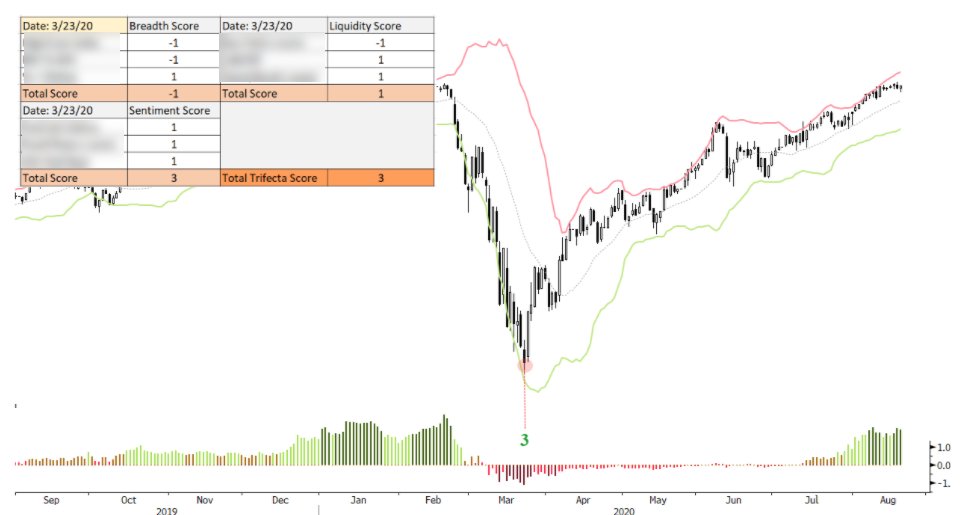
16/ We add the Breadth, Liquidity, and Sentiment scores together once a Setup point has been observed. The cumulative points give us a final score which ranges from -9 to +9 (-9 being extremely bearish and +9 very bullish).
17/ Here’s the TL Scores for each Setup. Notice the extreme bearish readings of -6 in late Feb 20’. This was effective context that said it was time to start reducing risk. The Feb 24th trigger was the signal to go short. Conversely, notice the + readings following the March low
18/ This is just one way to codify a framework for building context. The exact details aren’t important but the entirety of the framework (breadth, liquidity, tape) is. Example, all those who’ve been calling for caution the last 2+ months bc Put/Call ratios were stretched…
19/ Having more disparate but complementary data points gave one more valuable context. Single data points often = confirmation bias while a tested holistic framework = effective context.
20/ Risk aversion and fear of the unknown are direct symptoms of a lack of context and are the polar opposites of audacity. ~ Pete Blaber.
Here’s the full article I wrote on the subject for those of you who’d like to learn more https://macro-ops.com/how-to-stay-in-a-trend-and-not-get-treed-by-a-chihuahua/
/Fin">https://macro-ops.com/how-to-st...
Here’s the full article I wrote on the subject for those of you who’d like to learn more https://macro-ops.com/how-to-stay-in-a-trend-and-not-get-treed-by-a-chihuahua/
/Fin">https://macro-ops.com/how-to-st...

 Read on Twitter