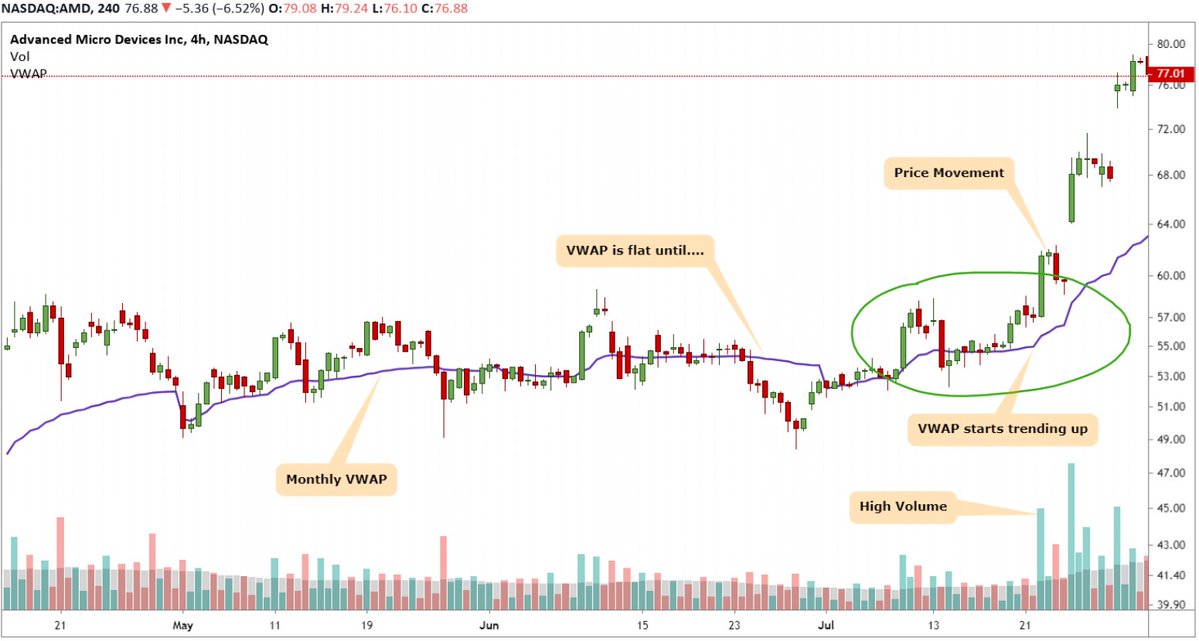
The Volume Weighted Average Price (VWAP) is a reference line you can place on your chart based on a combination of price and volume. Unlike price-only Simple Moving Averages (MA), it changes direction when price movement has volume behind it.
This is the best non-mathematical way to look at the VWAP:
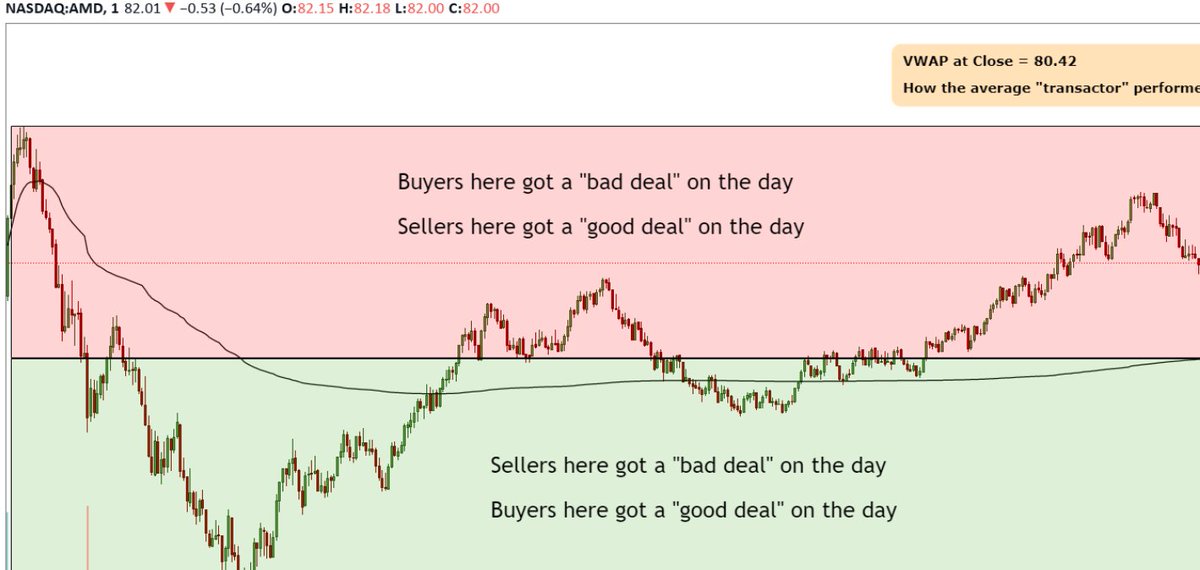
"Draw the VWAP across any duration of time.....if you sold above it, you got a better deal than the average sellers...if you bought below it, you get a better deal than the average buyer"
$AMD intraday example
"Draw the VWAP across any duration of time.....if you sold above it, you got a better deal than the average sellers...if you bought below it, you get a better deal than the average buyer"
$AMD intraday example
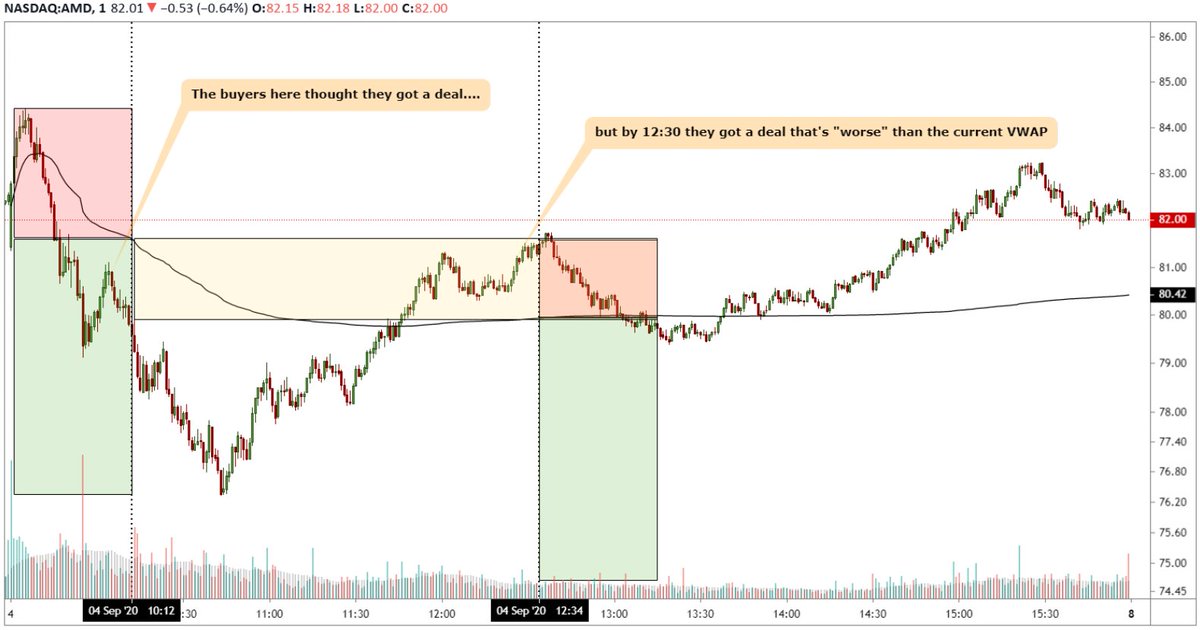
Now keep in mind, VWAP is evolving so don& #39;t fall in love with the hindsight perspective. In the $AMD chart below you can see, early morning 10 am buyers thought they got a deal but by noon and end of the day they were under-performers
So the most common way VWAP is used by institutional traders is as a yardstick of their "selling" / "buying" performance.
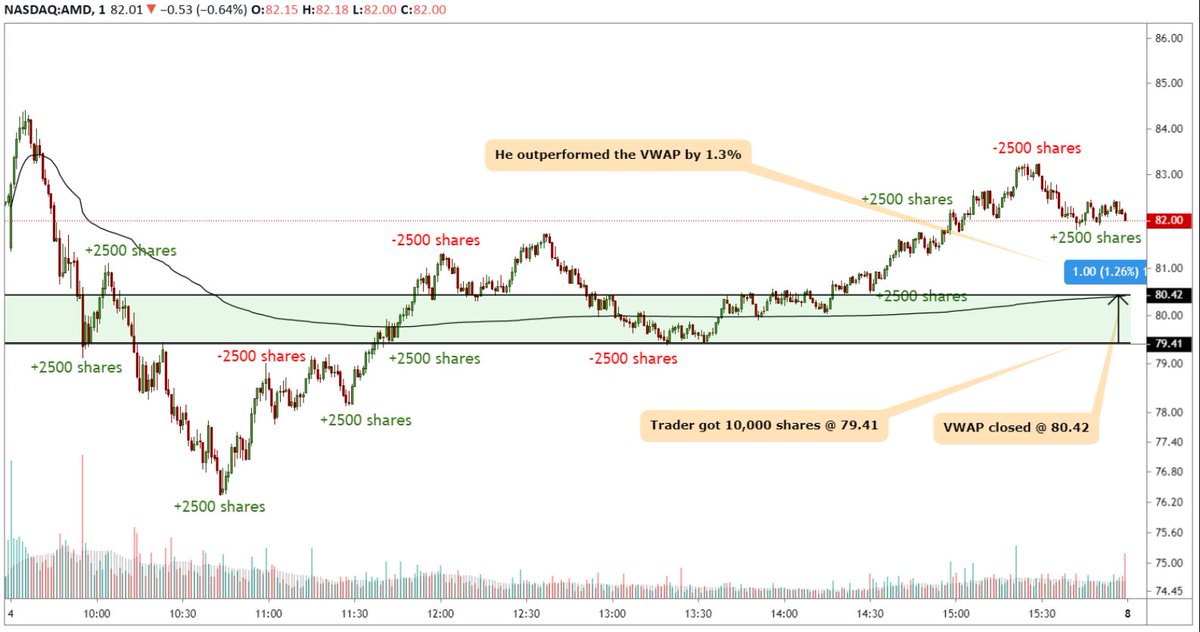
Let& #39;s say a trader was to buy 1,000 shares of $AMD on this day, here is a theoretical performance relative to the VWAP at the day& #39;s close..his report card
Let& #39;s say a trader was to buy 1,000 shares of $AMD on this day, here is a theoretical performance relative to the VWAP at the day& #39;s close..his report card
You can extend this concept across any time frame...a trader may have the task of accumulating or distributing a position across a week, month or quarter even
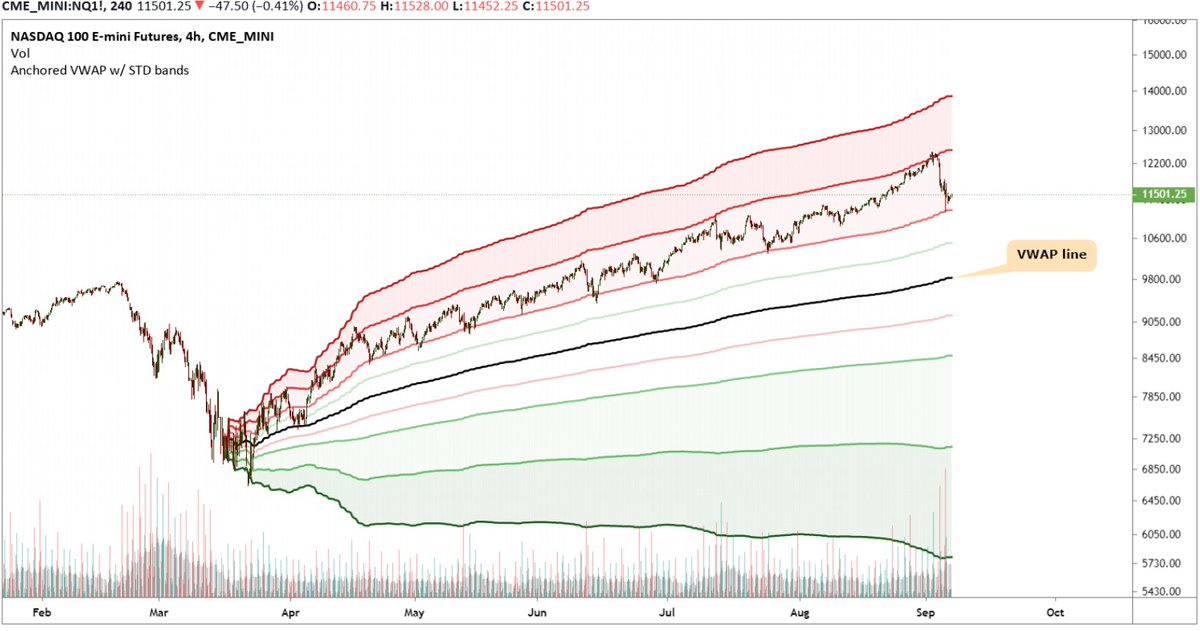
VWAPs can even be anchored to a special trigger event, here& #39;s one anchored to rate cut to 0% by the Federal Reserve
VWAPs can even be anchored to a special trigger event, here& #39;s one anchored to rate cut to 0% by the Federal Reserve
Next up, we& #39;ll look at VWAP bands and how to use the VWAP both a mean reversion and momentum type trade.
I gotta take the kids to practice for now https://abs.twimg.com/emoji/v2/... draggable="false" alt="⚽️" title="Fußball" aria-label="Emoji: Fußball">
I gotta take the kids to practice for now

 Read on Twitter
 Mom& #39;s VWAP Workshop Thread https://abs.twimg.com/emoji/v2/... draggable="false" alt="📔" title="Notizbuch mit verziertem Umschlag" aria-label="Emoji: Notizbuch mit verziertem Umschlag">The Volume Weighted Average Price (VWAP) is a reference line you can place on your chart based on a combination of price and volume. Unlike price-only Simple Moving Averages (MA), it changes direction when price movement has volume behind it." title="https://abs.twimg.com/emoji/v2/... draggable="false" alt="📔" title="Notizbuch mit verziertem Umschlag" aria-label="Emoji: Notizbuch mit verziertem Umschlag"> Mom& #39;s VWAP Workshop Thread https://abs.twimg.com/emoji/v2/... draggable="false" alt="📔" title="Notizbuch mit verziertem Umschlag" aria-label="Emoji: Notizbuch mit verziertem Umschlag">The Volume Weighted Average Price (VWAP) is a reference line you can place on your chart based on a combination of price and volume. Unlike price-only Simple Moving Averages (MA), it changes direction when price movement has volume behind it." class="img-responsive" style="max-width:100%;"/>
