To date, very few entities had #COVID19 "caseline" data. Most states give cases, hospitalizations and deaths in 3 SEPARATE files. A "caseline" file tells you if a SPECIFIC case was hospitalized and if they died.
Well now... we have the entire country!
1/
Well now... we have the entire country!
1/
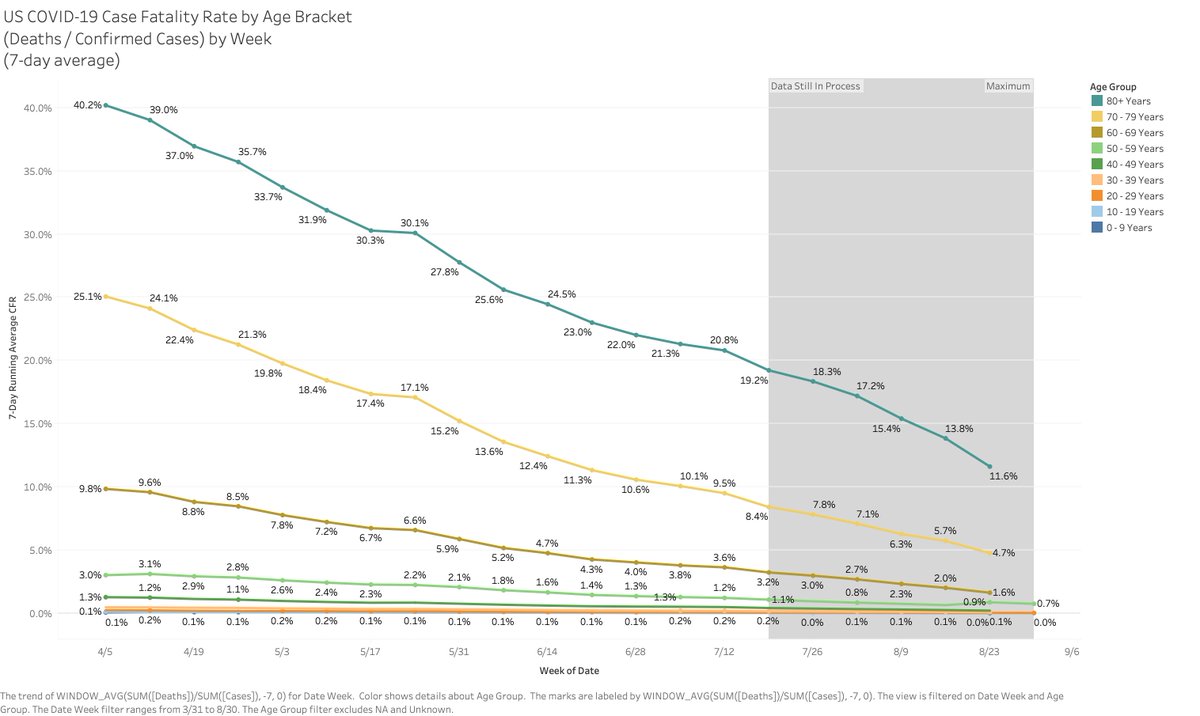
Yep, the CDC this past week started publishing caseline data for 3.5M cases resulting in 125K deaths. That would put us back up towards August 16th or so (CDC lags from what you see on the other dashboards). But the info we have now gets us charts like this!
2/
2/
Now, CFR/IFR can differ from country to country and can be impacted by all sorts of things: testing regime, better treatments, catching the disease earlier, better (or maybe even FEWER) NPI. There& #39;s a LOT of discussion going on though because these drops - keep dropping!
3/
3/
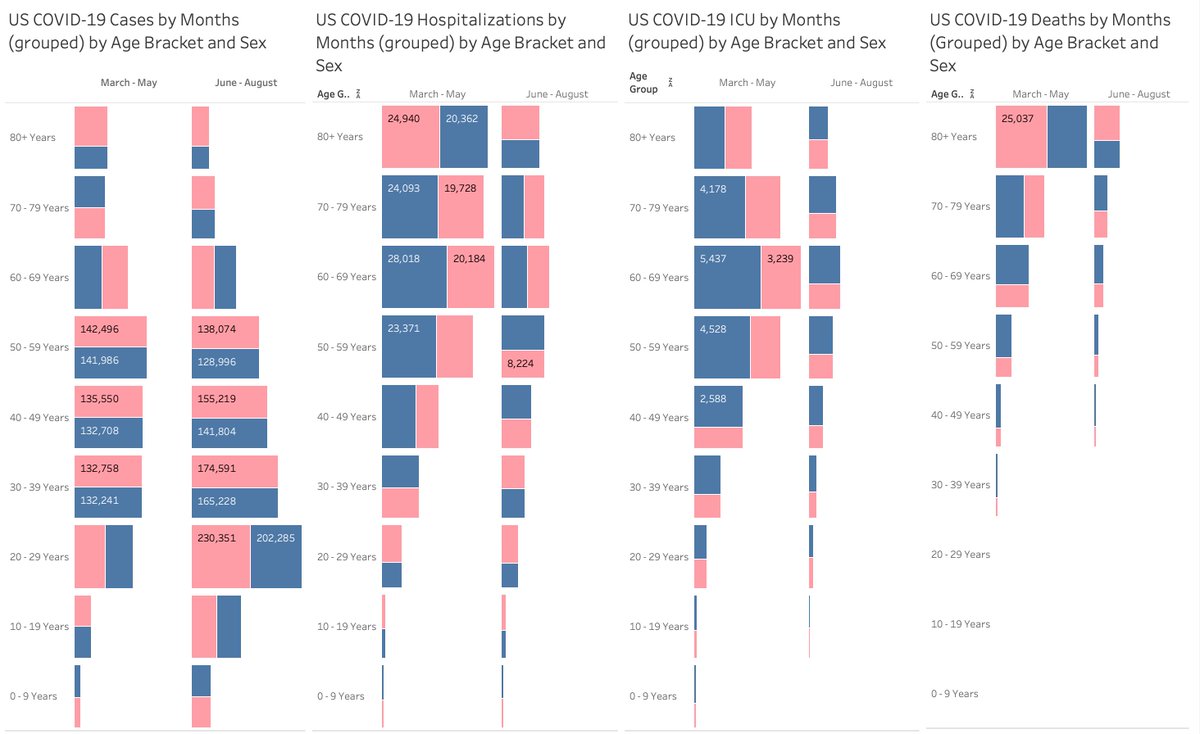
If you compare March through May and June through August you realize that the pandemic is indeed waning out (even with the MASSIVE case burst) the number of hospitalizations, ICUs and deaths went down from the NYU/NJ disaster in April. (color male-blue, female-pink)
4/
4/
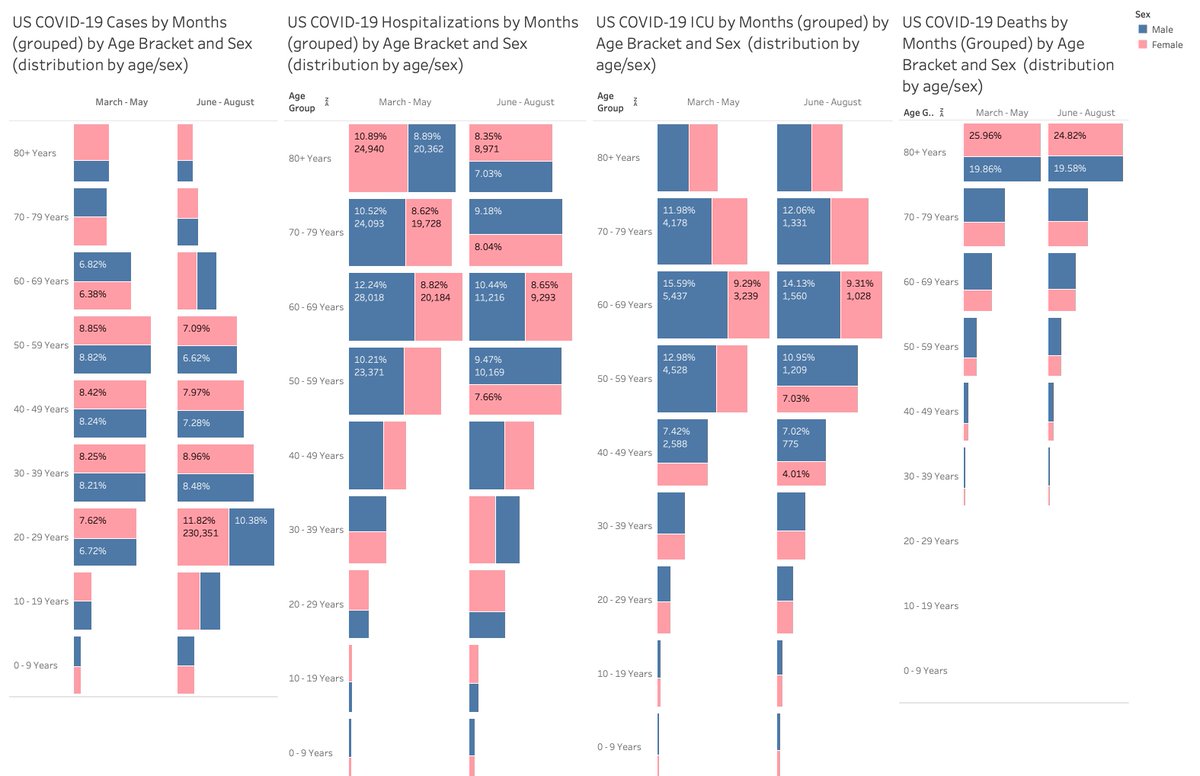
However, one of the things you realize is that even with the BIG drop in CFR the relative distribution of hospitalizations, ICUs and deaths across age groups didn& #39;t change THAT much.
Same chart but now as a % of age bracket.
5/
Same chart but now as a % of age bracket.
5/
Let me present what& #39;s going through our heads here:
1) we see a MASSIVE spike in cases for the the younger age demographics.
2) but the number of cases for the "downline" burdens is lower
3) the overall % distribution of those ages remains - the same!
https://twitter.com/BallouxFrancois/status/1302717560388046848?s=20
6/">https://twitter.com/BallouxFr...
So, as Prof B alludes to... does this mean a "milder" version of the virus is underway? Possibly. But it might also allude to the BIG problem we& #39;re tackling right now: TESTING.
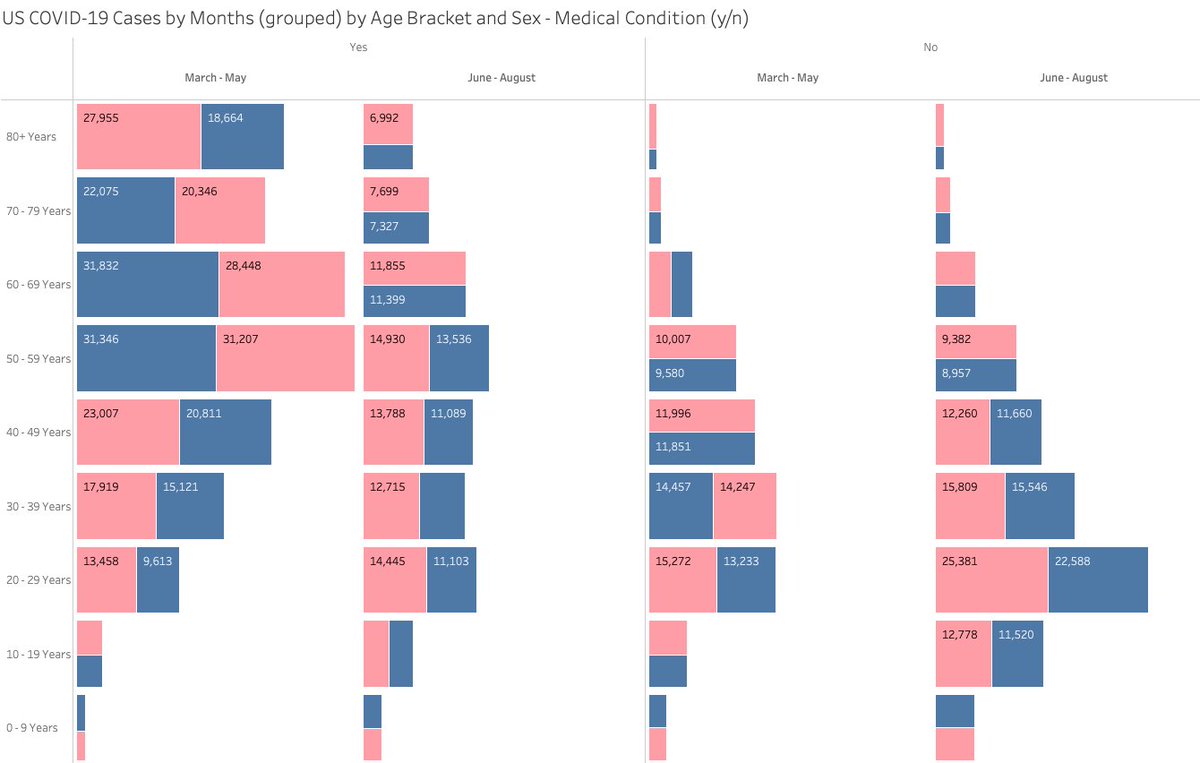
The caseline file ALSO includes a toggle dimension for "Medical Condition".
Cases: y/n by age:
7/
The caseline file ALSO includes a toggle dimension for "Medical Condition".
Cases: y/n by age:
7/
On the left, male/female by age, grouped months and toggled "Yes" for "Medical Condition." On the right: "No" The BURST of cases where "statistically" you SHOULD see more downline burdens (hosp., ICU, deaths) didn& #39;t happen because the cases are attached to healthy people.
8/
8/
One other way to check this. Let& #39;s look at deaths by month (y/n) w / Medical Cond..
It& #39;s possible that the lower CFR could harken back to Ionnadis& #39; insight, what we& #39;ve dubbed "dry tinder"
Perhaps by the time the summer was upon us the susceptible hosts were& #39;t there for COVID
9/
It& #39;s possible that the lower CFR could harken back to Ionnadis& #39; insight, what we& #39;ve dubbed "dry tinder"
Perhaps by the time the summer was upon us the susceptible hosts were& #39;t there for COVID
9/

 Read on Twitter


