Quick thread on our "levelling up" report today & new Taskforce.
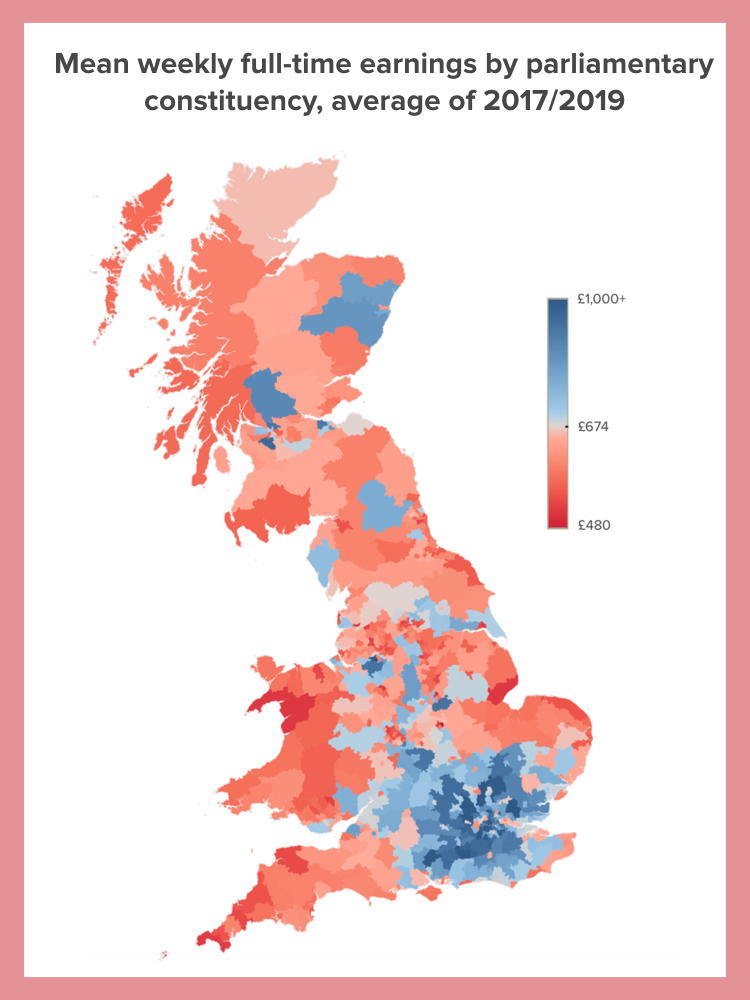
Most people know there& #39;s a big gap in earnings and incomes between London, the SE & Scotland on the one hand and the rest of the country on the other (map below). But lots turns on how you measure things... (1/15)
Most people know there& #39;s a big gap in earnings and incomes between London, the SE & Scotland on the one hand and the rest of the country on the other (map below). But lots turns on how you measure things... (1/15)
My report looks at how subtly different ways of measuring performance can tell VERY different stories about what& #39;s happening in different places. (2/15)
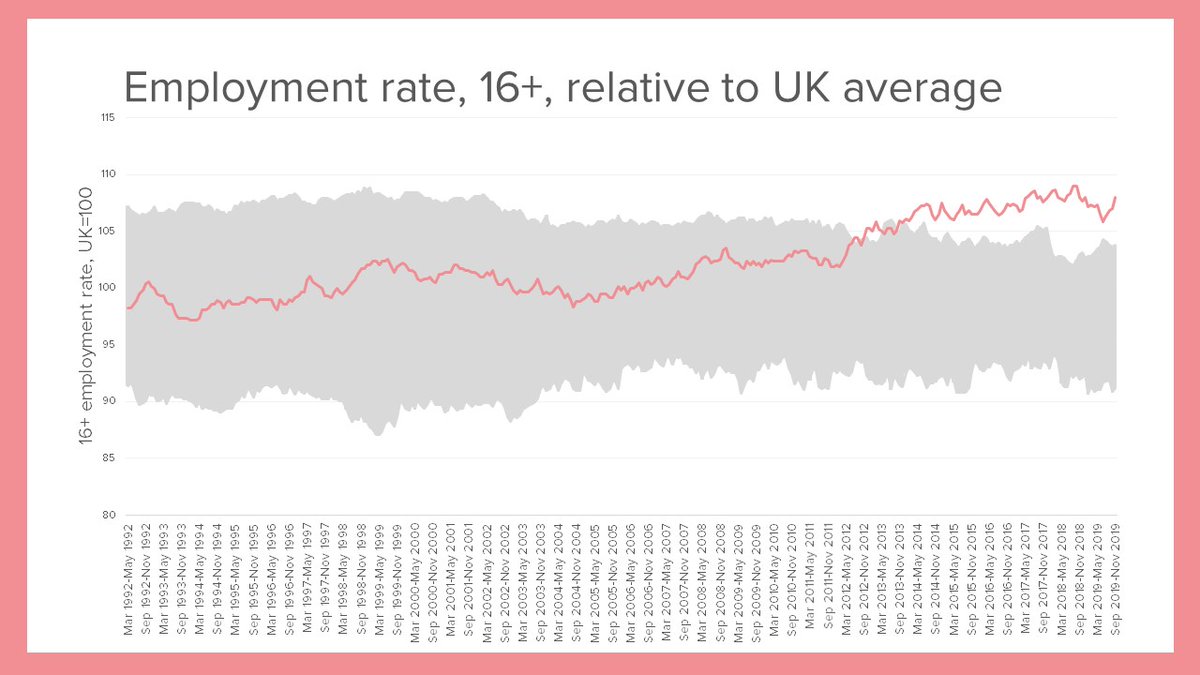
For example, if you look at the employment rate for 16-64 year olds, London is in the middle of the pack.
But look at 16+ employment, and London (in red) is zooming ahead - pension age employment is much higher there. (3/15)
But look at 16+ employment, and London (in red) is zooming ahead - pension age employment is much higher there. (3/15)
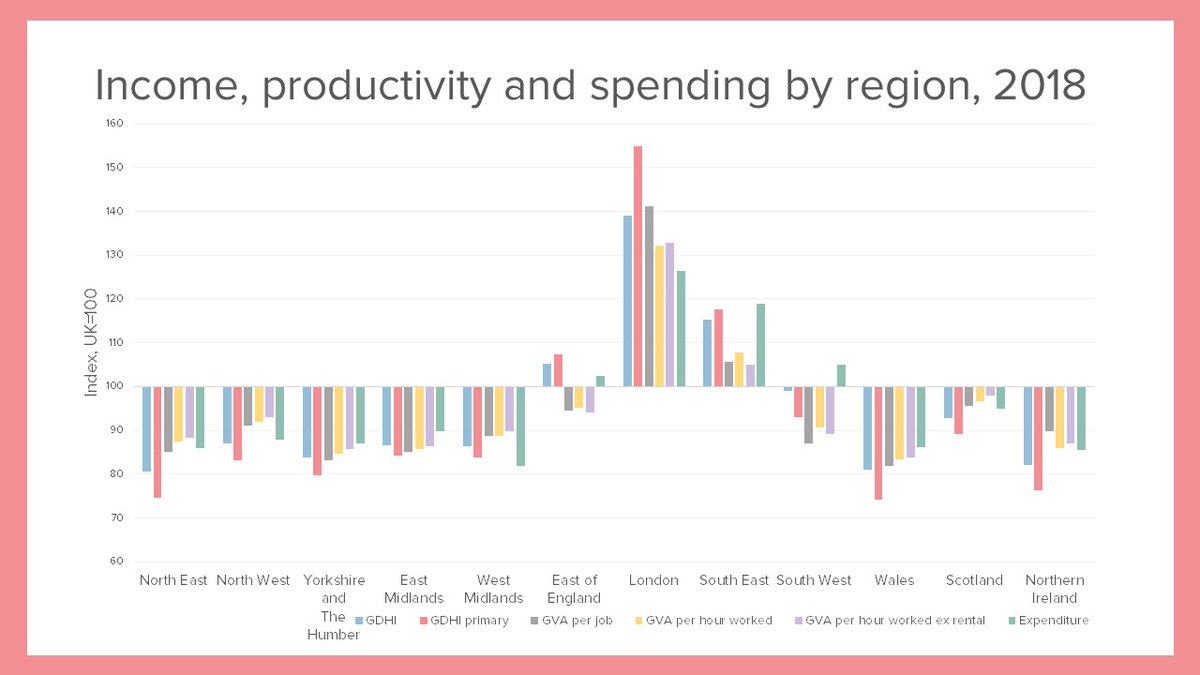
Looking at earnings and incomes the same applies.
Total disposable income in London is much higher than the rest of the country, (particularly pre-tax & benefits). Productivity (per job or per hour worked) and expenditure are also higher, but a little less so... (4/15)
Total disposable income in London is much higher than the rest of the country, (particularly pre-tax & benefits). Productivity (per job or per hour worked) and expenditure are also higher, but a little less so... (4/15)
Turning to distributions:
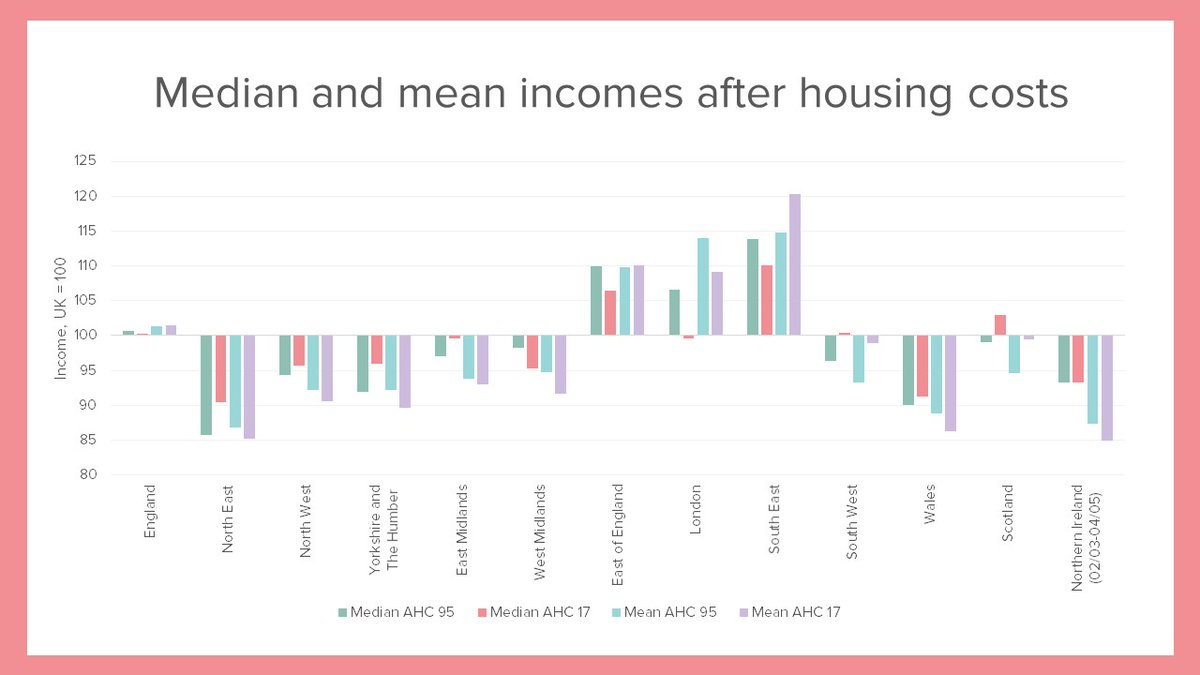
If we look at *median* incomes we see convergence between regions.
If we look at *mean* incomes we see divergence.
What& #39;s going on? (5/15)
If we look at *median* incomes we see convergence between regions.
If we look at *mean* incomes we see divergence.
What& #39;s going on? (5/15)
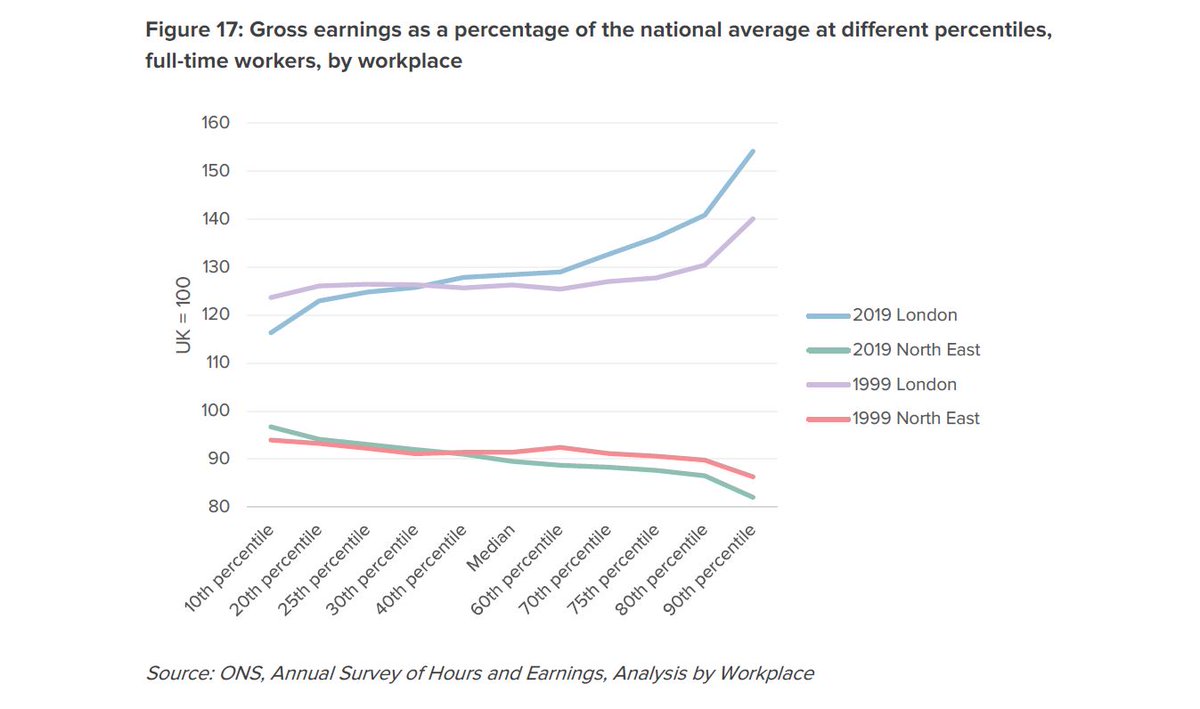
The income gaps between richer and poorer regions are much bigger at the top end of the income distribution than the median or the bottom... (6/15)
There has been *convergence* between regions at the bottom end (driven by the National Living Wage, Low income tax cuts, Tax Credits/UC etc).
But there& #39;s been divergence at the top end. To channel "The Day Today", the income trumpet (TM) is turning into a tuba shape. (7/15)
But there& #39;s been divergence at the top end. To channel "The Day Today", the income trumpet (TM) is turning into a tuba shape. (7/15)
Cities vs towns is another one where the measure matters a lot.
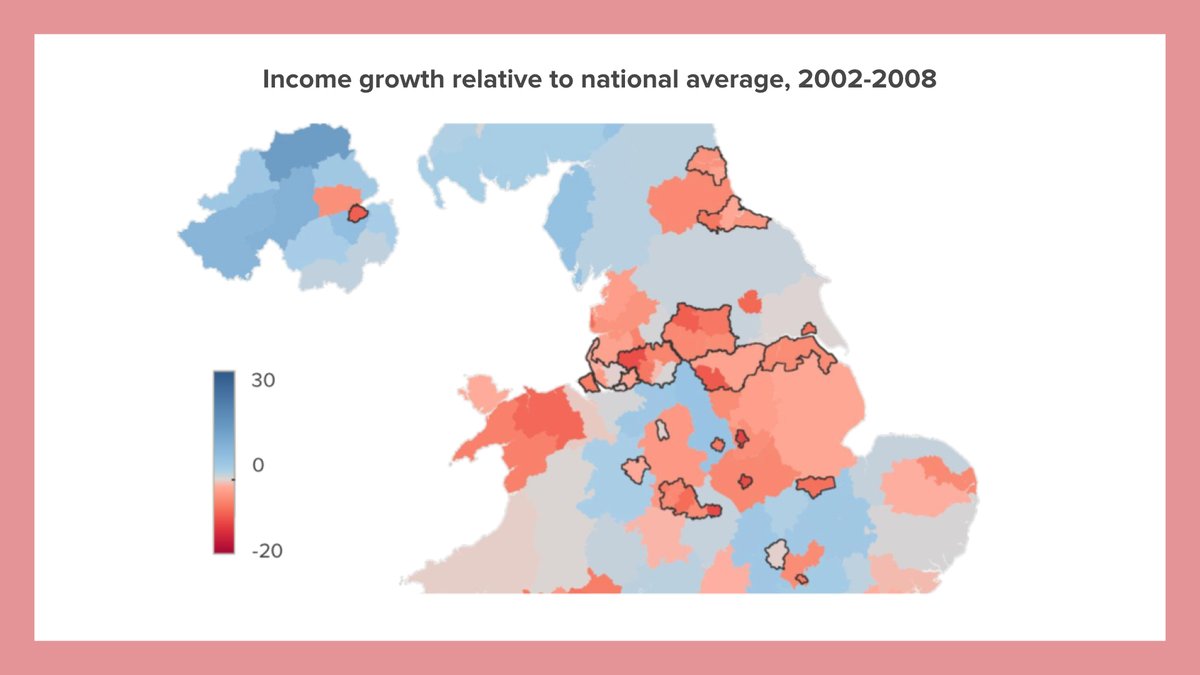
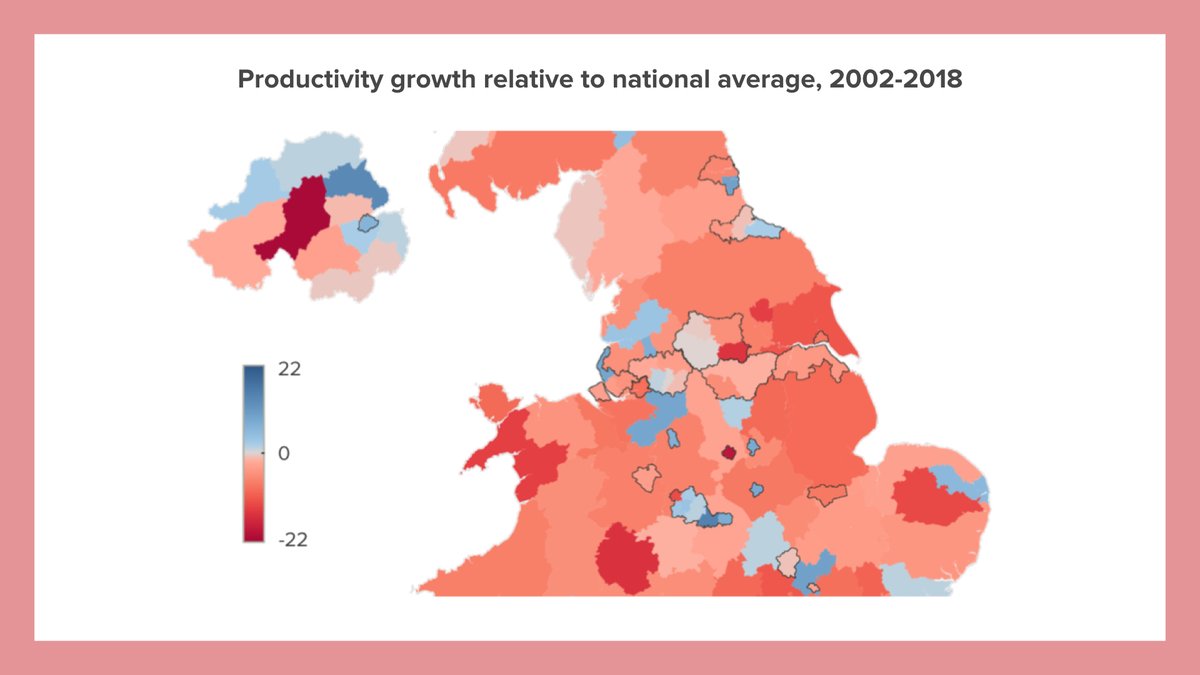
Inner cities grew GDP and productivity faster than their surroundings, but grew income more slowly... (8/15)
Inner cities grew GDP and productivity faster than their surroundings, but grew income more slowly... (8/15)
It& #39;s not clear whether this reflects: faster growth in commuting; faster growth in commuter incomes; or changing composition of the cities (more students, more international migration). Either way it shows how progress depends on choice of measure. (9/15)
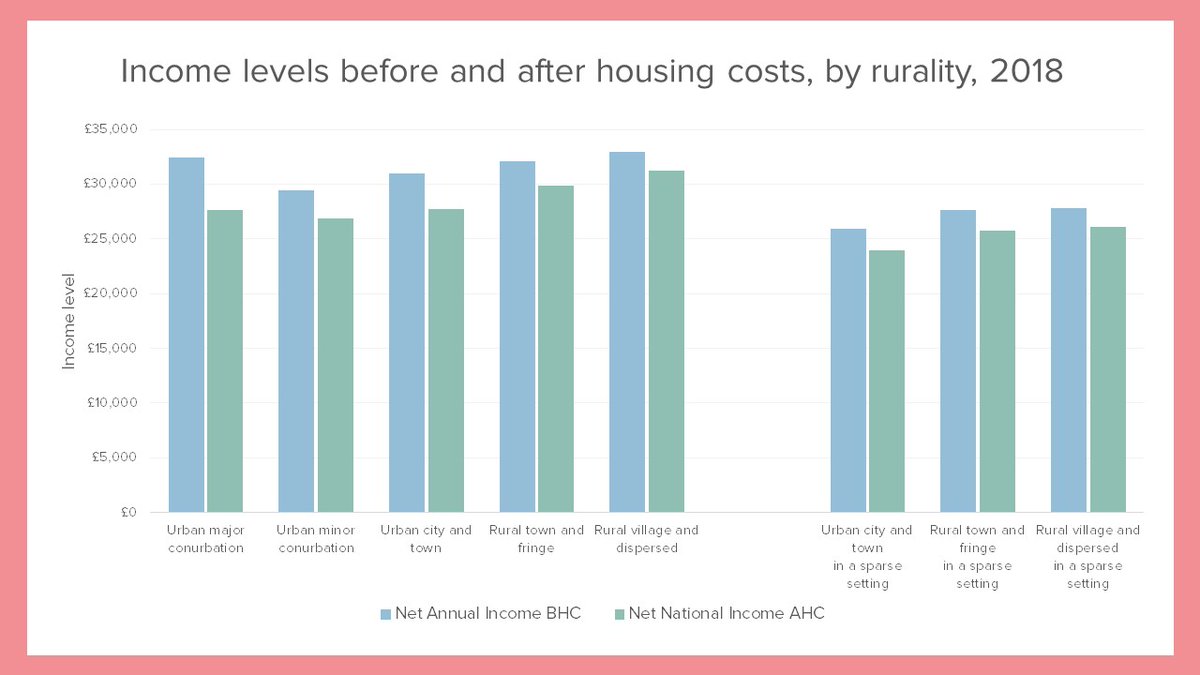
One thing that& #39;s clear is that housing costs are a bigger problem in cities. Looking at @ONS neighbourhood-level data we can see that people in villages and large cities start from similar pre-housing incomes, but city-dwellers pay more for housing. (10/15)
People in areas ONS defines as "sparse" (like North Devon, Shropshire, Herefordshire, central Wales, rural North East & Yorks, Lincolnshire, North Norfolk) have lower incomes even after you control for qualifications etc. Transport improvements could partic help there? (11/15)
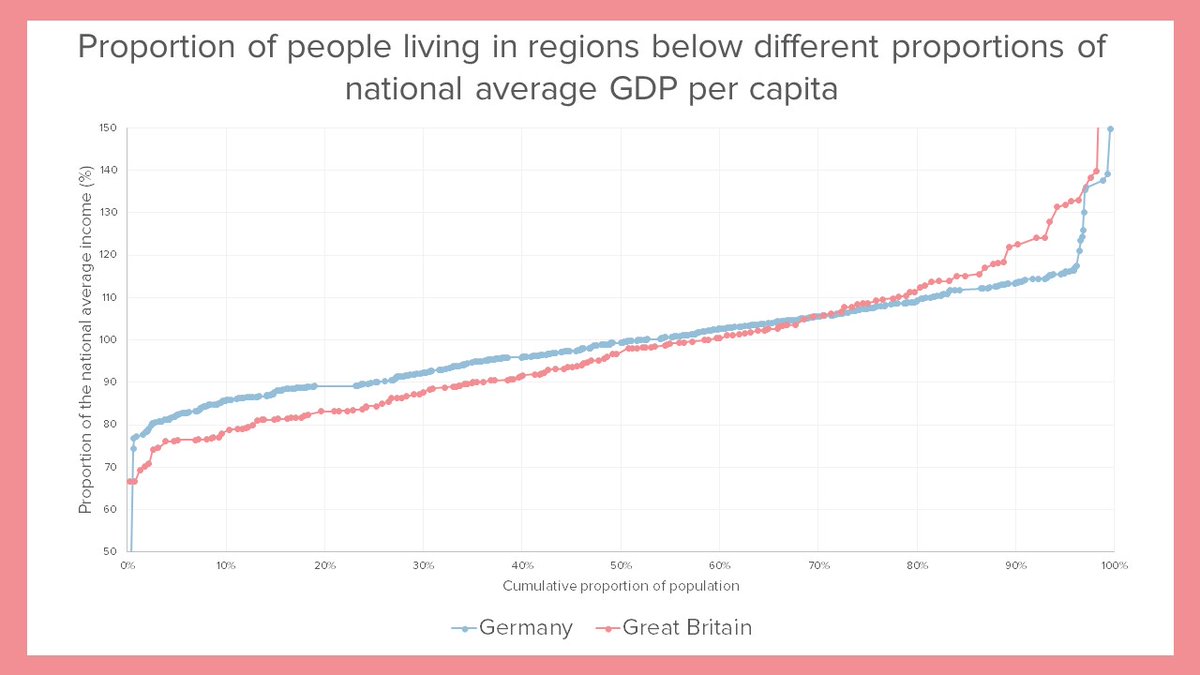
More balanced countries have higher incomes overall: there& #39;s no major country with higher average income & a more unbalanced economy than the UK.
Compared to others we are substantially more unbalanced. Faster growth in poorer places needed to make UK stronger overall (12/15)
Compared to others we are substantially more unbalanced. Faster growth in poorer places needed to make UK stronger overall (12/15)
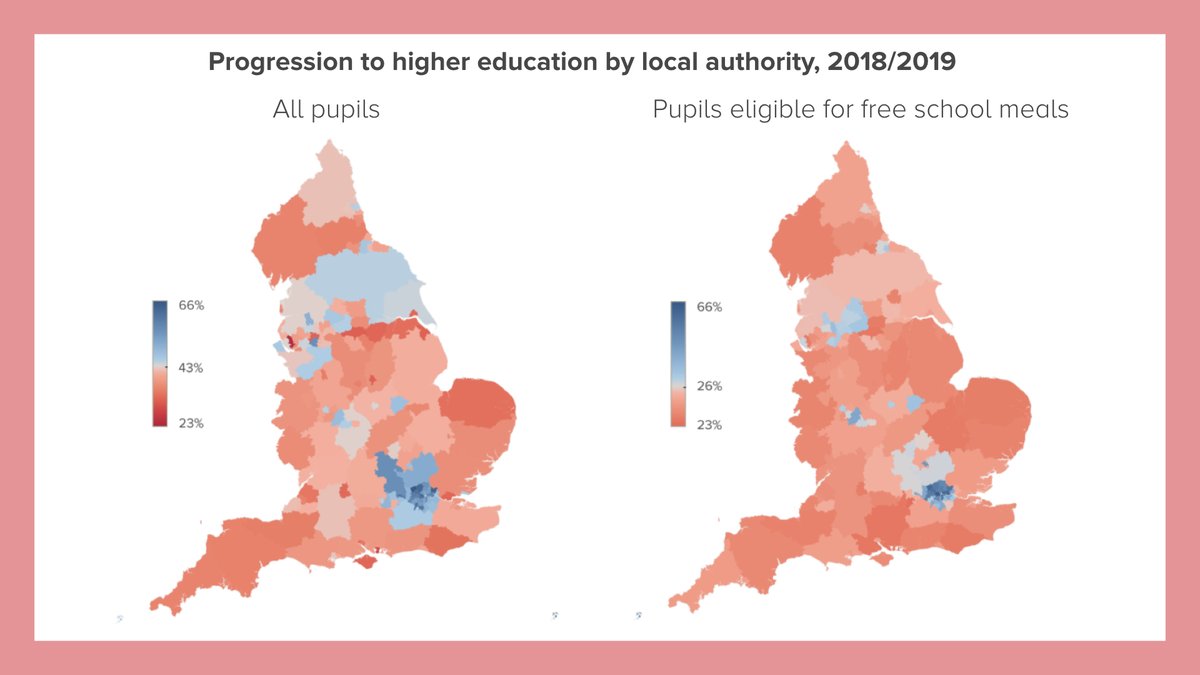
Not just outcomes either: opportunity needs to be spread wider too. In London 45% pupils eligible for free school meals progressed to HE in 2018/19.
Outside London there& #39;s 80 local authorities where pupils NOT on FSM are less likely than this to go to university. (13/15)
Outside London there& #39;s 80 local authorities where pupils NOT on FSM are less likely than this to go to university. (13/15)
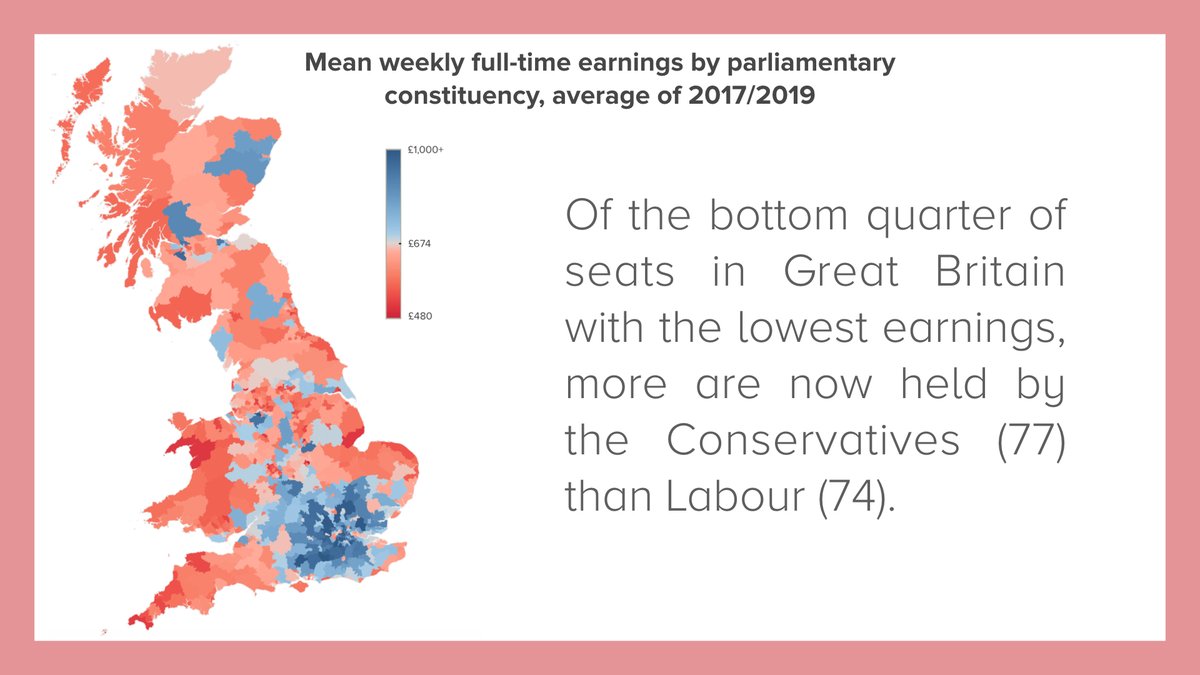
The last election changed the game politically. More of the bottom quarter of seats where earnings are lowest are now held by the Conservatives than Labour.
The seats we gained have earnings 5% lower than Labour seats. (14/15)
The seats we gained have earnings 5% lower than Labour seats. (14/15)
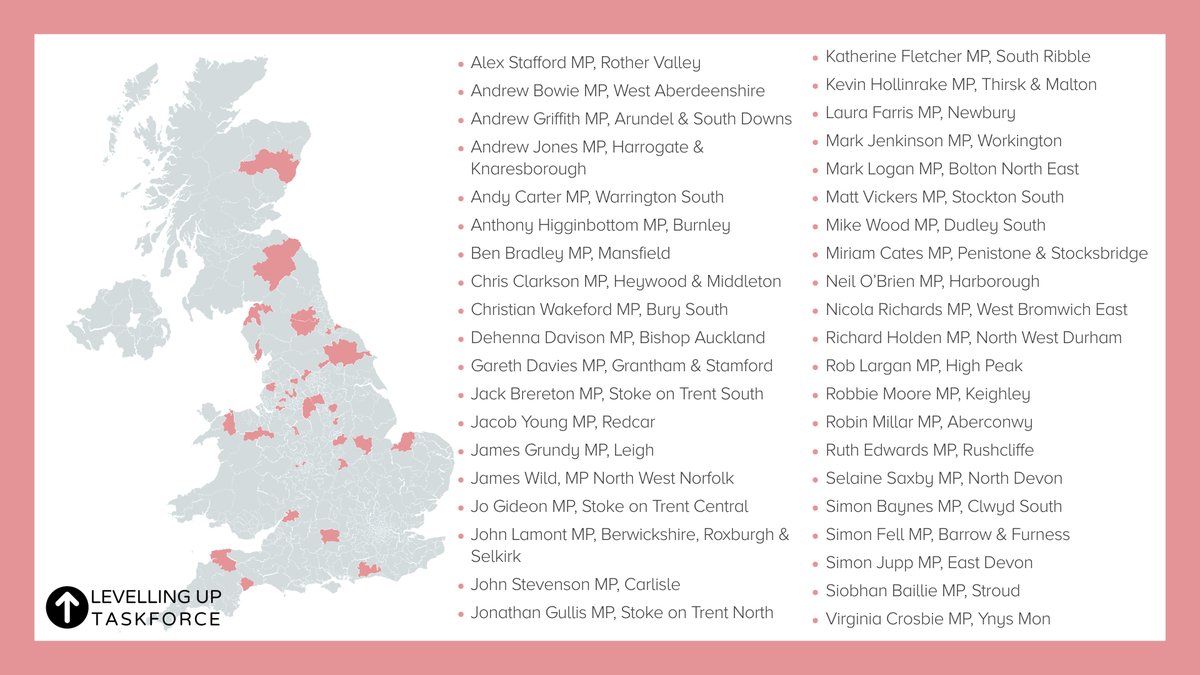
There& #39;s a lot to do to spread opportunity and fire up private sector growth in poorer places - which is why I and 40 Conservative MPs have formed the new Levelling Up Taskforce.
More MPs are already joining this morning! Thanks for reading and watch this space. (15/15)
More MPs are already joining this morning! Thanks for reading and watch this space. (15/15)

 Read on Twitter