
 Read on Twitter
Thread in plain charts on how #Bitcoin  https://abs.twimg.com/hashflags... draggable="false" alt=""> captures the growth of a global underlying phenomenon: chaos.
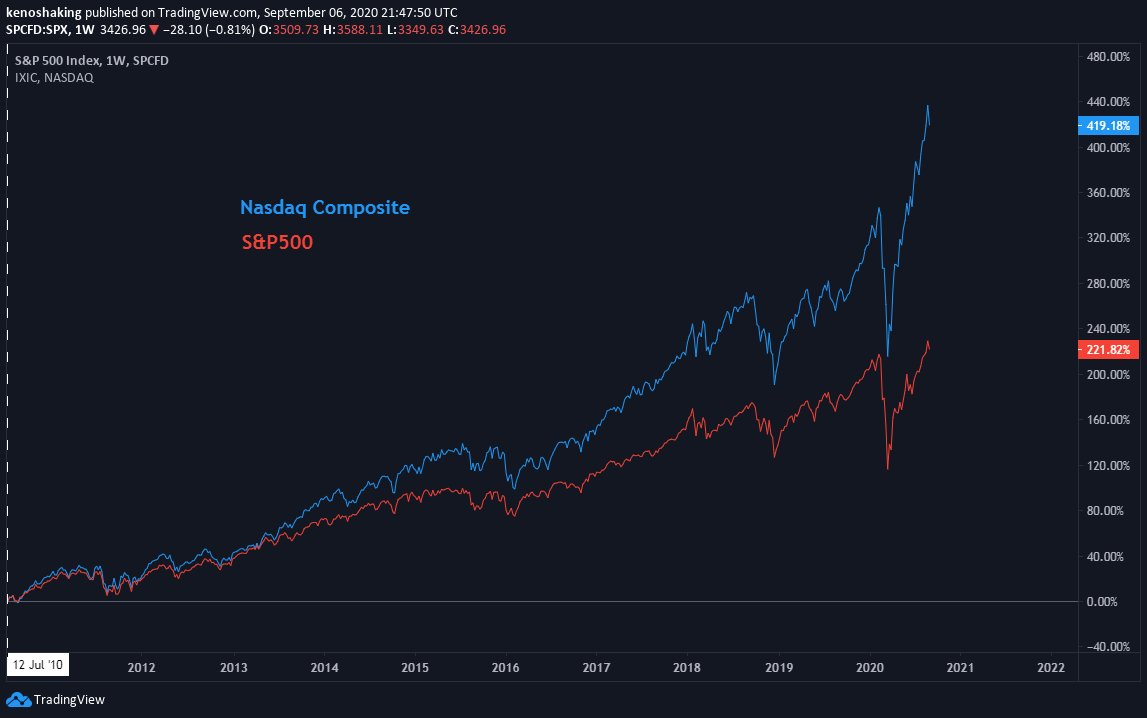
1/ Two major disruptive technological trends have exploded in the last decade: (A) Big Tech and (B) Bitcoin.
The S&P 500, IXIC, and BTC as representatives (BTC-T-D).
1/ Two major disruptive technological trends have exploded in the last decade: (A) Big Tech and (B) Bitcoin.
The S&P 500, IXIC, and BTC as representatives (BTC-T-D).
 captures the growth of a global underlying phenomenon: chaos.1/ Two major disruptive technological trends have exploded in the last decade: (A) Big Tech and (B) Bitcoin.The S&P 500, IXIC, and BTC as representatives (BTC-T-D)." title="Thread in plain charts on how #Bitcoin https://abs.twimg.com/hashflags... draggable="false" alt=""> captures the growth of a global underlying phenomenon: chaos.1/ Two major disruptive technological trends have exploded in the last decade: (A) Big Tech and (B) Bitcoin.The S&P 500, IXIC, and BTC as representatives (BTC-T-D).">
 captures the growth of a global underlying phenomenon: chaos.1/ Two major disruptive technological trends have exploded in the last decade: (A) Big Tech and (B) Bitcoin.The S&P 500, IXIC, and BTC as representatives (BTC-T-D)." title="Thread in plain charts on how #Bitcoin https://abs.twimg.com/hashflags... draggable="false" alt=""> captures the growth of a global underlying phenomenon: chaos.1/ Two major disruptive technological trends have exploded in the last decade: (A) Big Tech and (B) Bitcoin.The S&P 500, IXIC, and BTC as representatives (BTC-T-D).">
2/ A is characterized by the mainstream, the insitutional, the friendly, and is geared towards shareholder value. It is seen as a play on a world digitized and globalized. Their stocks are seen as basic components of growth baskets. If you bet on it, you made a lot of money.
3/ B is characterized by the contrarian, the cypherpunk, the volatile, and is geared towards self-ownership. It is seen as a play on a world in turmoil and systemic risk. It& #39;s a value-asset hedge against the inflationary establishment. If you bet on it, you made a lot of money.
4/ I want to showcase in few charts the value growth of these trends in terms of returns. Linear scale is used to capture percentage points relative to each other in the right axis, not prices. Returns are not annualized, but x-to-date, since I want to capture most of the decade.
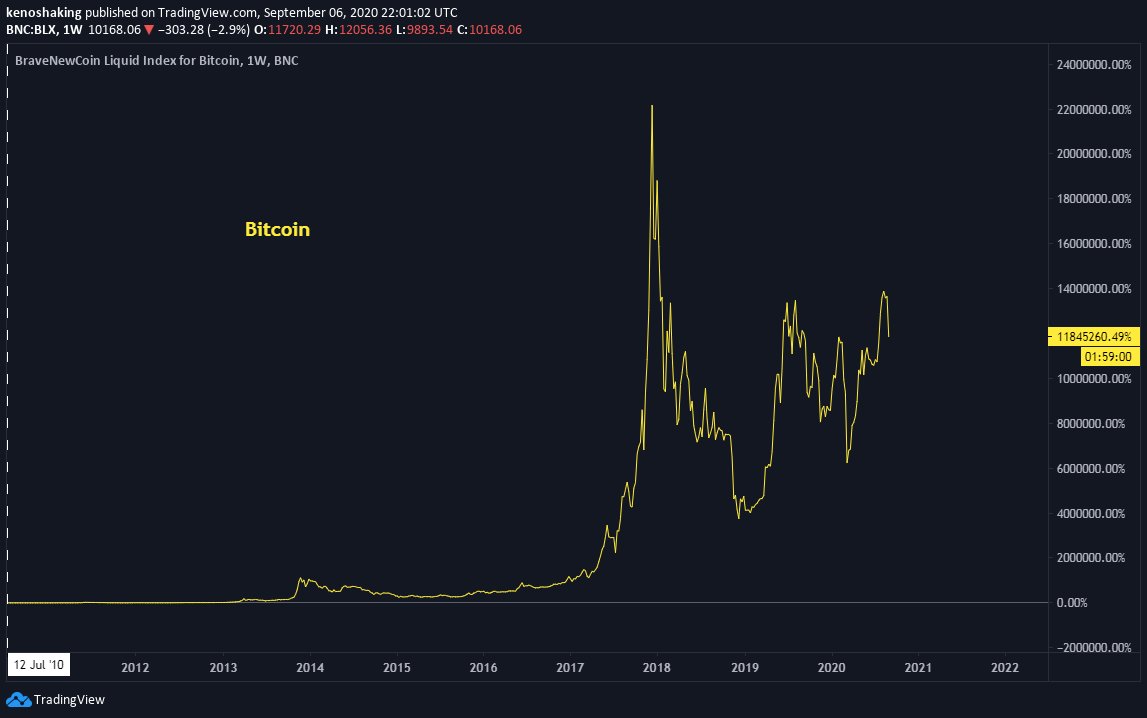
5/ So, this is the S&P500, IXIC, and BTC on the same returns axis.
Bitcoin USD outperformance over all other performers combined (BTC-T-D): 11,844,619.49%.
: 11,844,619.49%.")
Bitcoin USD outperformance over all other performers combined (BTC-T-D): 11,844,619.49%.
6/ Another example. This is all stocks encompassed in the Four Horsemen, GAFAM (S&P5), and FAANG baskets, with and without BTC.
Bitcoin USD outperformance over all other performers combined (FB-T-D): 191,165.54%.
, and FAANG baskets, with and without BTC.Bitcoin USD outperformance over all other performers combined (FB-T-D): 191,165.54%.")
, and FAANG baskets, with and without BTC.Bitcoin USD outperformance over all other performers combined (FB-T-D): 191,165.54%.")
Bitcoin USD outperformance over all other performers combined (FB-T-D): 191,165.54%.
7/ Now the ARKK ETF, the world standard for disruptive innovation in recent years, where the exponential advance is not yet assumed to be priced-in. They are also known for being the OGs in insitutional Bitcoin exposure.
Bitcoin USD outperformance over ARKK (ARKK-T-D): 2,726%.
: 2,726%.")
: 2,726%.")
Bitcoin USD outperformance over ARKK (ARKK-T-D): 2,726%.
8/ Now Tesla and Square, ARK& #39;s biggest performance contributors over the years. The "next" Big Tech. Both stand as contrarian bets to the industrial (TSLA) and the financial (SQ) establishments. Wall-Street trailblazers are already betting for unique growth-through-chaos assets.
9/ Bitcoin USD outperformance is much less but still above all performers combined (SQ-T-D): 1,151%.
: 1,151%.")
: 1,151%.")
10/
a. Both trends have been blackholes in terms of pricing in (or "sucking in") money printing.
b. Both have increased wealth inequality, A by enriching innovators and the shareholder elite, and B by enriching innovators and contrarian early adopters.
a. Both trends have been blackholes in terms of pricing in (or "sucking in") money printing.
b. Both have increased wealth inequality, A by enriching innovators and the shareholder elite, and B by enriching innovators and contrarian early adopters.
Fin/
c. Despite both trends having powerful advances, B seems to asymmetrically overtake A by orders of magnitude.
d. The explosions of both are not mutually exclusive. In fact, one may feed from the other.
c. Despite both trends having powerful advances, B seems to asymmetrically overtake A by orders of magnitude.
d. The explosions of both are not mutually exclusive. In fact, one may feed from the other.


