
 Read on Twitter
Charts tracking trigger points in Victoria& #39;s roadmap to recovery: (thread, 1/5).
1. Avg daily cases in metro Melbourne. Goal: blue line to reach gold band (30-50 / day, 14-day trailing avg).
#COVID19Victoria #COVID19Vic #COVID19Aus #COVID19
.1. Avg daily cases in metro Melbourne. Goal: blue line to reach gold band (30-50 / day, 14-day trailing avg). #COVID19Victoria #COVID19Vic #COVID19Aus #COVID19")
1. Avg daily cases in metro Melbourne. Goal: blue line to reach gold band (30-50 / day, 14-day trailing avg).
#COVID19Victoria #COVID19Vic #COVID19Aus #COVID19
2. Avg. daily cases in regional Victoria. Goal: green line going for gold. (<5 / day, 14-day trailing avg).
.")
3. Community spread (orange) + still under investigation (pink line).
*Metro Step 2 contingent on these*. Metro Step 3 may start with <5 unknowns in last 2 weeks. Regional Step 3 may start with 0 unknowns in regional VIC (tho geo data re community spread not provided).
 + still under investigation (pink line). *Metro Step 2 contingent on these*. Metro Step 3 may start with <5 unknowns in last 2 weeks. Regional Step 3 may start with 0 unknowns in regional VIC (tho geo data re community spread not provided).")
*Metro Step 2 contingent on these*. Metro Step 3 may start with <5 unknowns in last 2 weeks. Regional Step 3 may start with 0 unknowns in regional VIC (tho geo data re community spread not provided).
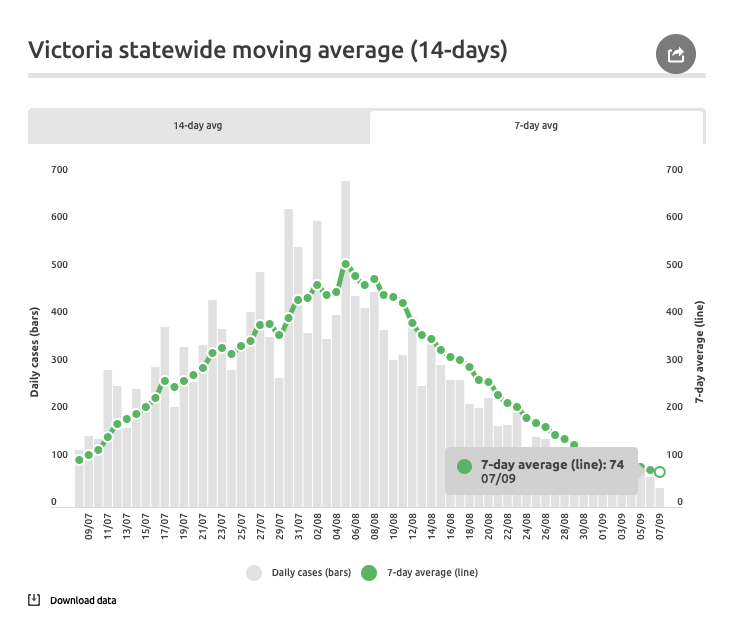
4. 14-day moving avg of all cases statewide.
Various sites / sources will likely have different avgs depending on which daily case input they use.
It could be 1 of 3 - New, net, or true cases based on notification dates. I use last. Metro / regional split only given in net.

Various sites / sources will likely have different avgs depending on which daily case input they use.
It could be 1 of 3 - New, net, or true cases based on notification dates. I use last. Metro / regional split only given in net.
Keeping 7-day average on the site based on request.
https://www.covid19data.com.au/
https://www.covid19data.com.au/">... href=" https://www.covid19data.com.au/victoria
Sending">https://www.covid19data.com.au/victoria&... Sydney love and respect to all Victorians, especially those in extended lockdown. https://abs.twimg.com/emoji/v2/... draggable="false" alt="💙" title="Blaues Herz" aria-label="Emoji: Blaues Herz">
https://www.covid19data.com.au/
Sending">https://www.covid19data.com.au/victoria&... Sydney love and respect to all Victorians, especially those in extended lockdown.
 https://www.covid19data.com.au/victoria&... Sydney love and respect to all Victorians, especially those in extended lockdown. https://abs.twimg.com/emoji/v2/... draggable="false" alt="💙" title="Blaues Herz" aria-label="Emoji: Blaues Herz">" title="Keeping 7-day average on the site based on request. https://www.covid19data.com.au/">... href=" https://www.covid19data.com.au/victoria Sending">https://www.covid19data.com.au/victoria&... Sydney love and respect to all Victorians, especially those in extended lockdown. https://abs.twimg.com/emoji/v2/... draggable="false" alt="💙" title="Blaues Herz" aria-label="Emoji: Blaues Herz">" class="img-responsive" style="max-width:100%;"/>
Update: @VictorianCHO report today will give 14-day averages, which will be great for clarity. They& #39;ll use true daily case notification data for metro / regional cases, which we do not have (we get net changes to totals). Will add those official avgs to these charts.


