Thread – Is Nasdaq Composite index in a blowout phase?
Channel study helps us to understand the long-term trend & its major peaks and troughs. However, a blowout phase occurs when price breaks above the long-term rising channel due to excess optimism & is often followed by (1/n)
Channel study helps us to understand the long-term trend & its major peaks and troughs. However, a blowout phase occurs when price breaks above the long-term rising channel due to excess optimism & is often followed by (1/n)
a sharp correction. Once the euphoric move is over, the indices/stocks enters in a multi months/years corrective phase.
Nasdaq Composite index has nearly double in past few months but what does the history tell us? Let’s have a look at few charts before that! (2/n)
Nasdaq Composite index has nearly double in past few months but what does the history tell us? Let’s have a look at few charts before that! (2/n)
1 – Nikkei – Rose higher 4 times in 5 years and post the bull run, Nikkei corrected almost 80% from the peak (3/n)
2 – Nasdaq Composite – Just prior to the blow out phase, Nasdaq Composite index tripled from the low in two years. Post the euphoric move, the index corrected 80% (4/n)
3 – Hang Seng – Broke above the long channel & saw a runaway rally but once the optimism ended, the index declined more than 65% (5/n)
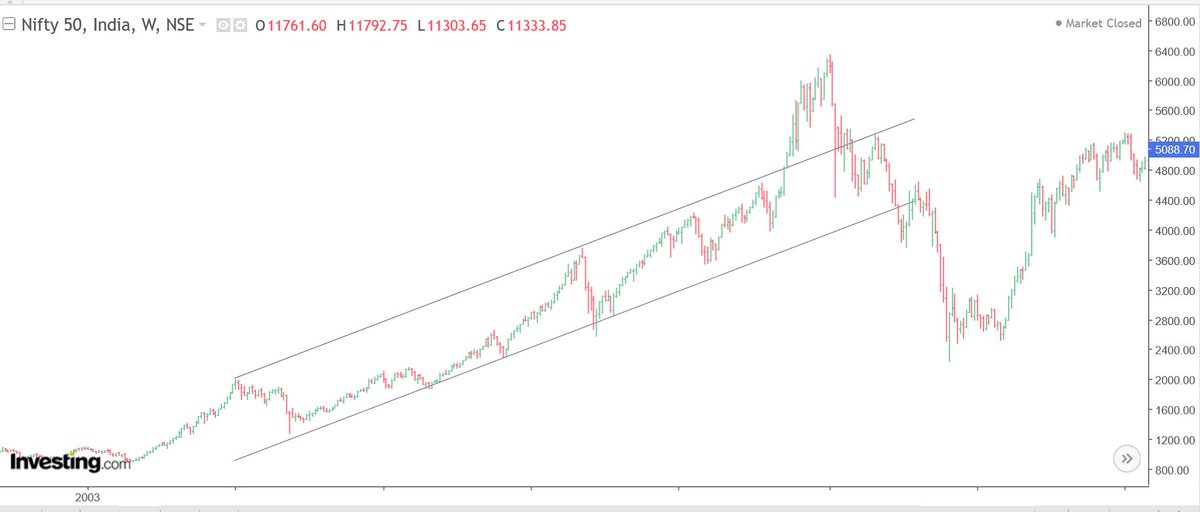
4 – Nifty 50 – Broke above channel & the blow out phase lasted for five months. Once the rally fizzled out, the index corrected a little over 60% (6/n)
5 – Shanghai – It saw a ferocious move in 2005-2007 and in two years, the index rallied five times. Once the bull run ended, the Shanghai index corrected nearly more than 70% from the peak (7/n)
6 – Gold Futures – Rallied from $675 to $1900 and broke above the rising channel for a brief while but once the up move matured, gold futures went into multiyear corrective phase & dropped around 45% from the peak (8/n)
Now let’s have a look at S&P 500 index & Nasdaq Composite -
S&P 500 – It is at an upper end of the long-term rising channel (9/n)
S&P 500 – It is at an upper end of the long-term rising channel (9/n)
Nasdaq Composite – It has breached above the upper end of the long-term rising channel and is trading above the channel resistance (10/n)
PS – History says that whenever there has been a euphoric move, indices/stocks have seen entered in a prolonged corrective phase. S&P 500 index has not seen a blowout phase yet but is at a major resistance level whereas Nasdaq is possibly in a blowout phase (11/n)
Disclaimer - This is just for educational purpose and not a recommendation to buy/sell.
I just wanted to highlight few interesting price actions pattern which has repeated occurred in the past many years
@contrarianEPS @Stockstudy8 @gshah26 @piyushchaudhry @indiacharts
I just wanted to highlight few interesting price actions pattern which has repeated occurred in the past many years
@contrarianEPS @Stockstudy8 @gshah26 @piyushchaudhry @indiacharts

 Read on Twitter


