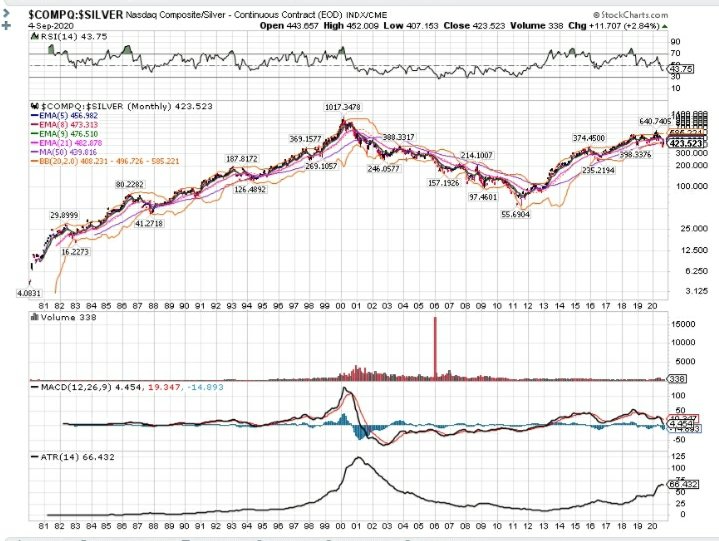
I post this chart from time to time. It& #39;s the long term ratio of Nasdaq to silver. $COMPQ / $SILVER at http://stockcharts.com"> http://stockcharts.com . It& #39;s very trendy and already 33% off the highs made earlier in 2020. It closed solidly below most short and medium term moving averages.
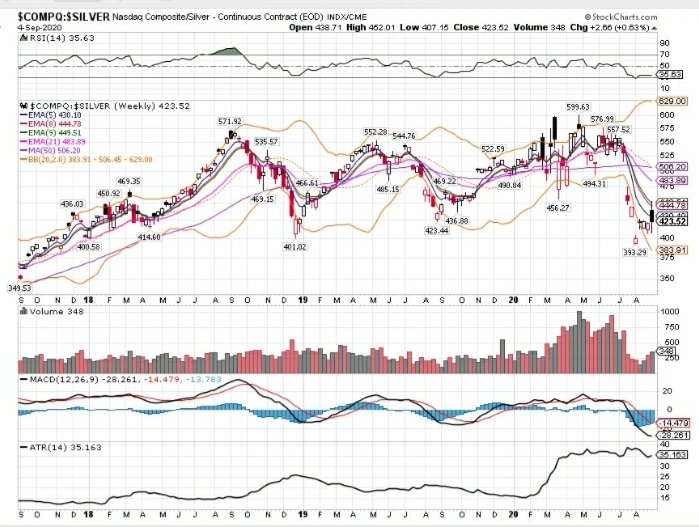
Here& #39;s a zoomed in view of recent years which I believe are showing a major top transforming into a long term down trend for the Nasdaq to silver ratio.
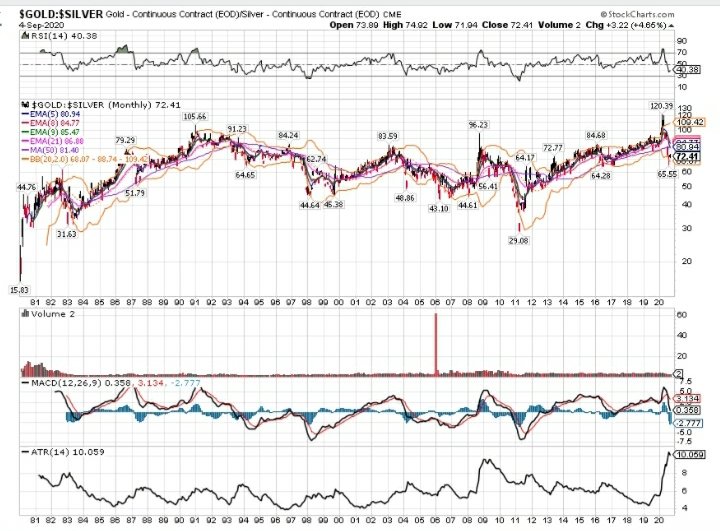
3/ Some of my conclusions:
* not long term bullish for stocks
* dip buying strategies for gold and silver, not stocks
* Trump is a weak-dollar president and likely to exacerbate this trend
* a rising interest rate cycle is what I& #39;m watching for to reverse this trend (years away)
* not long term bullish for stocks
* dip buying strategies for gold and silver, not stocks
* Trump is a weak-dollar president and likely to exacerbate this trend
* a rising interest rate cycle is what I& #39;m watching for to reverse this trend (years away)
4/ I& #39;m not worried about paper vs physical debates. We& #39;re a long way off from that being a problem. The most likely cause for paper to stop being traded for physical is the US losing a world war scenario and being straight up conquered and dismantled. Today this is unthinkable.

 Read on Twitter


