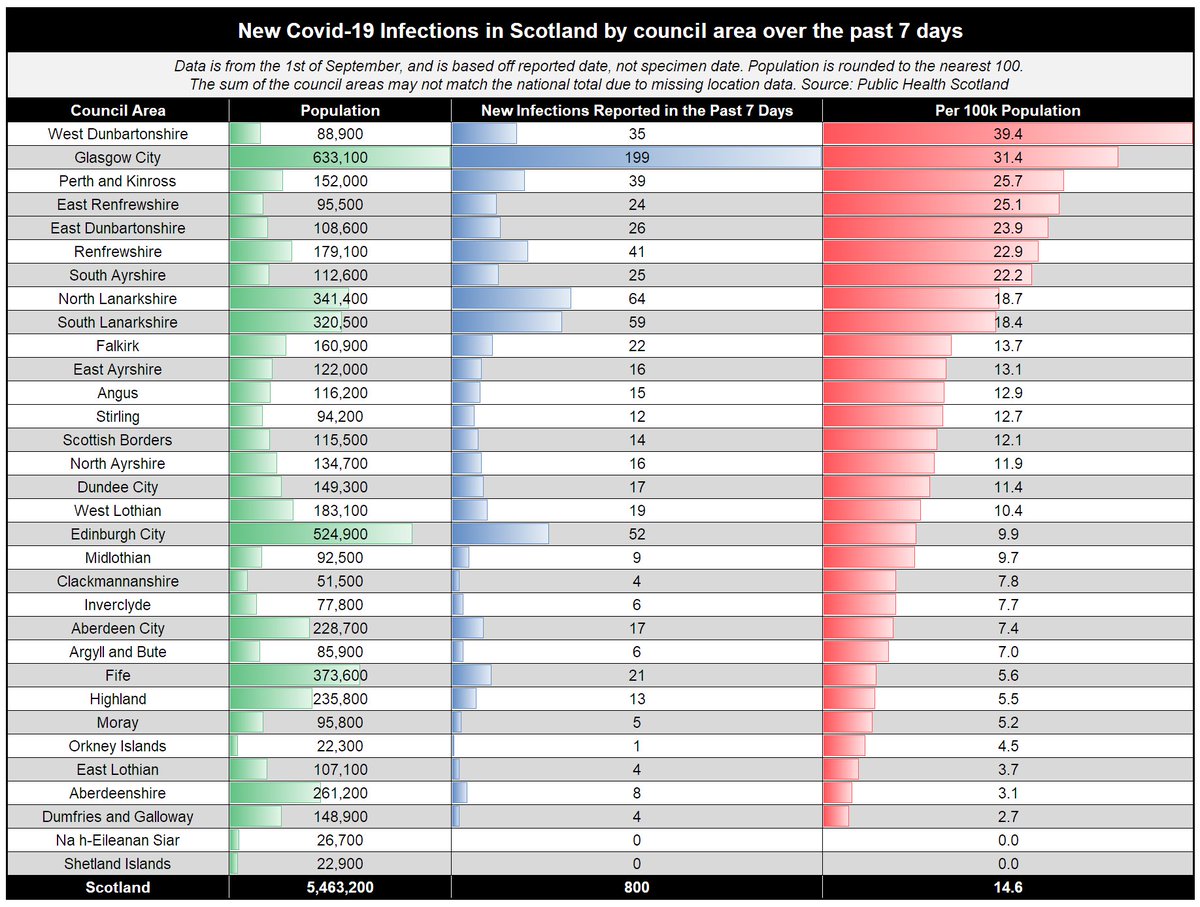
I’ve been shown data that suggests SIX other Scottish council areas have cases per 100k similar to (or even above) the rate at which @scotgov imposed restrictions on parts of Western Scotland. https://twitter.com/c4ciaran/status/1301218033424379904">https://twitter.com/c4ciaran/...
@scotgov explained restrictions in Glasgow, East Ren and West Dunbartonshire using cases per 100k for the three areas under restrictions.
The obvious question was what the comparable rate was elsewhere in Scotland.
I was surprised to find it was not easy to get an answer.
The obvious question was what the comparable rate was elsewhere in Scotland.
I was surprised to find it was not easy to get an answer.
East Ren was put under restrictions by @ScotGov at 18.8 cases per 100k. Glasgow at 21.8.
Data shared w. me by @travellingtabby suggests following areas now similar/higher:
Perth & Kinross 25.7
E Dunbarton 23.9
Renf’shire 22.9
S Ayrshire 22.2
N Lanarkshire 18.7
S Lanarkshire18.4
Data shared w. me by @travellingtabby suggests following areas now similar/higher:
Perth & Kinross 25.7
E Dunbarton 23.9
Renf’shire 22.9
S Ayrshire 22.2
N Lanarkshire 18.7
S Lanarkshire18.4
Quoting unpublished figures, John Swinney defended restrictions on Glasgow, West Dunbartonshire and East Renfrewshire saying cases per 100,000 there were ‘sizeably different.’
If the figures prove to be similar elsewhere should this have been explained?
If the figures prove to be similar elsewhere should this have been explained?
There may be good reasons if @scotgov has chosen to put measures on some areas and not others with similar cases per 100k.
However, can only take official explanations in good faith.
Explanation was cases per 100k in restricted areas were ‘sizeably different’.
However, can only take official explanations in good faith.
Explanation was cases per 100k in restricted areas were ‘sizeably different’.
Important caveat:
@travellingtabby’s figures are their own work and obviously not an official data source.
Also the figures @scotgov quoted were not from a complete, official publication.
@travellingtabby’s figures are their own work and obviously not an official data source.
Also the figures @scotgov quoted were not from a complete, official publication.
Mr Swinney himself was quoting unpublished figures.
When I requested the remaining data for the rest of Scotland @ScotGov said it was not published by Public Health Scotland.
When I requested the remaining data for the rest of Scotland @ScotGov said it was not published by Public Health Scotland.
I see this has attracted the attention of @NicolaSturgeon https://twitter.com/nicolasturgeon/status/1301450532738002951">https://twitter.com/nicolastu...

 Read on Twitter


