You will see "RSI" mentioned a lot when looking at stock charts.
RELATIVE STRENGTH INDEX
What is it?
How can you use it in your investing?
 https://abs.twimg.com/emoji/v2/... draggable="false" alt="🙌" title="Raising hands" aria-label="Emoji: Raising hands"> Thread
  https://abs.twimg.com/emoji/v2/... draggable="false" alt="🙌" title="Raising hands" aria-label="Emoji: Raising hands">
RELATIVE STRENGTH INDEX
What is it?
How can you use it in your investing?
1/
Relative Strength Index measures how a stock is doing as compared to the overall market.
For ease of this explanation we will say how a stock compares to the S&P 500.
If a stock is performing poorly its RSI will be low.
If a stock is performing well its RSI will be high.
Relative Strength Index measures how a stock is doing as compared to the overall market.
For ease of this explanation we will say how a stock compares to the S&P 500.
If a stock is performing poorly its RSI will be low.
If a stock is performing well its RSI will be high.
2/
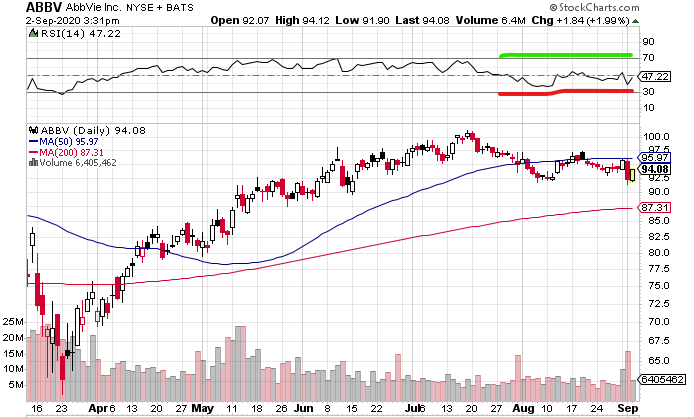
An RSI measurement is between 0 and 100.
0 being the weakest and 100 being the strongest.
Generally RSI stays in the 30-70 zone as a stock moves up and down.
Greater than 70 being overbought (Green)
Less than 30 being oversold (Red)
I& #39;ll be using $ABBV chart for help.
An RSI measurement is between 0 and 100.
0 being the weakest and 100 being the strongest.
Generally RSI stays in the 30-70 zone as a stock moves up and down.
Greater than 70 being overbought (Green)
Less than 30 being oversold (Red)
I& #39;ll be using $ABBV chart for help.
3/
The RSI will rise as the stock closes positive more days in it& #39;s recent history. https://abs.twimg.com/emoji/v2/... draggable="false" alt="🟩" title="Grünes Quadrat" aria-label="Emoji: Grünes Quadrat">
The RSI will decrease as more and more times the stock closes negative. https://abs.twimg.com/emoji/v2/... draggable="false" alt="🟥" title="Rotes Quadrat" aria-label="Emoji: Rotes Quadrat">
So how can you use it to help you?
The RSI will rise as the stock closes positive more days in it& #39;s recent history.
The RSI will decrease as more and more times the stock closes negative.
So how can you use it to help you?
4/
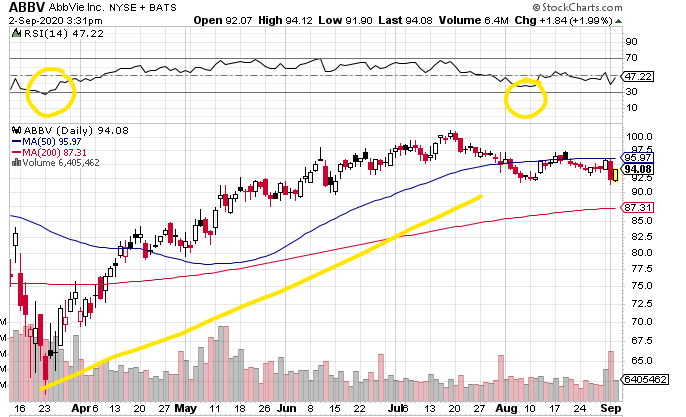
In my case I mostly look at dividend paying stocks so my horizon is very long.
10 years+
If I will be holding a company for that long I& #39;m looking to add at any point I see a price fluctuation down in an overall upwards trend.
I have circled two spots for adding.
In my case I mostly look at dividend paying stocks so my horizon is very long.
10 years+
If I will be holding a company for that long I& #39;m looking to add at any point I see a price fluctuation down in an overall upwards trend.
I have circled two spots for adding.
5/
Obviously this is easy to show after the fact.
The hard part is finding these spots in the moment.
There is no perfect entry into a stock. You can only do the best with the information you have.
The important part is concentrating on the overall stock trend.
Obviously this is easy to show after the fact.
The hard part is finding these spots in the moment.
There is no perfect entry into a stock. You can only do the best with the information you have.
The important part is concentrating on the overall stock trend.
6/
You can get extremely technical with interpretation of RSI.
Do your homework and always understand as much as you can before entering a position.
This is not investment advice, just a little clarification on what RSI can do to help.
Shoot me a DM or comment for more info!
You can get extremely technical with interpretation of RSI.
Do your homework and always understand as much as you can before entering a position.
This is not investment advice, just a little clarification on what RSI can do to help.
Shoot me a DM or comment for more info!

 Read on Twitter


