$DAX Situation Analysis (thread)
Important bullish movement today that must be analyzed in depth
1) Intraday:
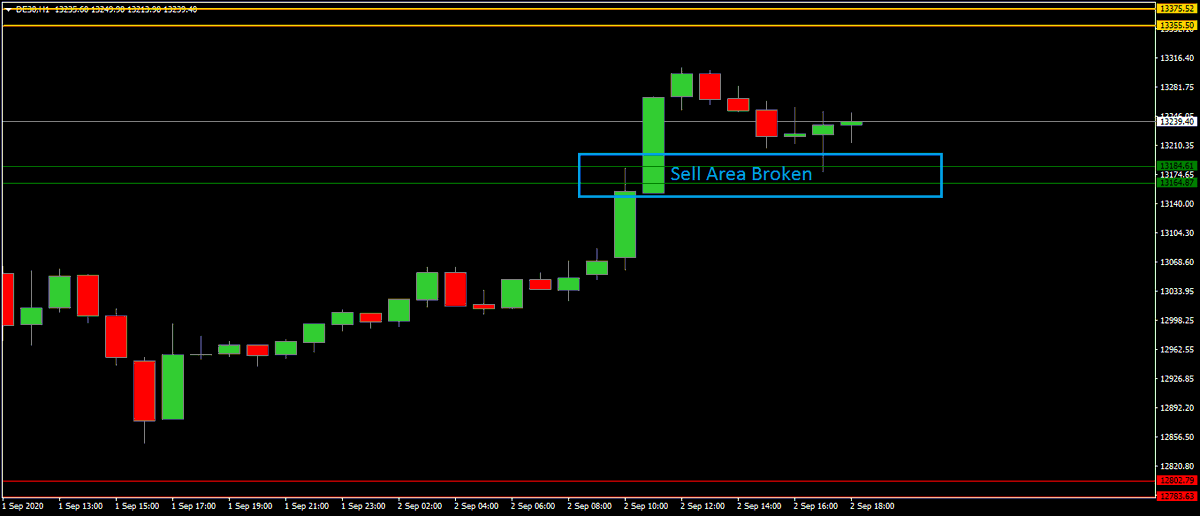
Sell Area borken this morning https://abs.twimg.com/emoji/v2/... draggable="false" alt="➡️" title="Pfeil nach rechts" aria-label="Emoji: Pfeil nach rechts"> bullish signal
But price unable to approach the next area (13355/75) https://abs.twimg.com/emoji/v2/... draggable="false" alt="➡️" title="Pfeil nach rechts" aria-label="Emoji: Pfeil nach rechts"> Slight bullish weakness
(Session in progress, not definitive)
Important bullish movement today that must be analyzed in depth
1) Intraday:
Sell Area borken this morning
But price unable to approach the next area (13355/75)
(Session in progress, not definitive)
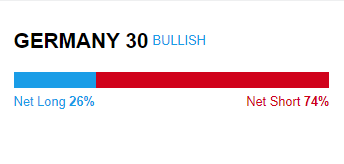
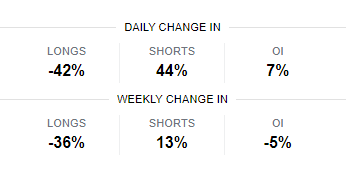
2) Contrarian Sentiment:
The bullish movement has caused a significant movement in net retail positions
Imbalance in net positions of 70% - 30%
Important percentages in intraday and weekly
Contrarian Sentiment https://abs.twimg.com/emoji/v2/... draggable="false" alt="➡️" title="Pfeil nach rechts" aria-label="Emoji: Pfeil nach rechts"> Bullish signal
The bullish movement has caused a significant movement in net retail positions
Imbalance in net positions of 70% - 30%
Important percentages in intraday and weekly
Contrarian Sentiment
3) OPEX:
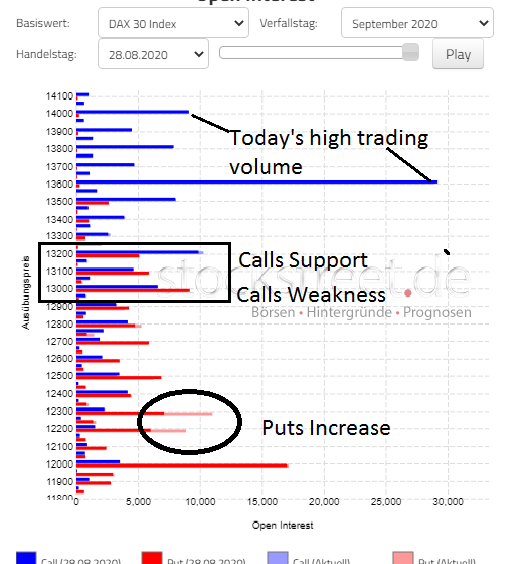
Significant Puts increase Monday and Tuesday in 12300 and 12200
Remember Sunday& #39;s options analysis
Significant trading volume today on Calls 13600 and 14000 (I can& #39;t tell right now if it& #39;s increase or decrease of open interest)
https://twitter.com/MakaveliDAX/status/1300096566544474112">https://twitter.com/MakaveliD...
4) Million dollar Chart (Part I):
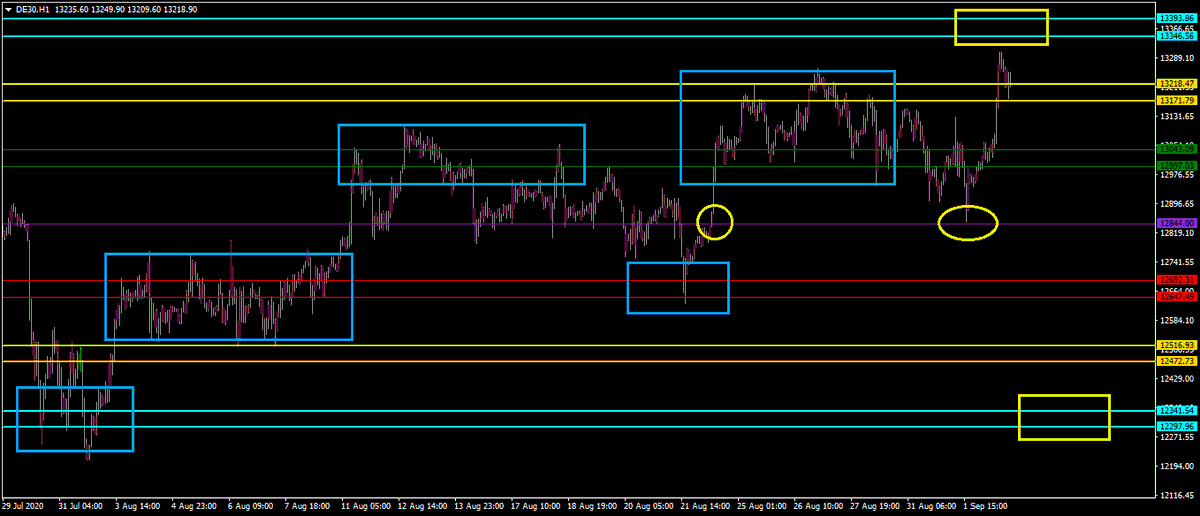
For me it& #39;s still the chart that marks the important movements in the DAX since July 30
In the chart you can see the level zones and how the price has acted with those zones
In blue, important moments
For me it& #39;s still the chart that marks the important movements in the DAX since July 30
In the chart you can see the level zones and how the price has acted with those zones
In blue, important moments
Yellow circles mark the level where it theoretically go from positive to negative (I won& #39;t explain details, sorry)
Yellow boxes mark two extreme price targets as long as the chart is still valid
Yellow boxes mark two extreme price targets as long as the chart is still valid
5) Million Dollar Chart (Part II):
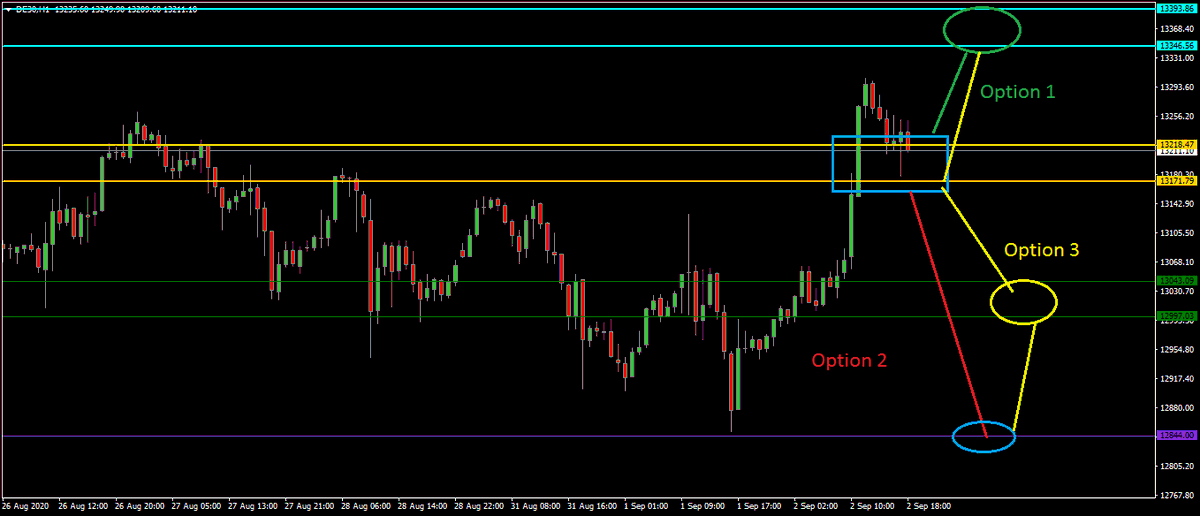
Today the price has finally managed to get above the zone 13218/171, and most importantly, stay above
With all this information I see 3 options:
Today the price has finally managed to get above the zone 13218/171, and most importantly, stay above
With all this information I see 3 options:
Maintaining the 13218/171 zone and taking advantage of the imbalance in the retail positions go this week to 13346/13393 zone
If a certain movement doesn& #39;t occur that would end this chart (details are not necessary), it would be the end of the bullish movement
Break under zone 13218/171 between today and tomorrow
In that case it could be a definitive rejection to the area and the price should go to the important level of 12844 already commented
First reach that area of 13346/93
Then when the retail sentiment starts to change to bullish and the majority sees that the price goes to the famous gap at 13500 (sorry I don& #39;t believe in gap theories, I respect them but I don& #39;t believe in them) ...
... a bearish movement starts
Zone by zone, first to 13218/171, then to 13043/12997 zone
Turning point at 12844 and acceleration of movement below the zone 12692/647
And finally target in 12341/12297
Zone by zone, first to 13218/171, then to 13043/12997 zone
Turning point at 12844 and acceleration of movement below the zone 12692/647
And finally target in 12341/12297
Option 3 is my favorite option if this Million Dollar Chart is still valid the next days
Right now it looks like science fiction... but we& #39;ll see https://abs.twimg.com/emoji/v2/... draggable="false" alt="😉" title="Zwinkerndes Gesicht" aria-label="Emoji: Zwinkerndes Gesicht">
Right now it looks like science fiction... but we& #39;ll see

 Read on Twitter
 bullish signalBut price unable to approach the next area (13355/75)https://abs.twimg.com/emoji/v2/... draggable="false" alt="➡️" title="Pfeil nach rechts" aria-label="Emoji: Pfeil nach rechts"> Slight bullish weakness(Session in progress, not definitive)" title=" $DAX Situation Analysis (thread)Important bullish movement today that must be analyzed in depth1) Intraday:Sell Area borken this morning https://abs.twimg.com/emoji/v2/... draggable="false" alt="➡️" title="Pfeil nach rechts" aria-label="Emoji: Pfeil nach rechts"> bullish signalBut price unable to approach the next area (13355/75)https://abs.twimg.com/emoji/v2/... draggable="false" alt="➡️" title="Pfeil nach rechts" aria-label="Emoji: Pfeil nach rechts"> Slight bullish weakness(Session in progress, not definitive)" class="img-responsive" style="max-width:100%;"/>
 Bullish signal" title="2) Contrarian Sentiment:The bullish movement has caused a significant movement in net retail positionsImbalance in net positions of 70% - 30%Important percentages in intraday and weeklyContrarian Sentiment https://abs.twimg.com/emoji/v2/... draggable="false" alt="➡️" title="Pfeil nach rechts" aria-label="Emoji: Pfeil nach rechts"> Bullish signal">
 Bullish signal" title="2) Contrarian Sentiment:The bullish movement has caused a significant movement in net retail positionsImbalance in net positions of 70% - 30%Important percentages in intraday and weeklyContrarian Sentiment https://abs.twimg.com/emoji/v2/... draggable="false" alt="➡️" title="Pfeil nach rechts" aria-label="Emoji: Pfeil nach rechts"> Bullish signal">
