FOOD FOR THOUGHT 20200830
In all of our analysis we are using a volume projection for Tesla that deserves further examination
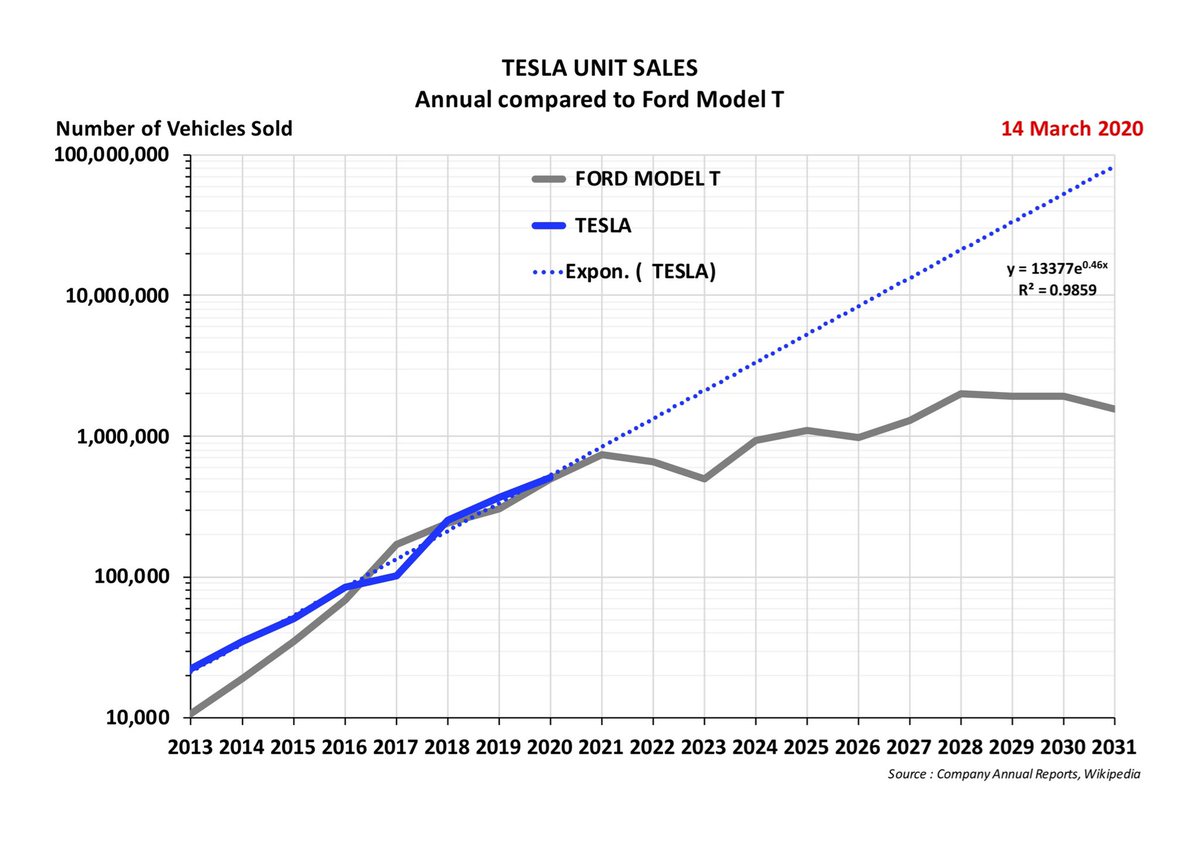
1. It is driven by observing Tesla’s historical growth
In all of our analysis we are using a volume projection for Tesla that deserves further examination
1. It is driven by observing Tesla’s historical growth
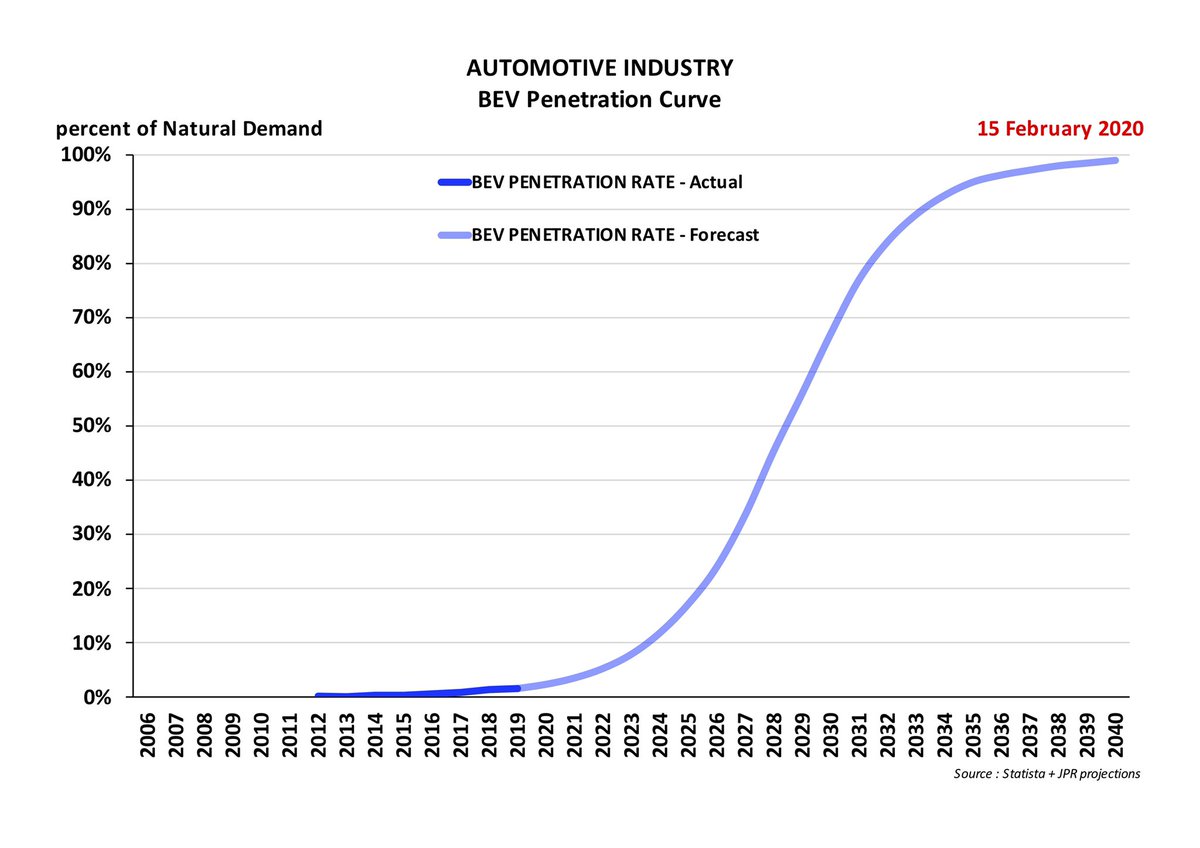
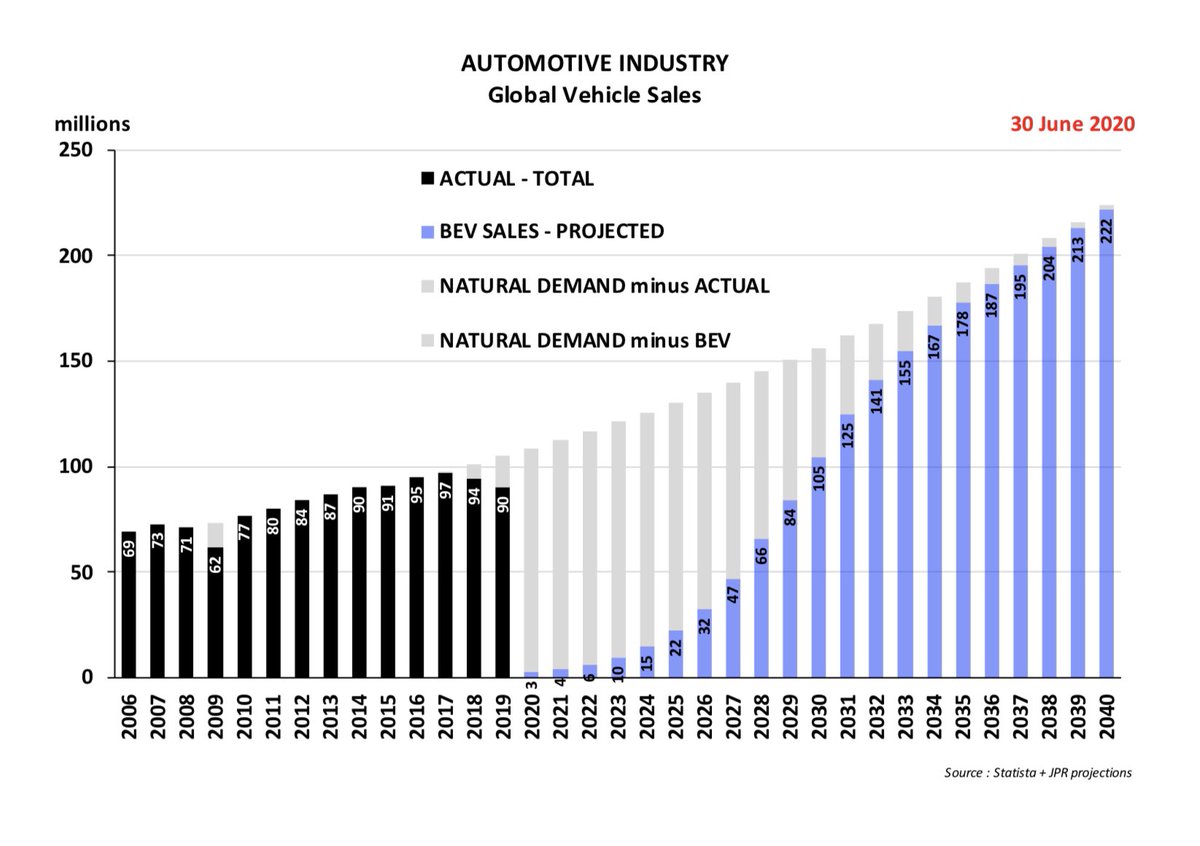
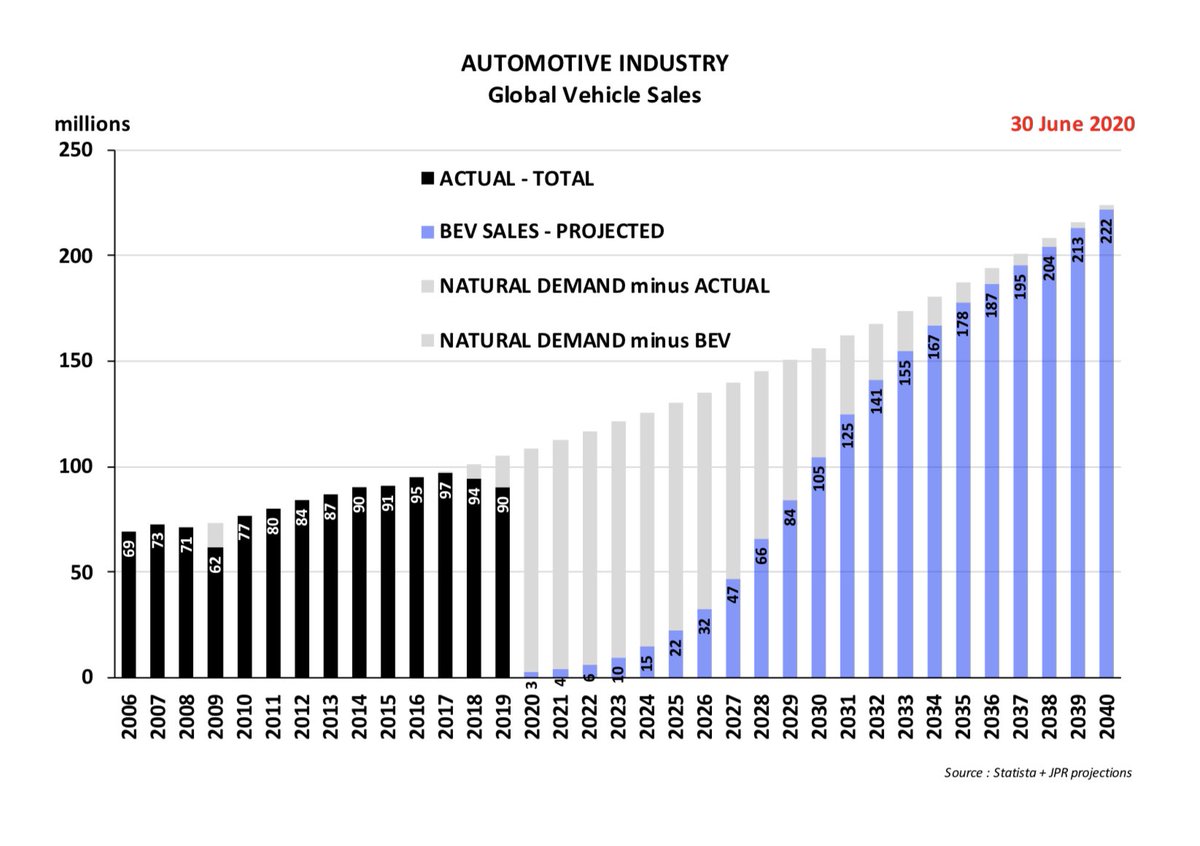
4. . . . on the assumption that the rest of the industry would be keeping up with Tesla’s growth and thereby in the aggregate they would be defining this BEV industry Penetration S-Curve
5. And then after 2027 the industry growth rates would start to reverse as the market became increasingly saturated
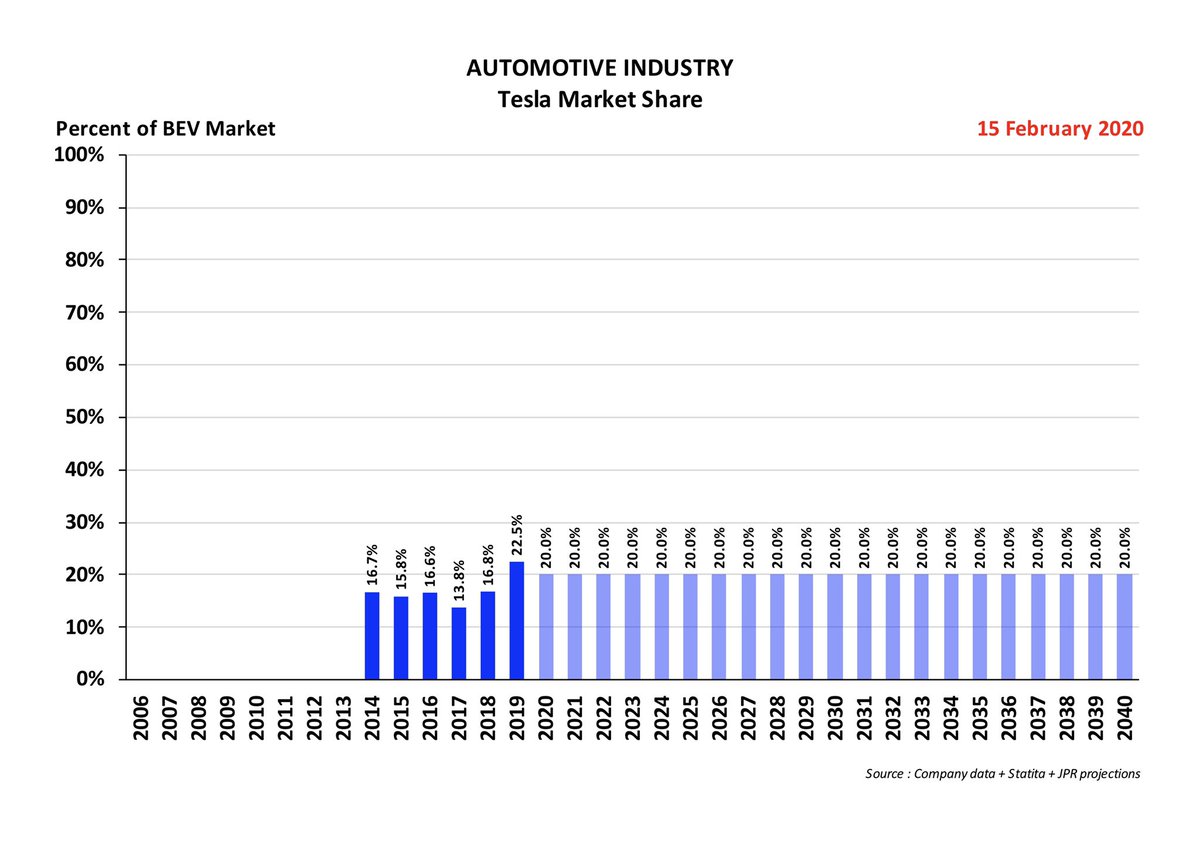
6. This approach gives us a steady 20% BEV Global Market Share GMS for Tesla out into the future, as illustrated here
7. The problem is that other automakers are already failing to keep up with Tesla’s growth
- Tesla GMS for 2019 was already reaching 22.5%
- and Tesla GMS for 2020 H1 has now risen to 28.2%
- Tesla GMS for 2019 was already reaching 22.5%
- and Tesla GMS for 2020 H1 has now risen to 28.2%
8. And the other industry participants are not projecting the necessary volumes in either their vehicle planning or their Battery Supplies
- they are running TOO SLOW
- and the Market Leader is continuing to outdistance them
- they are running TOO SLOW
- and the Market Leader is continuing to outdistance them
9. This means that industry volumes from players other than Tesla will not be at the levels of market development that we have been assuming
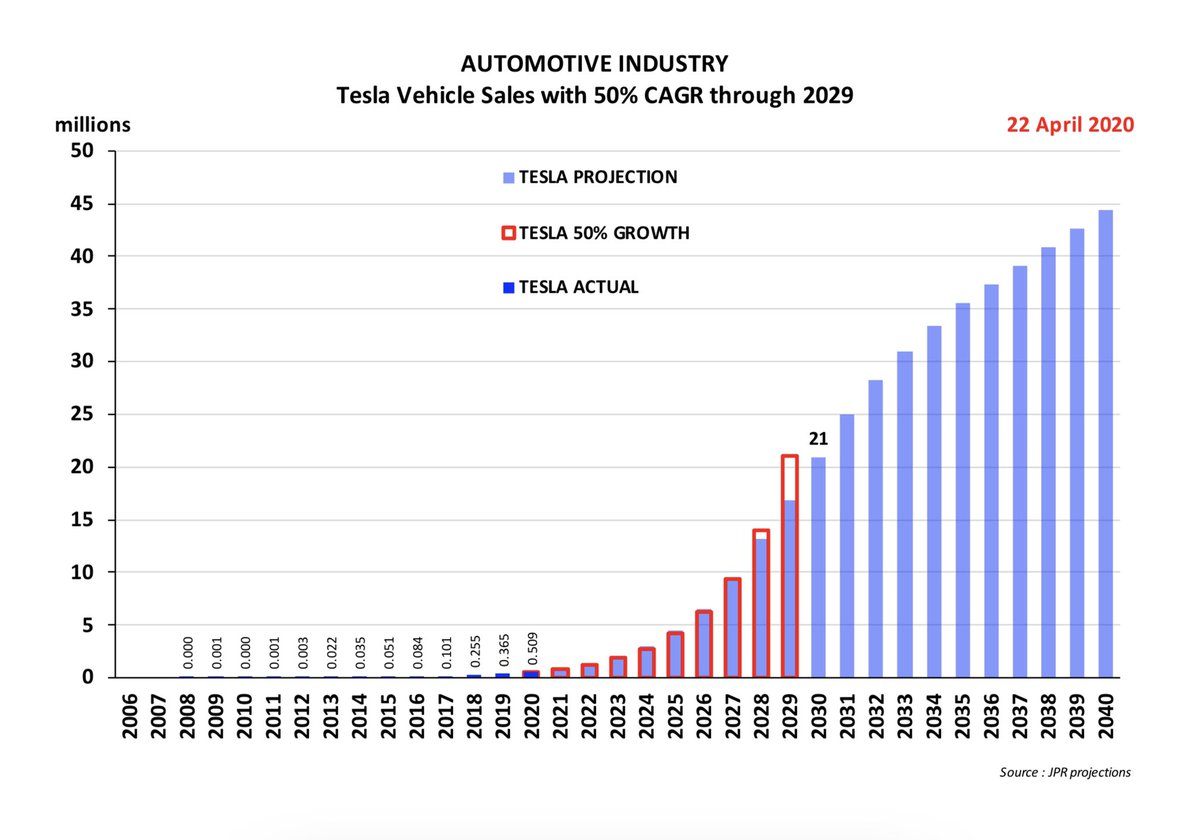
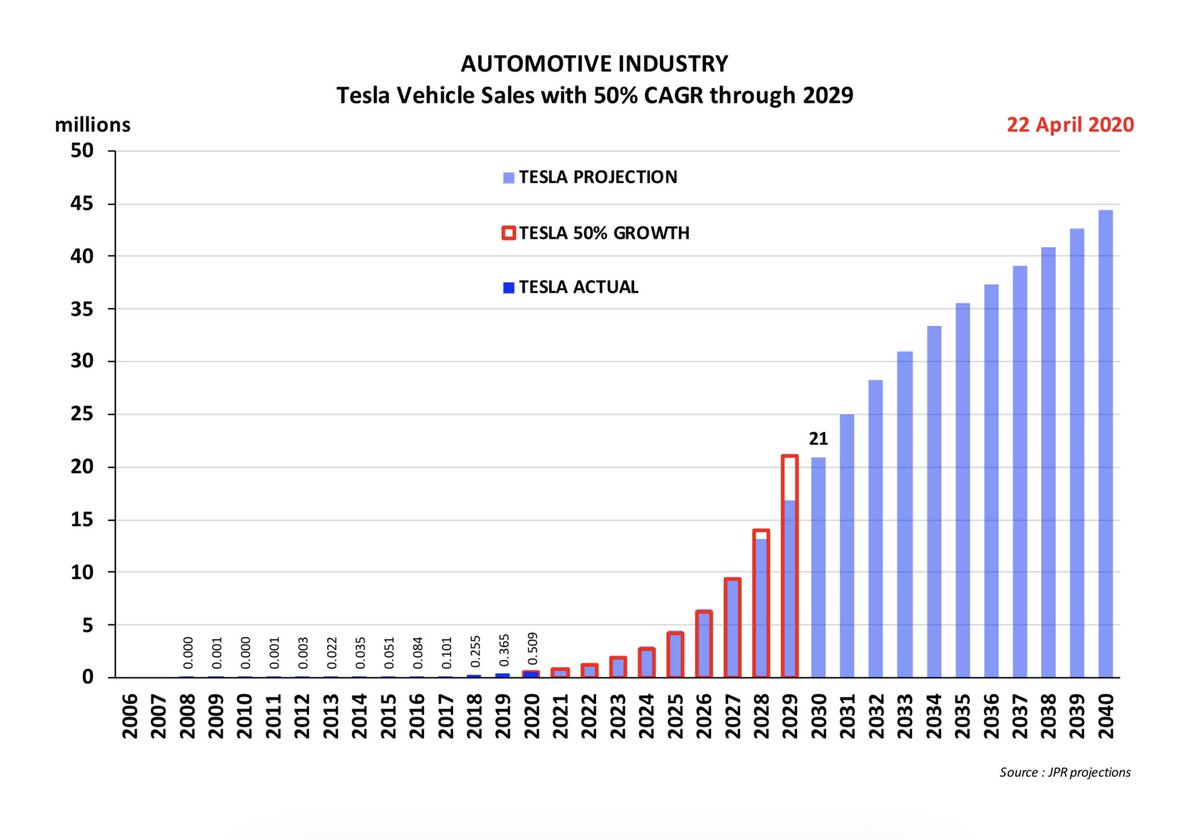
- and therefore it will not be necessary to assume the slowdown in Tesla’s growth that we have used for the Blue bars in this diagram
- and therefore it will not be necessary to assume the slowdown in Tesla’s growth that we have used for the Blue bars in this diagram
10. Therefore we must re-consider making our projections of Tesla volume at a continued +50% per annum rate of growth
- and this shows us the clear potential for Tesla to be delivering more than 20 million vehicles by 2028
- and even as much as 50 million vehicles by 2030
- and this shows us the clear potential for Tesla to be delivering more than 20 million vehicles by 2028
- and even as much as 50 million vehicles by 2030
11. These numbers are not driven by some “let’s gain market share” strategy, but are simply a practical response to compensate for the failure of other participants to supply the market with sufficient volume
- and nobody else would have sufficient scale to make that response
- and nobody else would have sufficient scale to make that response
WHAT WOULD THE IMPLICATIONS OF THIS BE ?
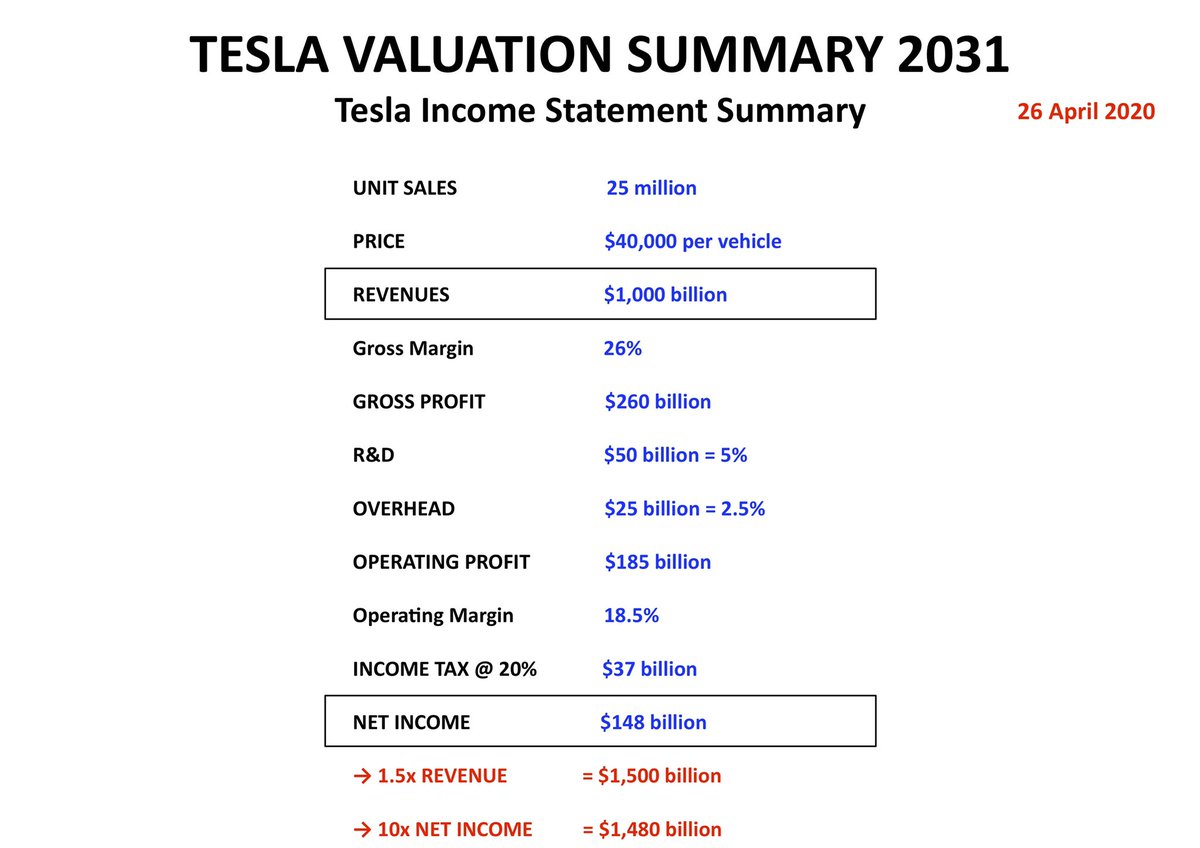
12. Just taking it at the simplest level, we can rework this 2031 chart for 2028
- with 20 million units at the same $40,000 ASP we would see $800 billion of Revenues
- with the same 26% Gross Margin we would see billion of Gross Profit
12. Just taking it at the simplest level, we can rework this 2031 chart for 2028
- with 20 million units at the same $40,000 ASP we would see $800 billion of Revenues
- with the same 26% Gross Margin we would see billion of Gross Profit
- with the same 5% R&D and 2.5% SG&A we would see the same 18.5% Operating Margin giving us $148 billion of Operating Profit
- with the same 20% Income Tax rate we would see $118.4 billion of Net Income
- with the same 20% Income Tax rate we would see $118.4 billion of Net Income
13. Applying the same Price / Sales Ratio of 1.5x would give us a 2028 Valuation of $1,200 billion
14. Applying the same Price / Earnings Ratio of 10x would give us a 2028 Valuation of $1,184 billion
14. Applying the same Price / Earnings Ratio of 10x would give us a 2028 Valuation of $1,184 billion
15. And most importantly this is happening 3 years earlier than our current 2031 Base Case
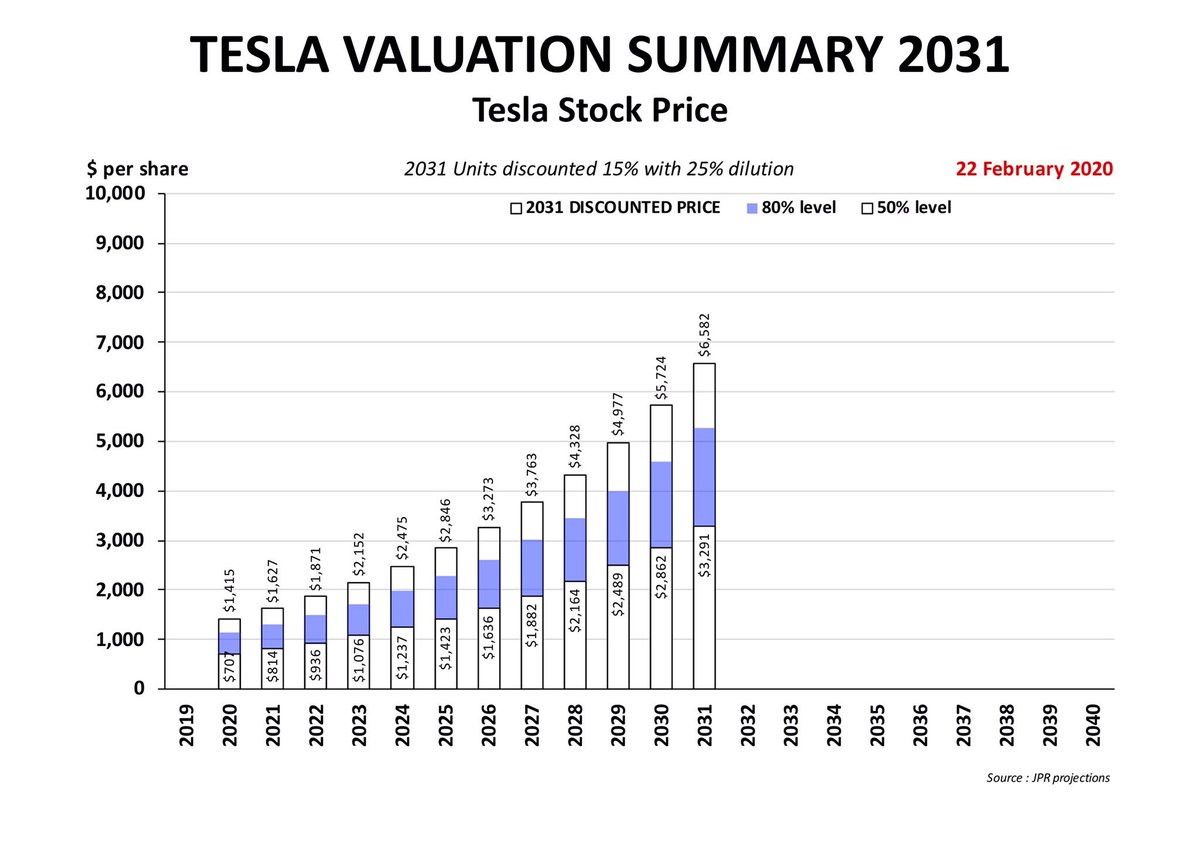
16. If we assume the same 25% dilution this would give us a 2028 Stock Price of $5,266 per share or +21.7% above the Base Case of $4,328 per share
16. If we assume the same 25% dilution this would give us a 2028 Stock Price of $5,266 per share or +21.7% above the Base Case of $4,328 per share
17. Discounting this back to 2020 today gives us $1,721 per share
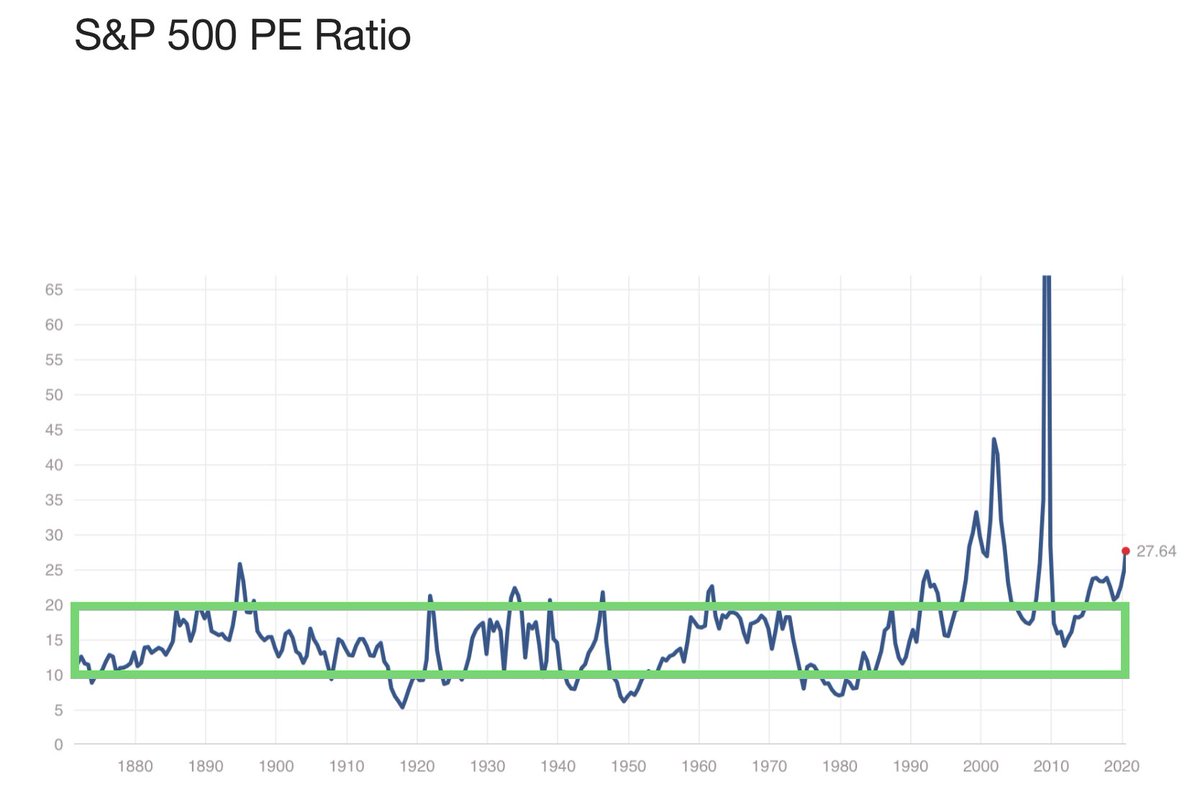
18. Now let us note once again that we have used a very conservative P/E Multiple of 10x representing the historical low end of S&P Valuations
18. Now let us note once again that we have used a very conservative P/E Multiple of 10x representing the historical low end of S&P Valuations
19. If we take instead a reasonable historical upper end of 20x for the S&P we can simply double the above valuations and get $3,442 per share in 2020
20. Either way, Slow Competitors leave value on the table for Tesla
- although our World 4.0 would prefer Fast Competitors
20. Either way, Slow Competitors leave value on the table for Tesla
- although our World 4.0 would prefer Fast Competitors

 Read on Twitter