Read this thread first. It& #39;ll blow your mind. No spoilers. I& #39;ll respond as a reply to this tweet. https://twitter.com/johncarlosbaez/status/1298274201682325509">https://twitter.com/johncarlo...
The issue is Stein& #39;s paradox. I will always think about this as Carl Morris taught me to: as an issue of batting averages.
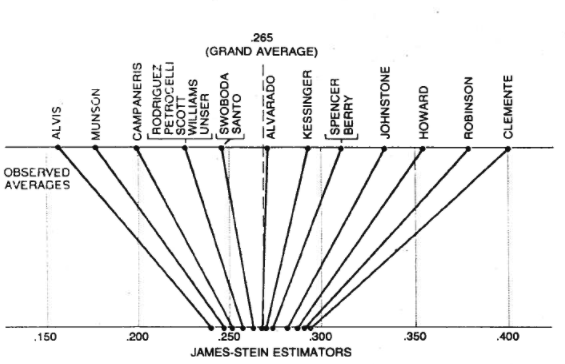
Say you have a bunch of batters, halfway through the season, and you want to predict an end-of-season batting average for each.
Say you have a bunch of batters, halfway through the season, and you want to predict an end-of-season batting average for each.
If you knew nothing about baseball ahead of time, and only had the stats for one batter, the answer is simple: your best guess for their end-of-season average is their current average. No method dominates this in mean-squared-error (MSE); the future is kinda like the past.
But if you have a bunch of batters at mid-season, it& #39;s reasonable to imagine that most of them are kinda average. In other words, your best estimate of batter A& #39;s average for the second half-season should be somewhere between A& #39;s first half-season, and the global mean.
Stein& #39;s estimator tells you how much you should "shrink" towards the global mean. Essentially, this plan only works because most batters are kinda average; so the more exceptional a batter is, the less you should move their average towards the mean.
Aak, no, this goes to show how counterintuitive all this is. Previous tweet is wrong. See if you can see why before you go on.
What I should have said is, "the more exceptional the most-exceptional batter is, the less you should move all of their averages towards the mean". Which is also intuitive, but frankly my intuition fits both versions, while only one of them is correct.
Moving on...
The really surprising thing about the James-Stein estimator is that it dominates. If you wrote a program to use the J-S estimator for batting averages, and somebody tried to trick it by including the number of meters to the moon in the list, your program still wins.
The really surprising thing about the James-Stein estimator is that it dominates. If you wrote a program to use the J-S estimator for batting averages, and somebody tried to trick it by including the number of meters to the moon in the list, your program still wins.
That is to say, your program would move its estimate of all the batting averages slightly upwards, to fit in with the moon distance; but by very little, as it would see these numbers vary by a lot overall.
Meanwhile, it would move the lowest batting average up by very slightly more than the highest batting average. On average, this would let its MSE beat the naive estimator, because the lowest-average batter is likely to regress towards the mean over the second half-season.
Essentially, what happened is
① you made a reasonable prior guess: "all the batting averages will be sorta the same";
② you checked how well your guess fit the data
③ the better it fits overall, the more you trusted your guess to fix each specific data point.
① you made a reasonable prior guess: "all the batting averages will be sorta the same";
② you checked how well your guess fit the data
③ the better it fits overall, the more you trusted your guess to fix each specific data point.
Note that this overall procedure dominates *even if your guess was kinda crazy*. Instead of guessing that all the batters would be the same, you could have guessed that anyone whose name started with a "B" would average twice as high.
This crazy version of the J-S estimator would of course lose out in practice to the J-S estimator based on expected equality. But because step ② protects you from ever trusting your prior guess by too much, it still dominates the naive estimator!
So, finally, we can answer @johncarlosbaez& #39;s question: why does this work with 3 numbers, but not with 2?
Because with 2 numbers, it& #39;s impossible to tell which one stands out more!
Because with 2 numbers, it& #39;s impossible to tell which one stands out more!
Now, all of this is handwavy explanations. Remember, halfway through this thread, I actually got the math wrong, in a way that sounds just as good intuitively. And I never mentioned the "2d random walk is recurrent but 3d is not" fact which apparently relates here. So, add salt.
Still, I think I& #39;m at least on the right track for getting an intuition as to why this works with 3 or more numbers but not with two. Just remember Big Bird! /eot
ps. Here& #39;s the article this thread was (very loosely) based on: https://www.researchgate.net/publication/247647698_Stein%27s_Paradox_in_Statistics">https://www.researchgate.net/publicati...

 Read on Twitter


