Yesterday, I had a great opportunity to present the basics of climate science to a lunchtime learning club at a Big Company. I had 10 minutes! They were hearteningly engaged.
Here are some of my slides. Two other speakers covered impacts and mitigation wonderfully. [Thread 1]
Here are some of my slides. Two other speakers covered impacts and mitigation wonderfully. [Thread 1]
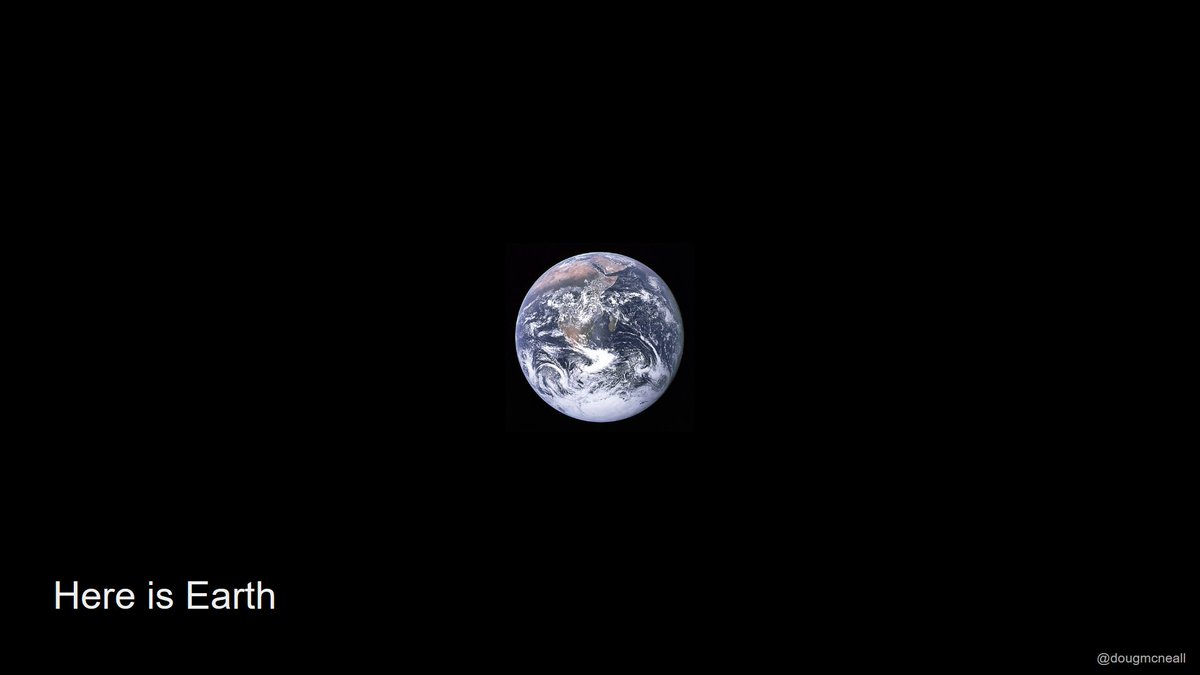
Here is the Earth, floating in space. [ https://en.wikipedia.org/wiki/The_Blue_Marble]">https://en.wikipedia.org/wiki/The_...
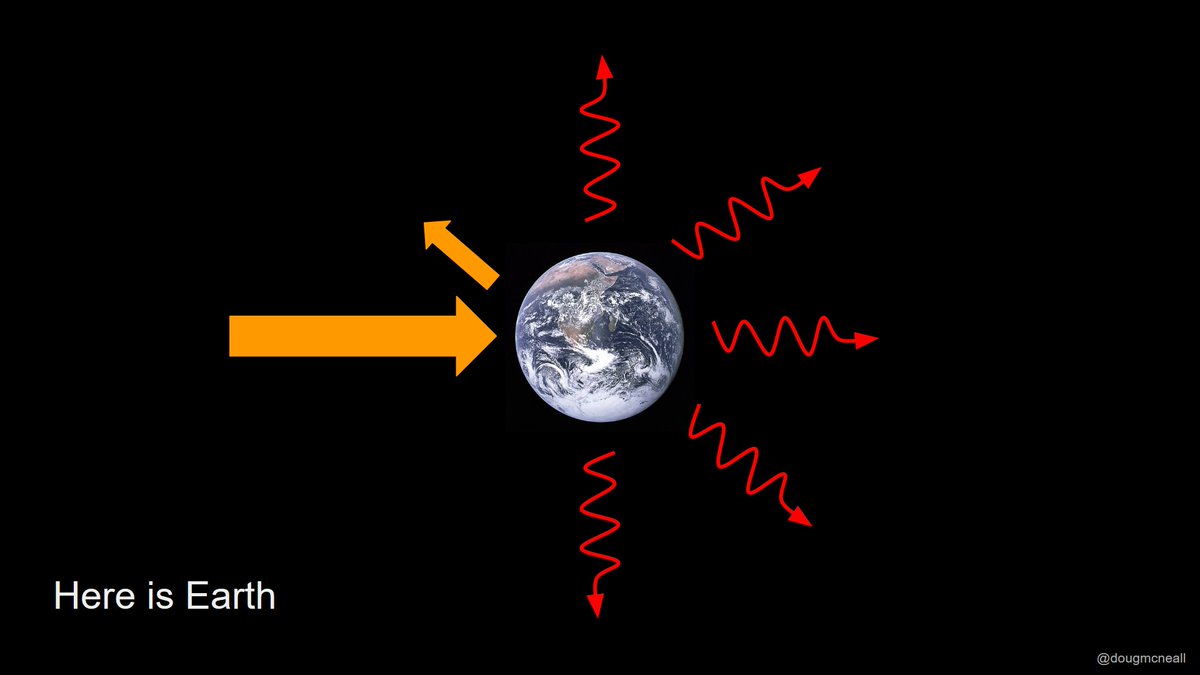
I think it& #39;s really useful to zoom out to this perspective, as we see the Earth as an isolated system. The only thing that enters or leaves the system is energy (Ok, ok, but close enough for government work).
Earth gets its energy from the sun. Over time, the energy that it receives from the sun, and the energy that it radiates away to space balance. If the energy that it radiates is less than that which it receives, it warms up, increasing radiation until balance is achieved again.
The atmosphere acts like a blanket, keeping the planet warmer than it would be otherwise. Without the resulting greenhouse effect, the average temperature of the Earth would be about -18 degrees C. With an atmosphere the Earth is at about 15 degrees C. And rising.
Joseph Fourier proposed the greenhouse effect back in 1824. #Discovery_of_the_greenhouse_effect">https://en.wikipedia.org/wiki/Joseph_Fourier #Discovery_of_the_greenhouse_effect">https://en.wikipedia.org/wiki/Jose...
Climate change is, at its core, caused by the imbalance of flows energy into and out of our isolated system.
It’s no small irony that we developed the physics to understand such a system during (and in fact due to) the industrial revolution. The same industrial revolution which enabled us to perturb the energy balance of the planet so dramatically. [End of thread 1]
The planet doesn’t receive the energy from the sun evenly - it’s concentrated in the tropics. The atmosphere and the ocean act to redistribute the energy, driving it away from the equator, towards the cold poles.
Huge, semi-stable atmospheric circulation patterns (the cells you see here) are set up. Where the air is rising, in the tropics and the midlatitudes there is low pressure and rainfall. Where the air descends, high pressure and deserts. https://www.metoffice.gov.uk/weather/learn-about/weather/atmosphere/global-circulation-patterns">https://www.metoffice.gov.uk/weather/l...
Winds drive the circulation in the oceans, the planet’s spin driving strong western boundary currents like the Gulf stream and the Agulhas current away from the equator towards the poles, where cooling, more dense water sinks, and returns in the depths. https://en.wikipedia.org/wiki/Boundary_current">https://en.wikipedia.org/wiki/Boun...
But there are more complications.
The Earth is spinning, and wobbling on its axis, and there is an uneven distribution of land and sea. There are mountains in the way of the winds, and continents in the way of the currents.
The Earth is spinning, and wobbling on its axis, and there is an uneven distribution of land and sea. There are mountains in the way of the winds, and continents in the way of the currents.
The bright ice at the poles reflects more radiation, while the dark ocean below absorbs more. The high clouds, on average, keep the radiation from escaping while the thick low clouds with cold bright tops stop it reaching the surface.
All of these things acting together mean our climate system looks the way it does.
[Thread 3]. What have we seen happen to the Earth system? In this excellent visualisation by @alxrdk we see that In the 170 years since we started taking global temperature measurements, we have seen the Earth as a whole rise in temperature by around 1 degree Celcius.
“But climate has always changed”, right?
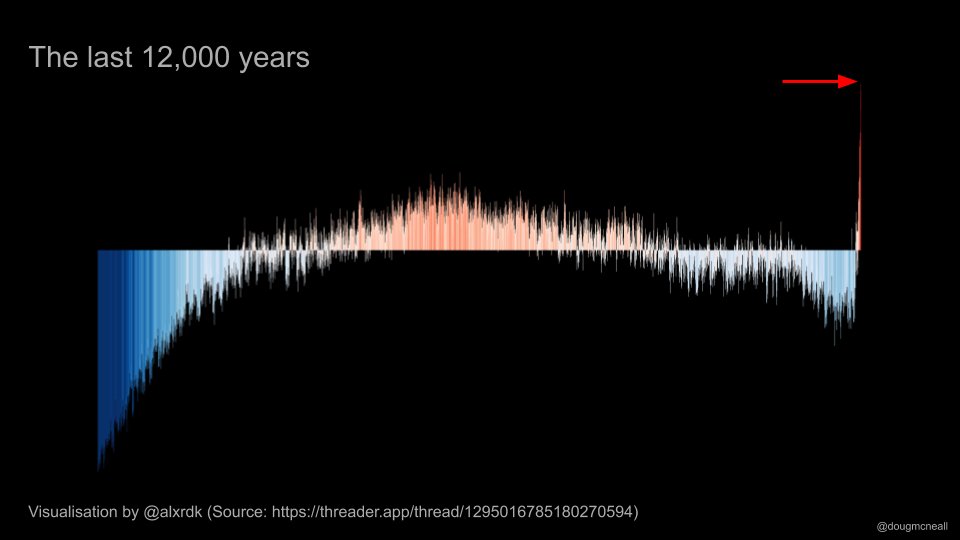
Well, yes and no. This striking image from @alxrdk plots the global temperature over the last 12,000 years. Scientists analyse ice kores kilometres long, extracting trace gases and using the ratios of certain isotopes to infer the temperature.
They combine measurements from the rings of thousand-year-old-trees, and deep ocean sediments to work out the climate conditions before there were thermometers.
At the start, the Earth is emerging from the last ice age. This long climatic cycle is well understood, driven by the interactions of the Earth’s orbit, its tilt, and the movements of the ice sheets, continents and greenhouse gases between the land, the ocean and atmosphere.
For around 8k years the climate was relatively stable, cooling slightly. The industrial revolution released huge amounts of greenhouse gases locked underground for millenia into the atmosphere, enhancing the greenhouse effect, and warming the planet at an unprecedented rate.
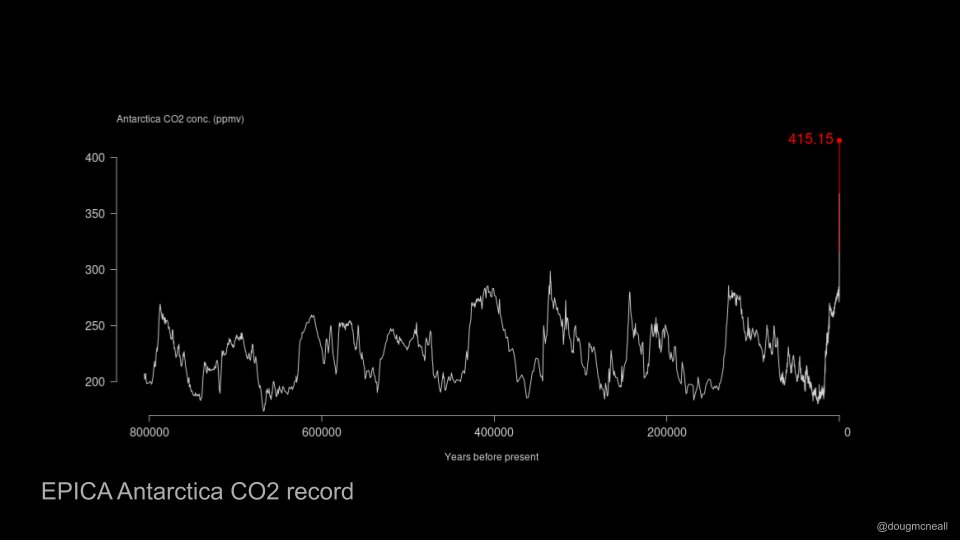
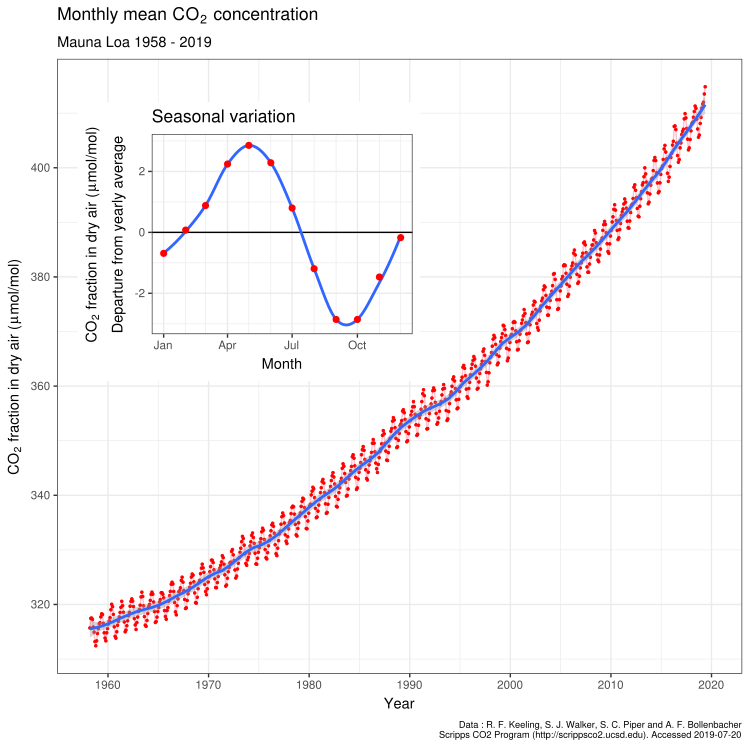
In this record of CO2 from bubbles trapped in Antarctic ice and laid down over millenia, we can see how the amount of CO2 has varied over 800,000 years .It mirrors the climate variations of the ice ages, getting to around 280 ppm before spiking in the last part of the record.
The red line is recent observations from Mauna Loa, overlaid on the paleoreconstruction. This increase isn& #39;t showing any signs of slowing down. It creates an energy imbalance in the Earth system, and the Earth system warms. It gains *energy*. It *heats*.
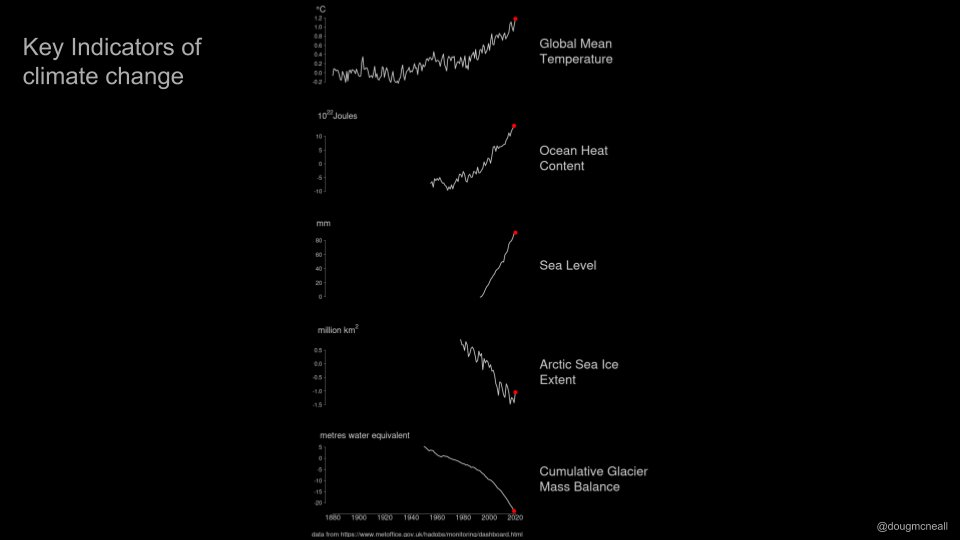
And the heating has consequences. Wherever we look in the Earth system, we see the consequences of additional heat. The ocean warms up at the surface, but also at the depths. Warmer water expands, raising sea level.
Ice on land in glaciers melts, further raising sea levels, changing mountain ecosystems, and potentially disrupting the water supplies of some of the most populous places on the planet.
Sea ice melts, exposing darker water below that absorbs heat more readily.
[Thread 4] How long have we known about this? A long time. @ed_hawkins great visualisation shows surface temperature observations since 1850. White areas are missing observations. It& #39;s easy to see though how the surface has warmed (red areas) through time.
The poles warm faster than the midlatitudes, and the land surface warms faster than the oceans. These are well understood and predicted by our knowledge of the physics of the Earth system.
Ed& #39;s plot serves as a useful timeline for some of the important early discoveries in climate science.
1856 Eunice Newton Foote, amateur scientist and women’s suffrage campaigner, demonstrated that CO2 trapped the sun’s heat, and speculated that it might have an effect on climate. https://en.wikipedia.org/wiki/Eunice_Newton_Foote">https://en.wikipedia.org/wiki/Euni...
You might not be surprised to hear that the credit for the discovery went to a man - John Tyndall, who published similar (though more technically advanced) observations in 1861. https://en.wikipedia.org/wiki/John_Tyndall">https://en.wikipedia.org/wiki/John...
[bonus material, John Tyndall was "accidentally" killed by an overdose, administered by his young wife. She never did get round to finishing his biography.]
In 1896, Svante Arrhenius [apparently an ancestor of @GretaThunberg] made the first calculation of the amount of warming caused by CO2 in the atmosphere. He calculated too high, we know now. https://en.wikipedia.org/wiki/Svante_Arrhenius">https://en.wikipedia.org/wiki/Svan...
In 1938, Guy Stewart Callendar, a British amateur scientist, correlated observations of rising temperatures over the previous 50 years with rising CO2 measurements, to calculate how much warming was caused by the extra CO2. https://en.wikipedia.org/wiki/Guy_Stewart_Callendar">https://en.wikipedia.org/wiki/Guy_...
In 1958, Charles Keeling started the modern continuous record of CO2 in the atmosphere, at the top of Mauna Loa in the Pacific, far from sources of atmospheric pollution, demonstrating a steady increase.
In 1967, Syukuro Manabe and Richard Wetherald published an estimate of the effect of doubling CO2 in the atmosphere using the first modern climate model, run on a supercomputer. [ps, you will never be as cool as Manabe is here]
By the time 1979 rolled around and your faithful tweeter was born (and, incedentally the Charney Report was published), we had a really good idea of what would happen to the climate system. #Charney_Report">https://en.wikipedia.org/wiki/Jule_Gregory_Charney #Charney_Report">https://en.wikipedia.org/wiki/Jule...
Climate scientists have continued to make great strides, but perhaps we& #39;ll save the more modern history for another thread. https://en.wikipedia.org/wiki/History_of_climate_change_science">https://en.wikipedia.org/wiki/Hist...
[Thread 5] Back to the consequences of a heating climate. One striking example is the ongoing loss of late-summer sea ice in the Arctic. The last 4 decades have seen a loss the size of India, Bangladesh and Bhutan combined.
Many credible projections put the complete loss of late-summer Arctic sea ice around the middle of this century. Arctic climate change will have huge impacts on the ecosystems and people that live there.
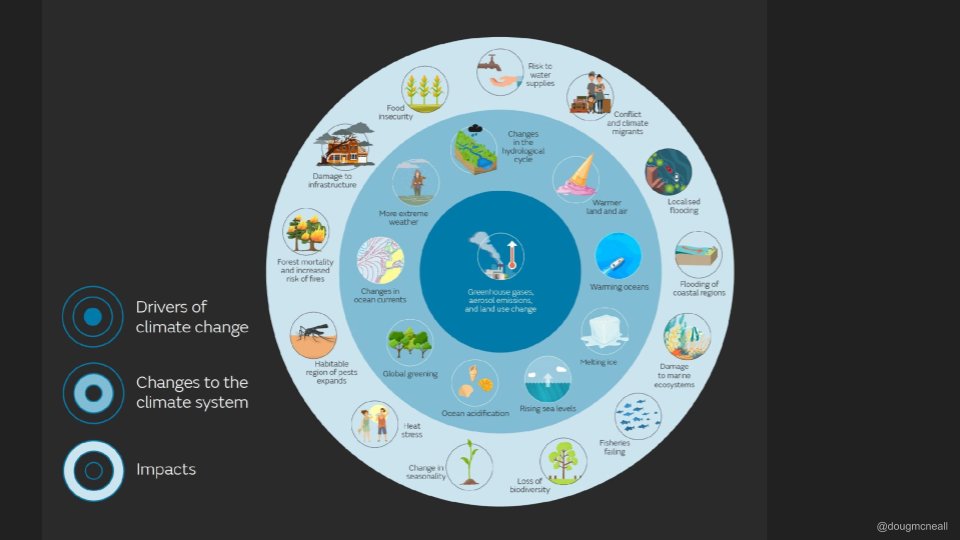
Wherever we look, we already see the impacts of a changing climate on ecosystems, human systems and people. Many will grow worse in the next century, even if we manage to mitigate or adapt to the worst.
Climate change impacts effect us all, but hit the most vulnerable the hardest.
Impacts often manifest through extreme events. Climate is the statistical *distribution* of weather, not the average.
We see fewer cold extremes, but more warm extremes, and more extreme rainfall events, even compared to the last years of the 20th Century. https://www.ncdc.noaa.gov/bams ">https://www.ncdc.noaa.gov/bams"...
We see fewer cold extremes, but more warm extremes, and more extreme rainfall events, even compared to the last years of the 20th Century. https://www.ncdc.noaa.gov/bams ">https://www.ncdc.noaa.gov/bams"...
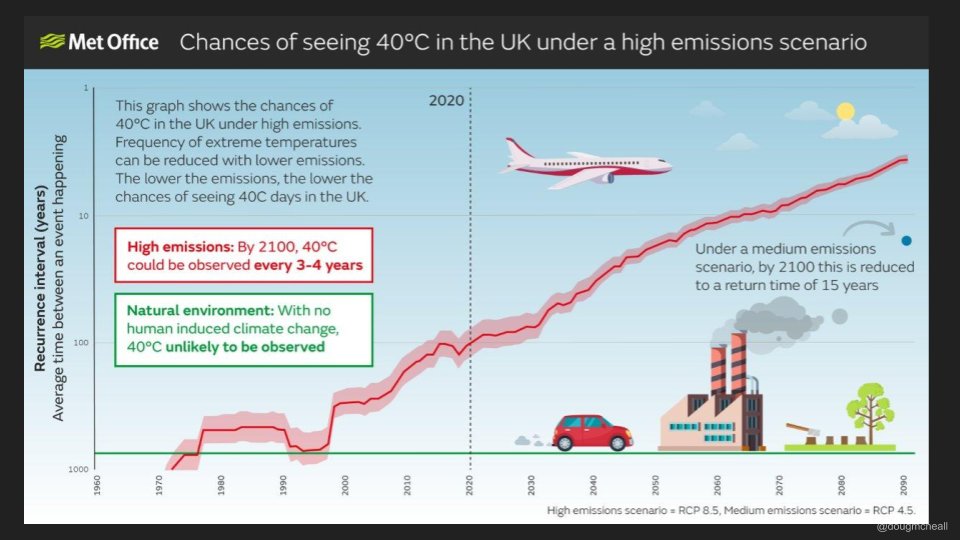
To bring the impacts closer to home, my colleagues recently studied the chances of seeing a 40 degree C day in the UK. They found that the risks had increased over the last decades, from being roughly a 1 in 1000 year event, to being a 1 in 100 year event.
Projecting forward, under a [perhaps unrealistically] high emissions scenario they found that such an event might occur every 3 - 4 years. Under a more moderate emissions scenario, this reduces to once every 15 years.
... but while I was wring the talk, @leschwartzberg summed the whole thing up even more concisely.
Thanks for reading this far [end of threads].
Thanks for reading this far [end of threads].

 Read on Twitter
![Yesterday, I had a great opportunity to present the basics of climate science to a lunchtime learning club at a Big Company. I had 10 minutes! They were hearteningly engaged.Here are some of my slides. Two other speakers covered impacts and mitigation wonderfully. [Thread 1] Yesterday, I had a great opportunity to present the basics of climate science to a lunchtime learning club at a Big Company. I had 10 minutes! They were hearteningly engaged.Here are some of my slides. Two other speakers covered impacts and mitigation wonderfully. [Thread 1]](https://pbs.twimg.com/media/Egajux5WAAEr_qP.jpg)
![[Thread 2] Zooming in a little, the Earth is more complex. [Thread 2] Zooming in a little, the Earth is more complex.](https://pbs.twimg.com/media/Egat5KDXYAEvbBn.jpg)
![[Thread 3]. What have we seen happen to the Earth system? In this excellent visualisation by @alxrdk we see that In the 170 years since we started taking global temperature measurements, we have seen the Earth as a whole rise in temperature by around 1 degree Celcius. [Thread 3]. What have we seen happen to the Earth system? In this excellent visualisation by @alxrdk we see that In the 170 years since we started taking global temperature measurements, we have seen the Earth as a whole rise in temperature by around 1 degree Celcius.](https://pbs.twimg.com/media/Egav1hfX0AIPiua.jpg)

![In 1967, Syukuro Manabe and Richard Wetherald published an estimate of the effect of doubling CO2 in the atmosphere using the first modern climate model, run on a supercomputer. [ps, you will never be as cool as Manabe is here] In 1967, Syukuro Manabe and Richard Wetherald published an estimate of the effect of doubling CO2 in the atmosphere using the first modern climate model, run on a supercomputer. [ps, you will never be as cool as Manabe is here]](https://pbs.twimg.com/media/Ega61D1XsAAn95t.jpg)
![[Thread 5] Back to the consequences of a heating climate. One striking example is the ongoing loss of late-summer sea ice in the Arctic. The last 4 decades have seen a loss the size of India, Bangladesh and Bhutan combined. [Thread 5] Back to the consequences of a heating climate. One striking example is the ongoing loss of late-summer sea ice in the Arctic. The last 4 decades have seen a loss the size of India, Bangladesh and Bhutan combined.](https://pbs.twimg.com/media/Ega-rQmXsAAKch1.jpg)

![To sum up, there are 3 numbers that you might want to take away from this [talk] twitter thread ... To sum up, there are 3 numbers that you might want to take away from this [talk] twitter thread ...](https://pbs.twimg.com/media/EgbB9NiXYAAZmI7.png)
![... but while I was wring the talk, @leschwartzberg summed the whole thing up even more concisely. Thanks for reading this far [end of threads]. ... but while I was wring the talk, @leschwartzberg summed the whole thing up even more concisely. Thanks for reading this far [end of threads].](https://pbs.twimg.com/media/EgbCoYHXcAI_8WS.jpg)


