It made me curious, that swipe at tenured professors and their cost that appeared in the August 7 Politico roundup on the damage the Covid-19 lockdowns and recession are doing to young people& #39;s educations and career and life prospects.
So I went back to the relevant IPEDS data files to see what facts might be brought to light about the place of tenure and tenured professors in U. S. higher education. Here& #39;s what I found.
@MeghanKRoberts @SheenaGreitens @AaronRHanlon @ryanroxx @rbthisted
@MeghanKRoberts @SheenaGreitens @AaronRHanlon @ryanroxx @rbthisted
1/ In fall 2018 the IPEDS counted a higher education workforce of 3,507,485 employees in a universe of 3,585 degree-granting institutions with 15 or more full-time staff.
2/ Of the 3.51 million employees:
154,973 (4.4%) were tenured full-time (full) professors,
305,183 (8.7%) were tenured instructional staff (full- or part-time) at any academic rank, . . .
154,973 (4.4%) were tenured full-time (full) professors,
305,183 (8.7%) were tenured instructional staff (full- or part-time) at any academic rank, . . .
3/ . . . and 325,640 (9.3%) were tenured—whether employed full- or part-time, at any academic rank, in any staff category.
Here& #39;s a complete run-down of the percentage of staff in each occupational category.
Here& #39;s a complete run-down of the percentage of staff in each occupational category.
4/ Full-time senior administrators (Management) were 7.2% of all staff, 1.6 times greater than the senior tenured professors. And at 31.3% of all staff, other non-teaching professionals bulked more than 3 times larger than the entire tenured staff.
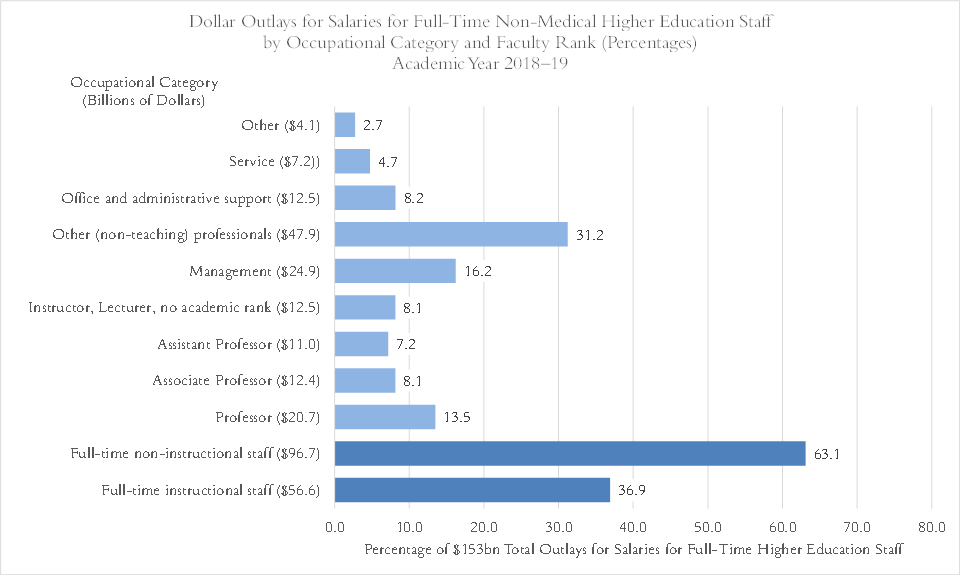
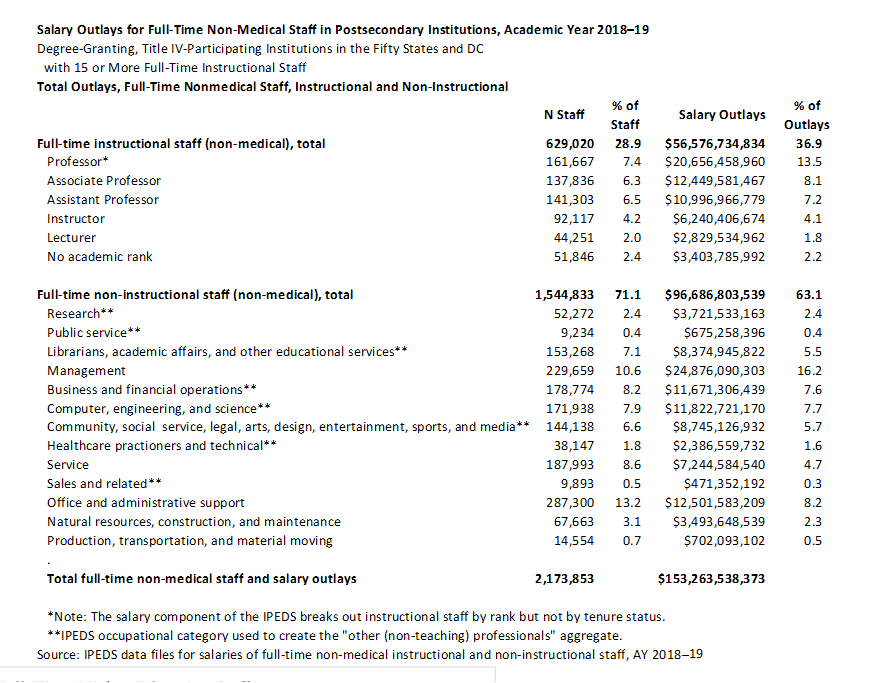
5/ What about costs? The IPEDS provide data on aggregate salary outlays for full-time non-medical instructional and non-instructional staff, broken out by occupational category and (for instructional staff) academic rank (but not tenure status).
6/ In 2018, salary outlays for degree-granting institutions with 15 or more full-time staff totaled $153.26 billion for 2.17 million FT non-medical staff--$56.58 billion for 629,020 instructional staff and $96.68 billion for 1,554,833 non-instructional staff.
7/ Senior instructional staff at the rank of professor claimed 7.4% of full-time non-medical staff and 13.5% of salary outlays. Senior administrators (Management) claimed 10.6% of staff and 16.2% of salary outlays.
6/ Here& #39;s a detailed breakdown in tabular form. The "other non-teaching professionals" aggregate, with 31.2% of salary outlays, was 34.9% of full-time non-medical staff.
7/ Higher education staff carry out their work in local institutions, and averaging across the system masks significant local variance. For the intrepid, the following charts disaggregate selected of these data to the institution level.
8/ Of the 3,585 institutions:
Tenured staff varied from 0% (1,524 institutions) to 54.8% of staff (1 institution).
The 1,524 institutions with no tenured staff were 42.1% of institutions. (Cont.)
Tenured staff varied from 0% (1,524 institutions) to 54.8% of staff (1 institution).
The 1,524 institutions with no tenured staff were 42.1% of institutions. (Cont.)
9/ 657 institutions (18.3%) had between 0% and 10% tenured staff
799 institutions (22.3%) had between 10% and 15%
464 institutions (12.9%) had between 15% and 20%
141 institutions (3.9%) had more than 20%
799 institutions (22.3%) had between 10% and 15%
464 institutions (12.9%) had between 15% and 20%
141 institutions (3.9%) had more than 20%
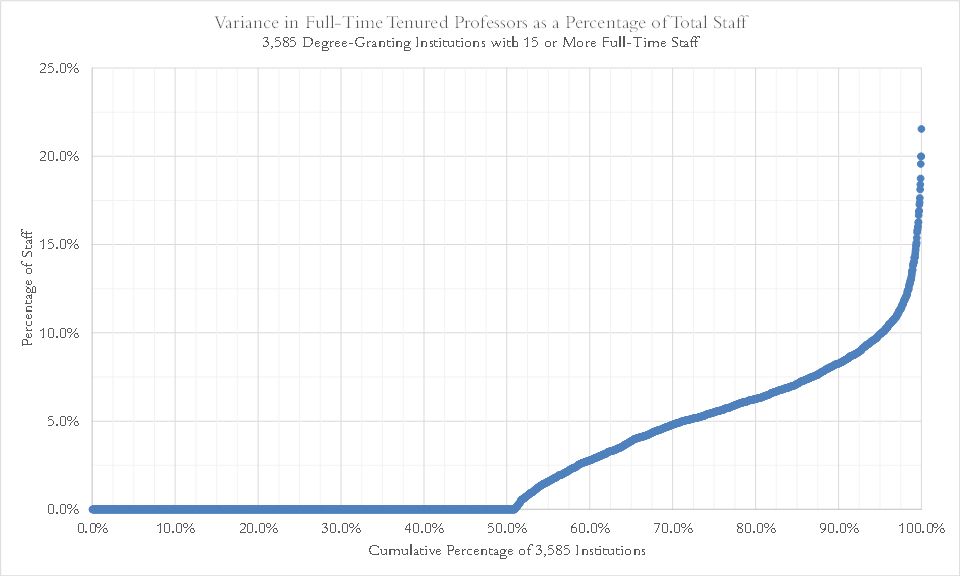
10/ Tenured staff at the rank of (full) Professor varied from 0% (1,827 institutions) to 21.6% of all staff (1 institution).
The 1,827 institutions with no tenured professors were 51.0% of the 3,585 institutions. (Cont.)
The 1,827 institutions with no tenured professors were 51.0% of the 3,585 institutions. (Cont.)
11/ Institutions with:
>0% to 5.0% tenured professors: 725 institutions (20.2%)
>5.0% to 10.0%: 861 institutions (24.0%)
>10.0%: 172 institutions (4.8%)
>0% to 5.0% tenured professors: 725 institutions (20.2%)
>5.0% to 10.0%: 861 institutions (24.0%)
>10.0%: 172 institutions (4.8%)
(The universe behind this analysis: 3,585 degree-granting, Title IV-participating, two- and four-year, public, private nonprofit, and private for-profit institutions in the fifty states and the District of Columbia with 15 or more full-time staff.)
(In addition to the staff counted here, 642 of the 3,585 institutions employed 179,919 graduate student teaching assistants; 485 of the institutions employed 148,869 graduate student research assistants.)

 Read on Twitter


