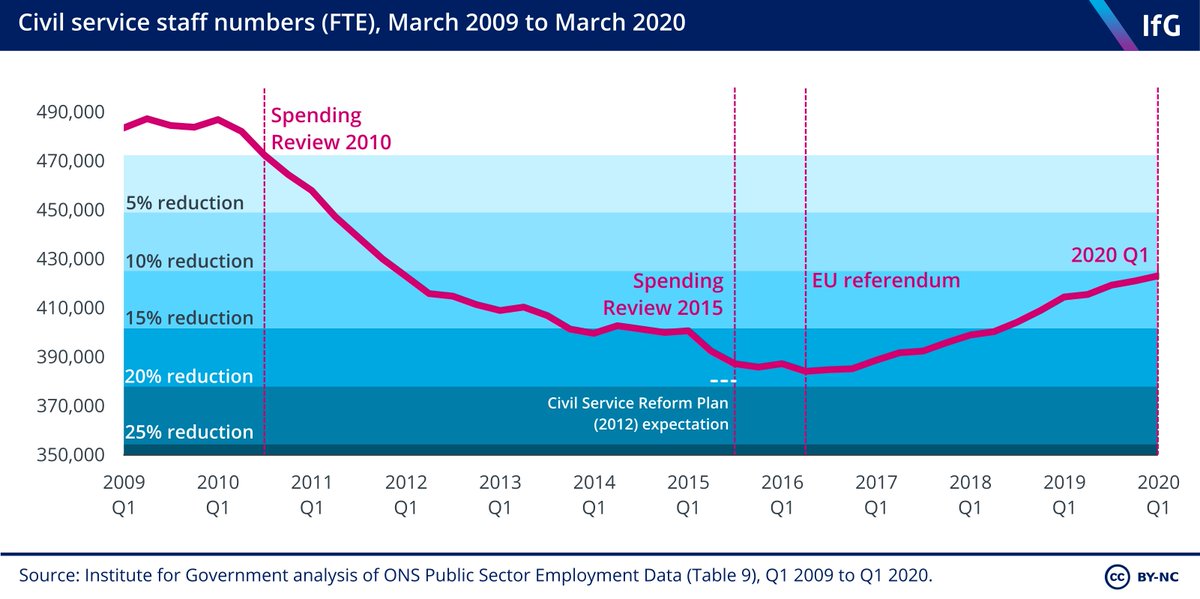
There were 423,050 civil servants at the end of March 2020.
But what else has happened to the civil service in the past year?
Well, the latest civil service stats have been published this morning- @instituteforgov will be analysing today- so keep an eye out for more...
But what else has happened to the civil service in the past year?
Well, the latest civil service stats have been published this morning- @instituteforgov will be analysing today- so keep an eye out for more...
I& #39;ll be updating this thread with key stats, key charts, and some quick analysis- and do follow m& #39;colleagues @GavinFreeguard @ben_guerin @Ollie_Davies7, who are already hard at work
First up: the grade profile of the civil service.
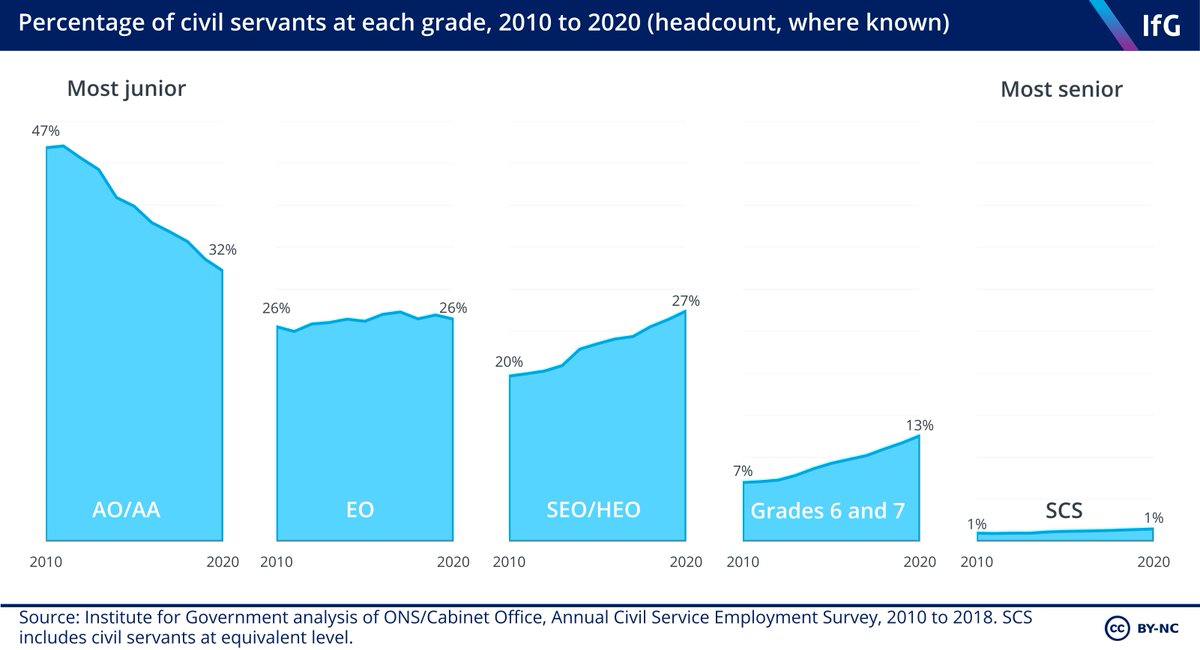
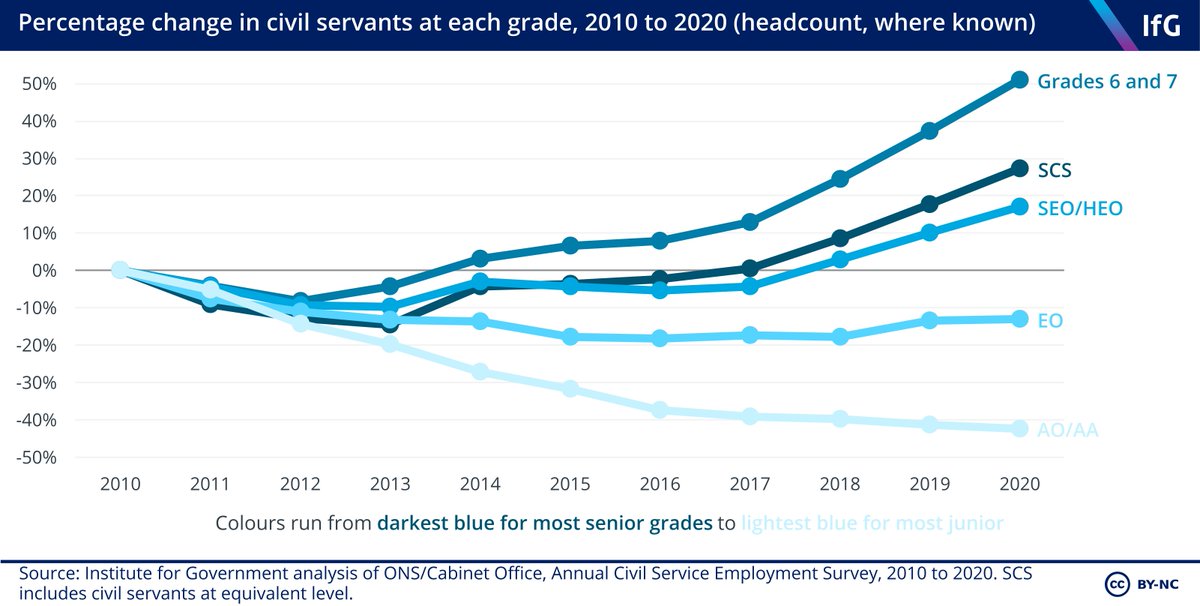
Over the last year, we& #39;ve seen a continuation of previous trends: the civil service is becoming more senior.
Proportion at the most junior AO/AA level is down since 2010; proportion at higher SEO/HEO G6/7 and SCS is up
Over the last year, we& #39;ve seen a continuation of previous trends: the civil service is becoming more senior.
Proportion at the most junior AO/AA level is down since 2010; proportion at higher SEO/HEO G6/7 and SCS is up

 Read on Twitter


