LONG THREAD: @BerkeleyLab’s updated compilation of wind power data and trends is out. A briefing deck, data file, and data visualizations can all be found at http://windreport.lbl.gov/ .">https://windreport.lbl.gov/">... #windpower @awea 1/14
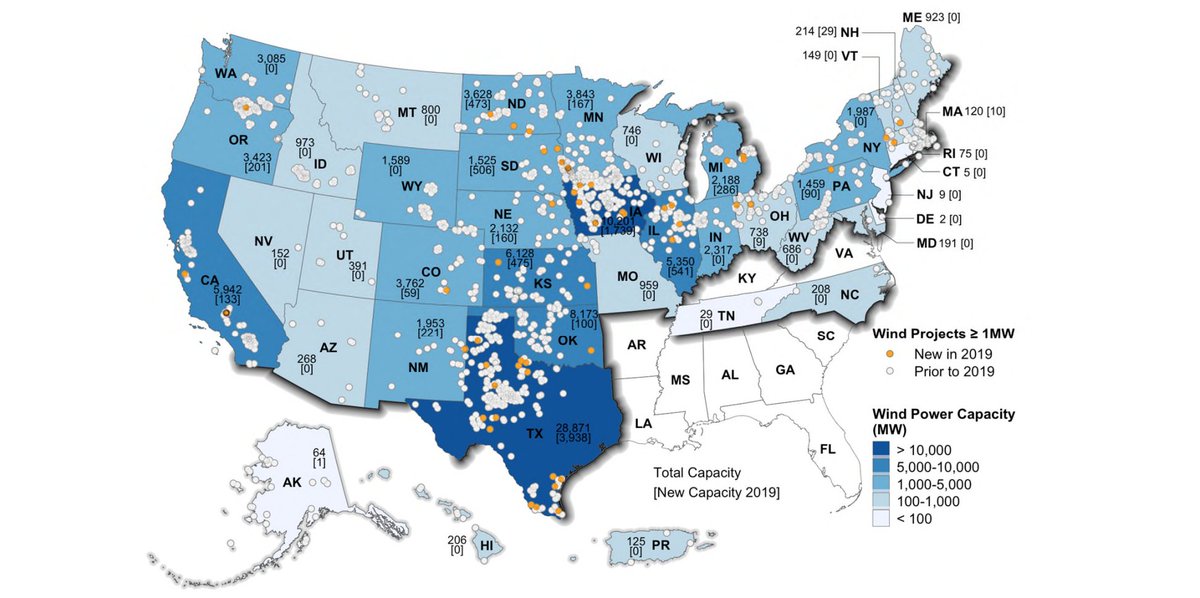
GROWTH TRENDS: US #windpower capacity continued to grow in 2019, with $13 billion invested in over 9 GW of capacity. Wind is now over 7% of US generation, more than 10% in 14 states, and more than 40% in 2 states—Iowa and Kansas. Data available at http://windreport.lbl.gov/ ">https://windreport.lbl.gov/">... 2/x
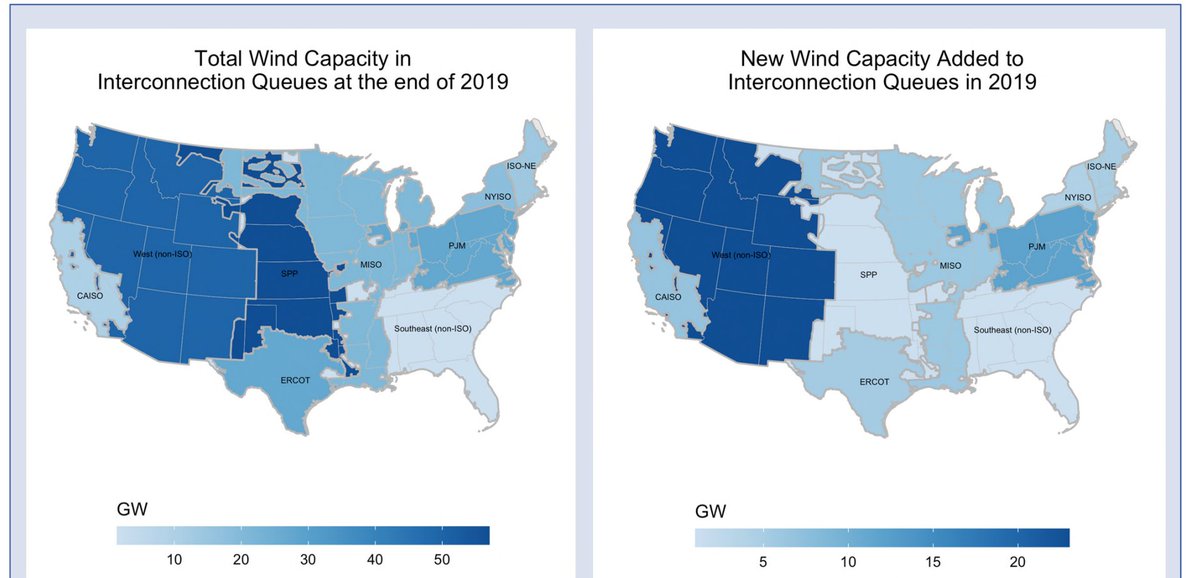
The US has more than 225 GW of wind capacity in transmission interconnection queues. 5% of this is paired with storage. More details in the new @BerkeleyLab data resource at http://windreport.lbl.gov/ ">https://windreport.lbl.gov/">... 3/x
Independent analysts project significant new wind growth in 2020 and 2021, followed by some market contraction as federal incentives are scheduled to phase out. See our new data resource at http://windreport.lbl.gov/ ">https://windreport.lbl.gov/">... 4/x
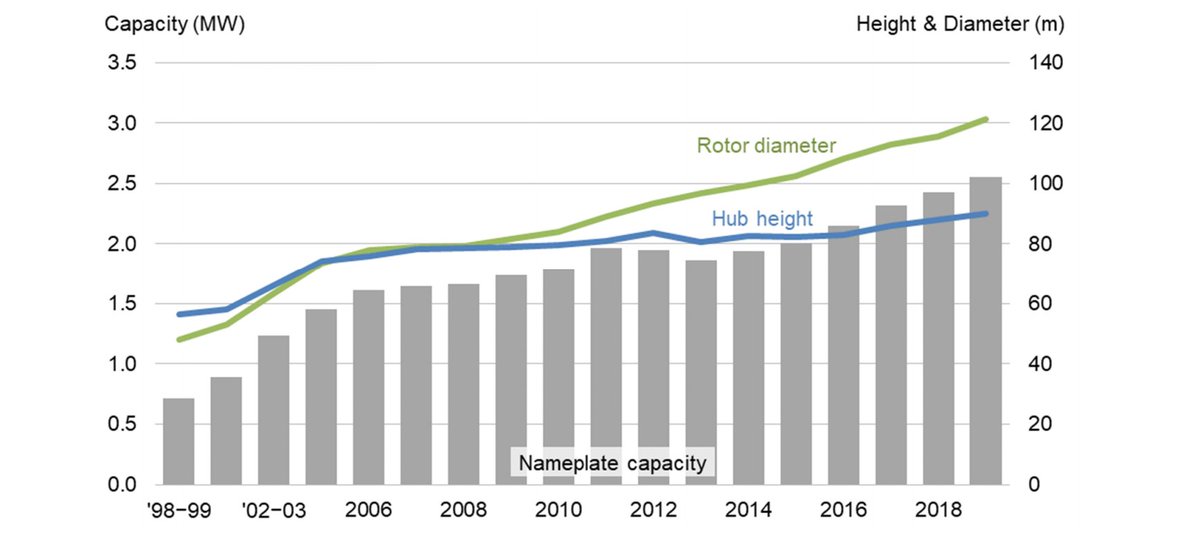
TECHNOLOGY: Turbines just keep getting bigger. Thanks to longer blades, swept area has more than doubled since 2010, driving better performance. All the latest trends in US #windpower in our new data compilation, including many visualizations, at http://windreport.lbl.gov/ ">https://windreport.lbl.gov/">... 5/x
Even larger wind turbines are on the horizon, according to project applications filed with the @FAANews. Many proposed turbines will be over 650 feet tall, ground to tip. Berkeley Lab’s new data resource on wind energy in the U.S. is at http://windreport.lbl.gov/ ">https://windreport.lbl.gov/">... 6/x
Bigger wind turbines means more energy output. Average capacity factors are over 40% for recently built projects. New data resources, including briefing slide deck, data file, and numerous visualizations can all be found at http://windreport.lbl.gov/ ">https://windreport.lbl.gov/">... 7/x
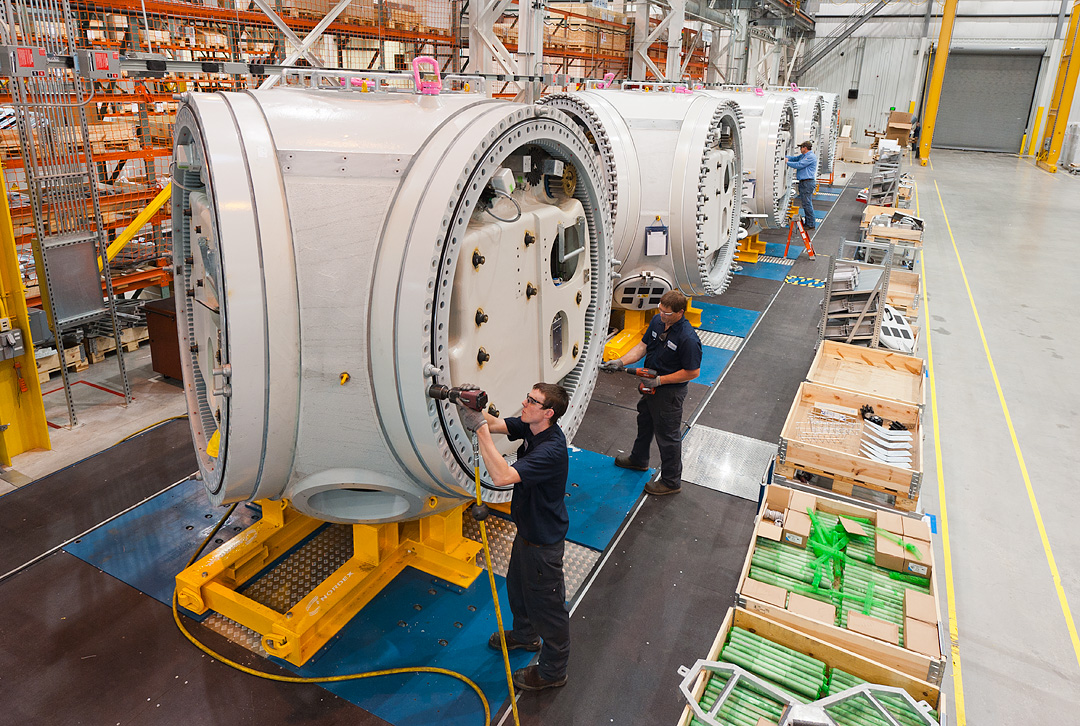
The US #windpower supply chain is diverse. The majority of nacelle assembly, towers, and blades & hubs come from domestic manufacturing facilities. See the new Berkeley Lab data summary at http://windreport.lbl.gov/ ">https://windreport.lbl.gov/">... 8/x
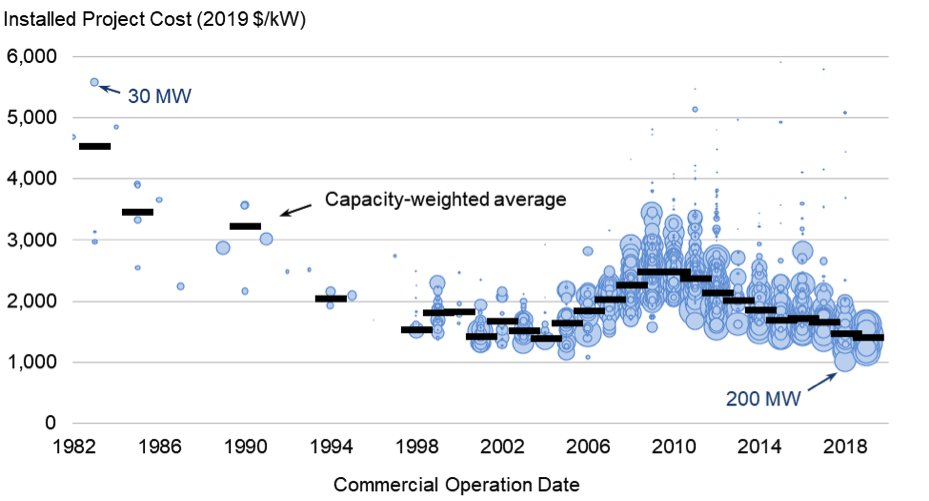
COSTS/PRICES: Wind project capital cost (CapEx) continues to decrease. It averaged $1,440/kW in 2019, down more than 40% since 2010. Data, charts, and visualizations can all be found at http://windreport.lbl.gov/ ">https://windreport.lbl.gov/">... 9/x
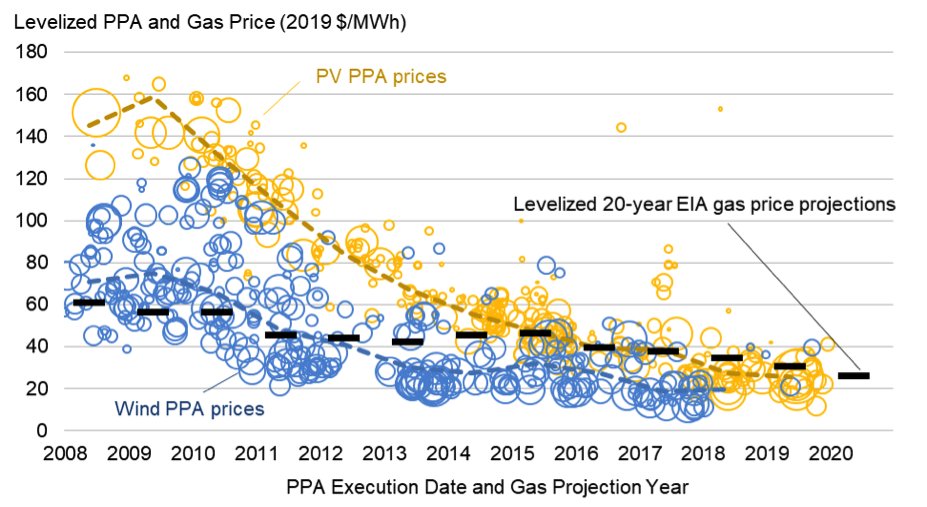
Wind, solar, and natural gas prices (PPA) all continue to fall. New #windpower contracts average less than 2 cents/kWh, supported by federal tax incentives. Check out the data and visualizations at http://windreport.lbl.gov/ ">https://windreport.lbl.gov/">... 10/x
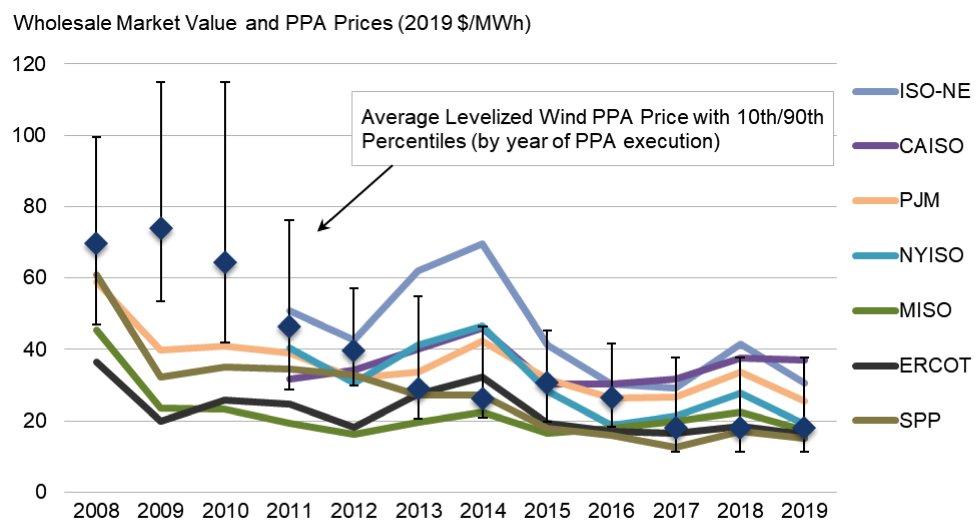
The local hourly wholesale ‘market value’ of wind energy in 2019 averaged $19/MWh, with wide variation. It was lowest in SPP and ERCOT, which also saw the lowest PPA prices. PPA prices are generally comparable to wind’s market value. Details at: http://windreport.lbl.gov/ ">https://windreport.lbl.gov/">... 11/x
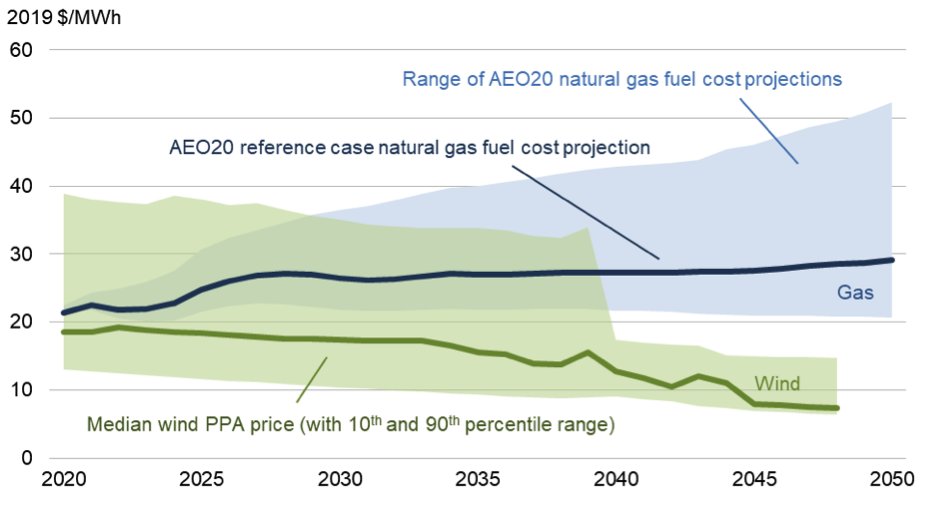
New #windpower prices compare favorably to the fuel cost of natural gas plants, and may be more favorable in the future, based on AEO 2020 projections. New data resources from Berkeley Lab: http://windreport.lbl.gov/ ">https://windreport.lbl.gov/">... 12/x
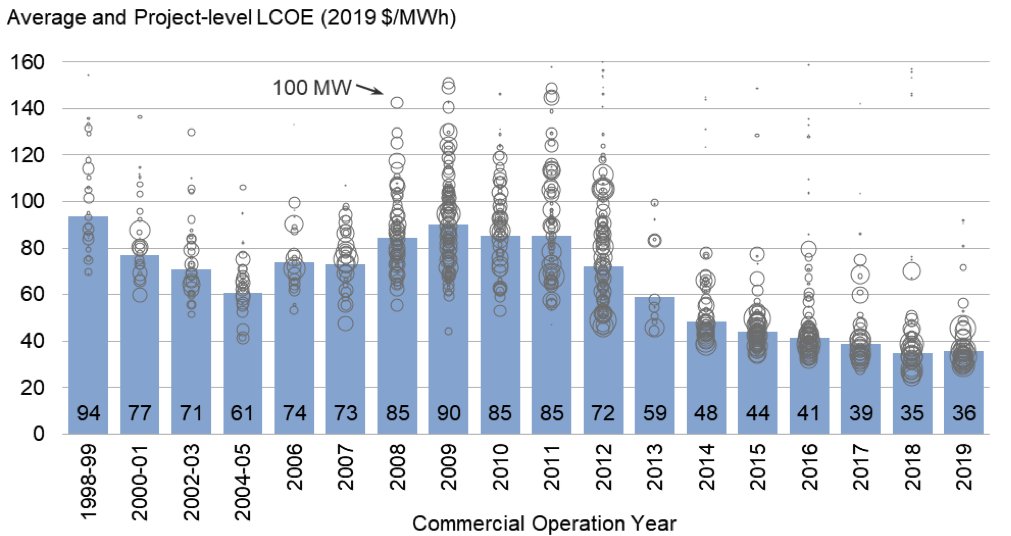
The levelized cost of wind energy (LCOE) in the US (without the PTC) averaged $36/MWh for projects built in 2019, comparable to 2018 projects. All of the details (including interactive data visualizations) can be found at http://windreport.lbl.gov/ ">https://windreport.lbl.gov/">... 13/x
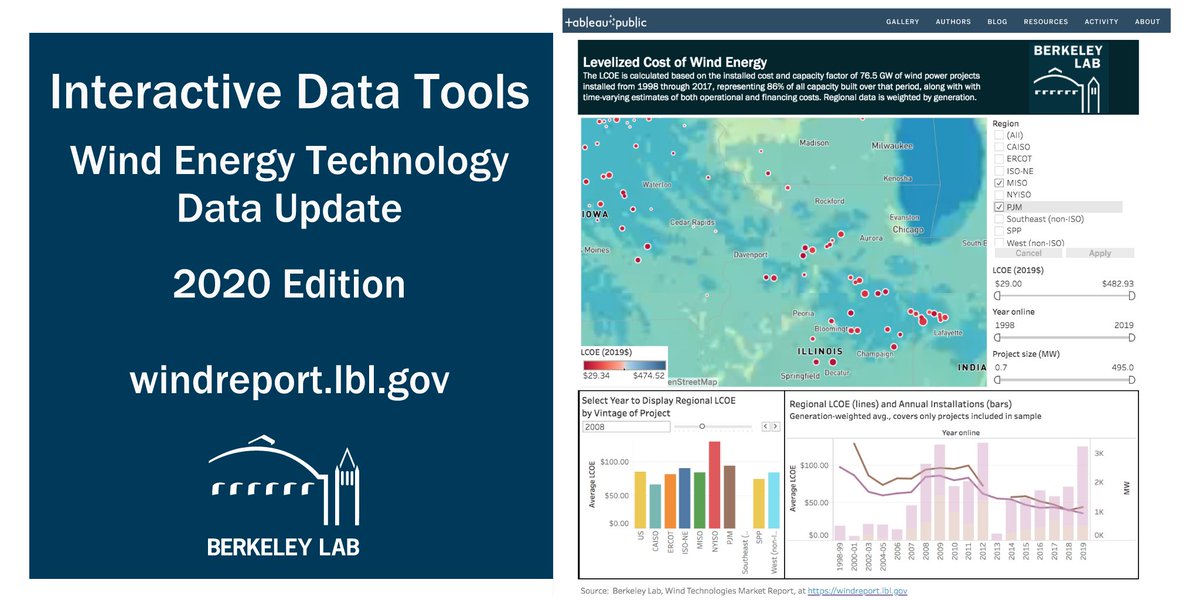
Interested in the latest #windenergy trends from the United States? We have not only a briefing slide deck and a huge Excel data file, but also a plethora of data visualizations. Play around with the data yourself at http://windreport.lbl.gov/ ">https://windreport.lbl.gov/">... /end of thread!

 Read on Twitter