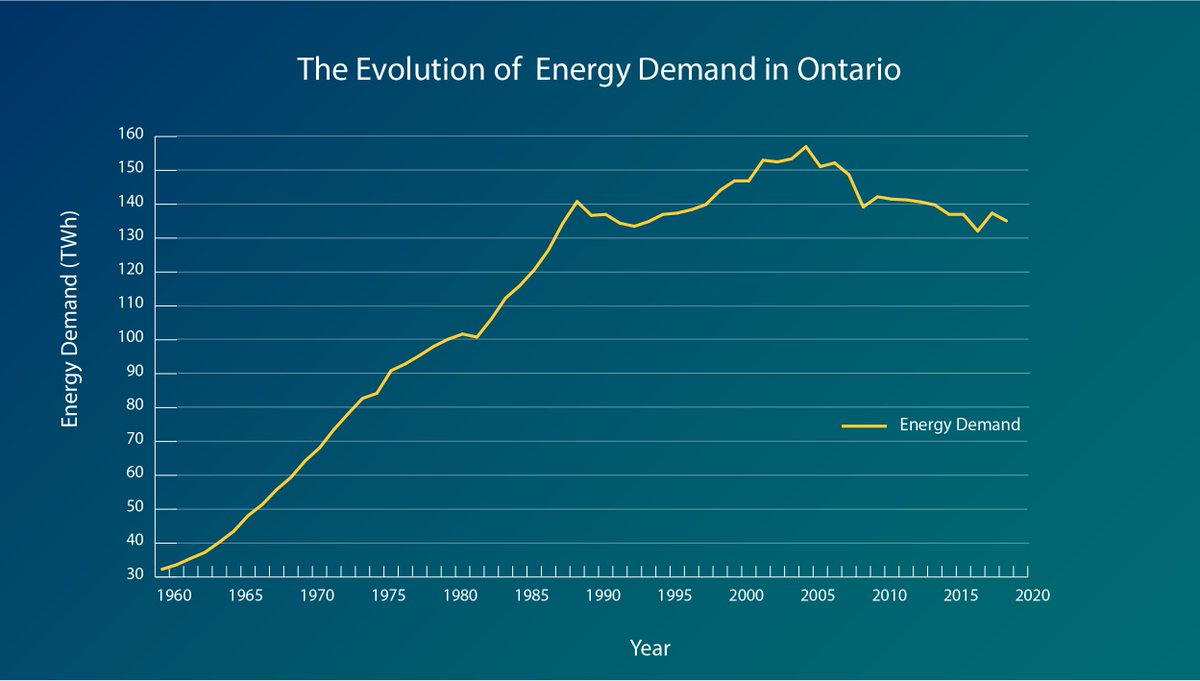
For demand forecasters, the past is a tool to help plan for the future. The IESO has recorded energy demand data for 60 years, here’s a recap of the last six decades.
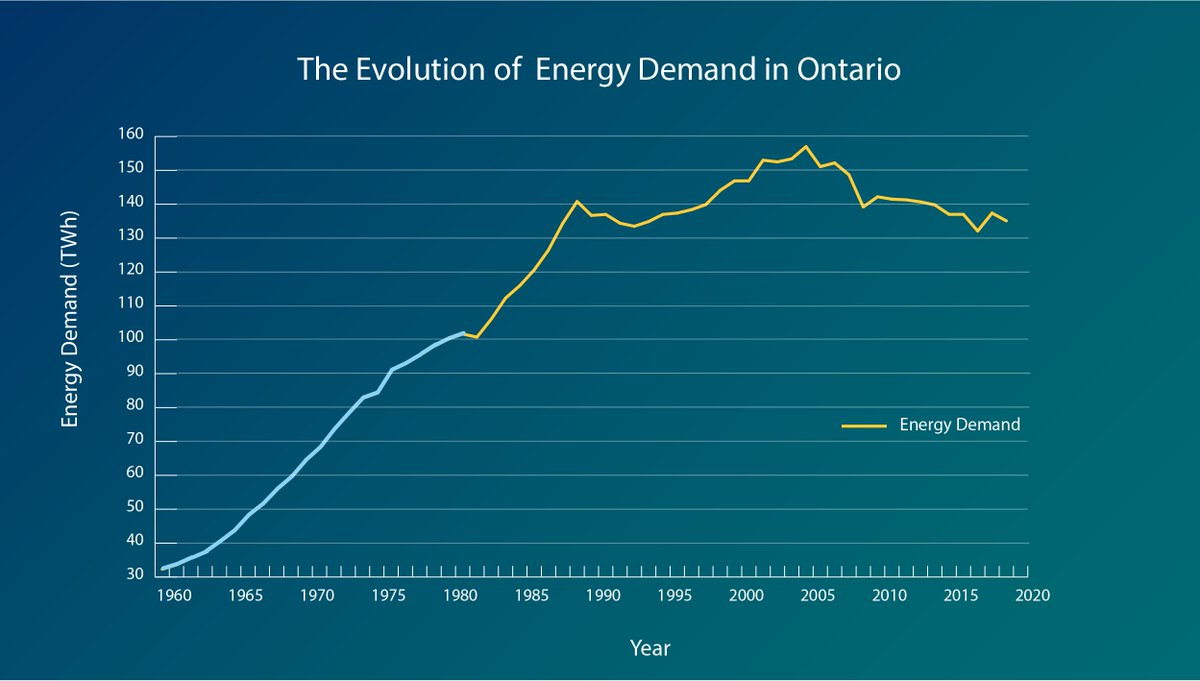
Economic prosperity and population are drivers of demand growth. By the end of the 1970s Ontario’s population increased by 30 per cent from 1960. Demand saw small hits during these decades due to the 1973 oil crisis and stock market crash.
Between periods of growth are dips in demand. Historically, the largest impacts on demand are related to weather and the economy. The graph shows how some dips are small with a quick recovery, while others have required a longer recovery period.
During the early 1980s recession, electricity consumption in Ontario saw a reduction in demand between 1981 and 1982, the first annual reduction since records began in the 1960s. The reduction was short lived, as consumption rose rapidly over the next two years.
The period of growth rose to a crescendo in 1989 as the world entered the early 1990s recession. During the period of 1990 and 1994 the province saw a reduction in electricity demand by 7.2 TWh, about the same amount of energy Ottawa consumed in 2018.
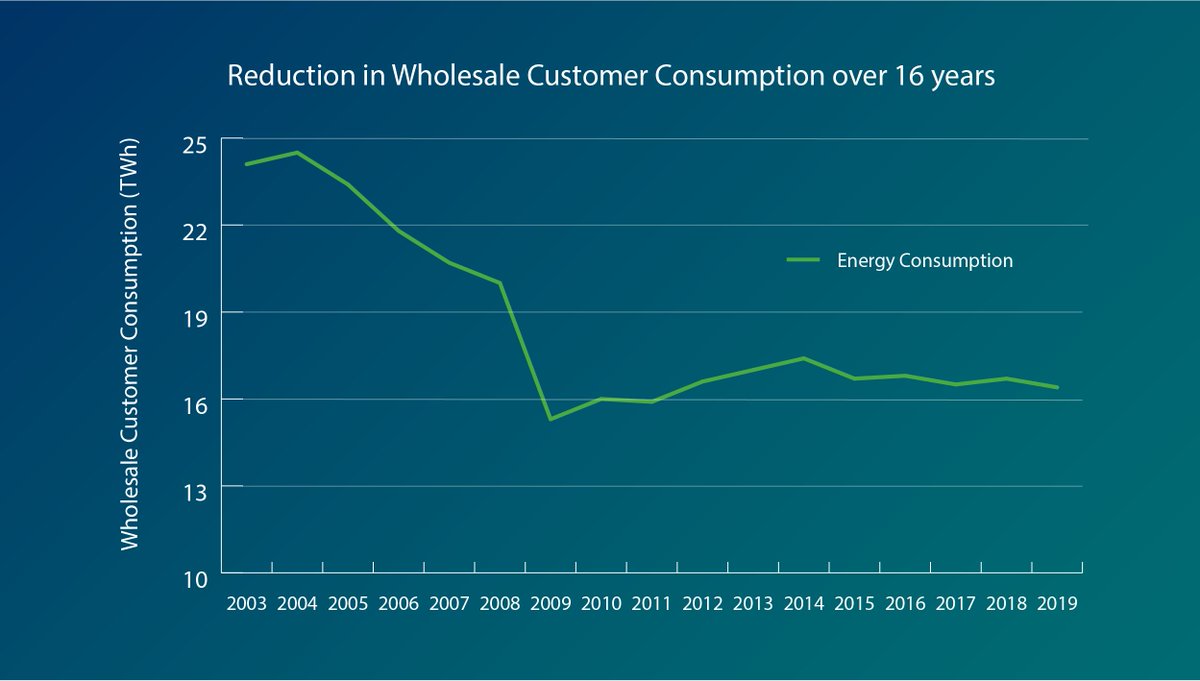
In 2004 the Canadian dollar topped the American dollar, which led to lower exports and production by manufacturers in Ontario. In 2004, industrial demand was 24.6 TWh, and has steadily decreased to 16.4 TWh in 2019.
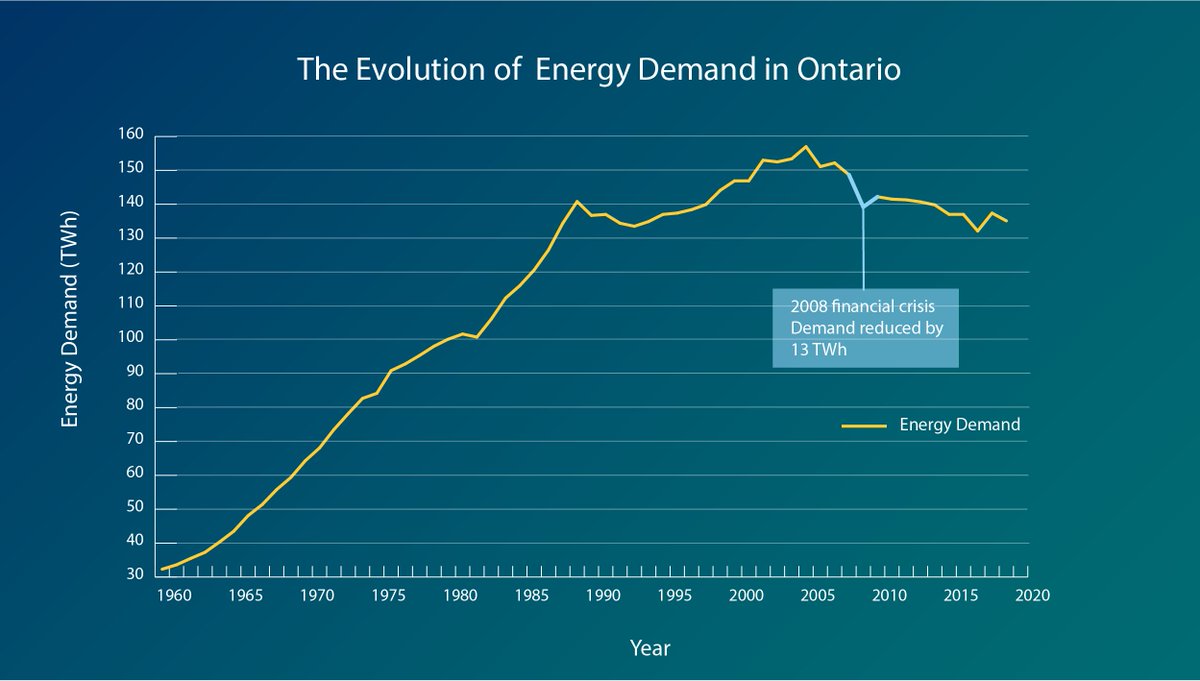
The decrease in industrial demand was also heavily influenced by the 2008 financial crisis, which saw a restructuring of Ontario’s economy including reduced manufacturing. The recession significantly impacted consumption as a whole, with a decline of 13 TWh from 2008 to 2009.
Weather is the main influencer of demand. In the early 2000s the province saw a switch from winter to summer peaks due to the increase of AC installation and the switch from electric to gas for home heating.
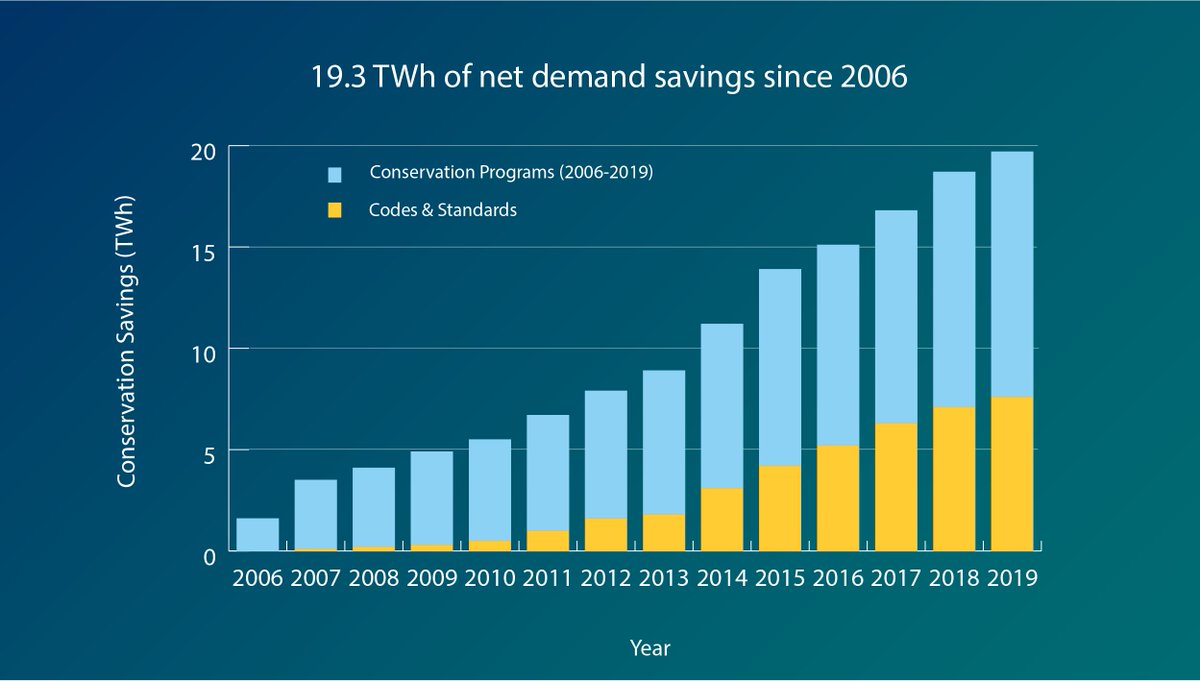
Conservation also has a significant impact on demand, reducing the need for new infrastructure while helping businesses save costs. The introduction of conservation activities since 2006 has decreased net demand, and has led to 19.7 TWh of energy savings.
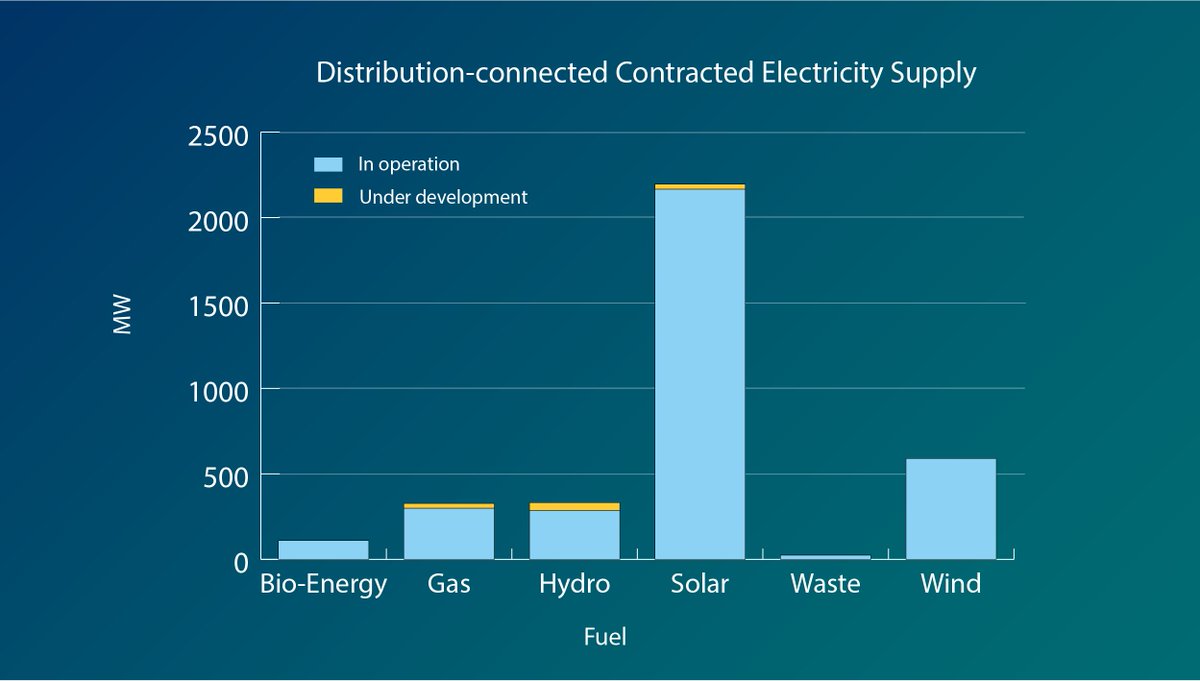
Starting in 2009, new wind and solar projects led to an increase in distribution-connected generation, which reduced provincial grid demand. The largest impact of distributed generation occurred from 2010-2018. The graph below shows current distributed generation in operation.
And that brings us to today, over the last few months we have navigated events that will also be stamped in history. By understanding how demand has evolved throughout global changes, we can better plan to ensure continued reliability today and tomorrow.

 Read on Twitter