Good morning: Let& #39;s talk about where we are in terms of recovery in Asia, the Eurozone and the USA.
Below is manufacturing PMIs. Note the following:
* US contraction less than Eurozone & Asia
* US recovery is also faster and stronger.
Below is manufacturing PMIs. Note the following:
* US contraction less than Eurozone & Asia
* US recovery is also faster and stronger.
This is what the chart looks like if you just use China manufacturing & compare USA, China & the Eurozone.
Note that China recovery is one of the more swift ones in Asia but: Fall sharper than the US & recovery swift but flat.
Meaning, other Asian economies doing even worse.
Note that China recovery is one of the more swift ones in Asia but: Fall sharper than the US & recovery swift but flat.
Meaning, other Asian economies doing even worse.
Here it is replacing China w/ India and you can see that India is not recovering much in manufacturing & still below 50 in the latest and lags behind China & so therefore behind the Eurozone & esp the USA.
Key reason is the length of lockdown & less of monetary + fiscal support.
Key reason is the length of lockdown & less of monetary + fiscal support.
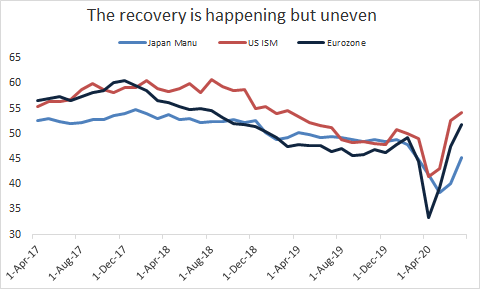
USA, Japan, and the Eurozone. Again, we got a picture of lagging recovery by Asia. Japan prelim for August shows still continued contraction so the recovery is very prolonged.
Question is why that is? Why is Asia lagging?
Question is why that is? Why is Asia lagging?
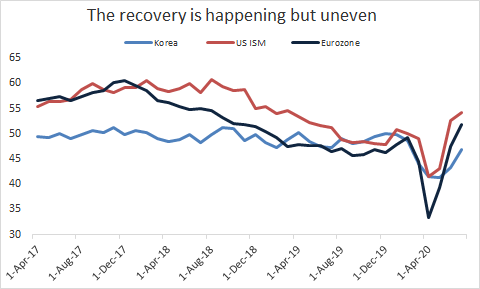
Here it is with South Korea. Again, recovering but still below 50 (meaning still contracting on a month over month basis) and lags the US by a lot.
Why is it not recovering faster?
Why is it not recovering faster?
Here is Vietnam too. Recovery was swift, although the contraction was sharp. But since, it has reversed gains.
Why is the US recovery so swift vs Asia & Europe?
Why is the US recovery so swift vs Asia & Europe?
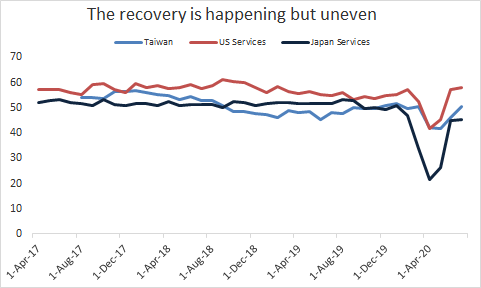
Here is services (the PMIs are so bad for India that I do country by country vs Asian average).
China, USA, and the Eurzone services.
US decline was less than others and recovery much swifter. Look at the EU. Very very sharp. But don& #39;t feel bad for it, India is worse.
China, USA, and the Eurzone services.
US decline was less than others and recovery much swifter. Look at the EU. Very very sharp. But don& #39;t feel bad for it, India is worse.
Here is India, the USA and the Eurozone.
What do you see? The recovery, well, is not yet happening as India is still very below 50 (contracting still on a M-o-M basis) but by less.
Services almost were non-existent at trough.
What do you see? The recovery, well, is not yet happening as India is still very below 50 (contracting still on a M-o-M basis) but by less.
Services almost were non-existent at trough.
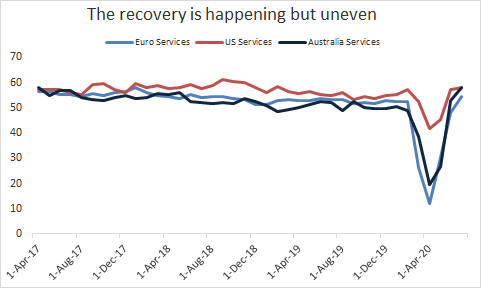
Australia recovery looks more like the Eurozone, as in the bottom was low but recovery also swift.
Note that the US is unique in the the fall of its manufacturing and services weren& #39;t that steep relative to other countries & hence recovering faster. Plus swift & massive support.
Note that the US is unique in the the fall of its manufacturing and services weren& #39;t that steep relative to other countries & hence recovering faster. Plus swift & massive support.
Even Taiwan, which never had a lock-down & life basically normal, fell about the same level as the US (although the starting point for Taiwan is lower) & recovery behind the US.
Question: What drives recovery & what holds it back?
Why is Asia so behind, esp India & ASEAN?
Question: What drives recovery & what holds it back?
Why is Asia so behind, esp India & ASEAN?
Many people say, how could this be if US continuing claims =15.5 millions while US economic data continues to surprise on the upside???  https://abs.twimg.com/emoji/v2/... draggable="false" alt="🧐" title="Gesicht mit Monokel" aria-label="Emoji: Gesicht mit Monokel">
 https://abs.twimg.com/emoji/v2/... draggable="false" alt="🤷🏻♀️" title="Achselzuckende Frau (heller Hautton)" aria-label="Emoji: Achselzuckende Frau (heller Hautton)">
Unlike Asia, US continuing claims = people getting paid not working = costs to gov but people still have income = demand-side support.
Unlike Asia, US continuing claims = people getting paid not working = costs to gov but people still have income = demand-side support.
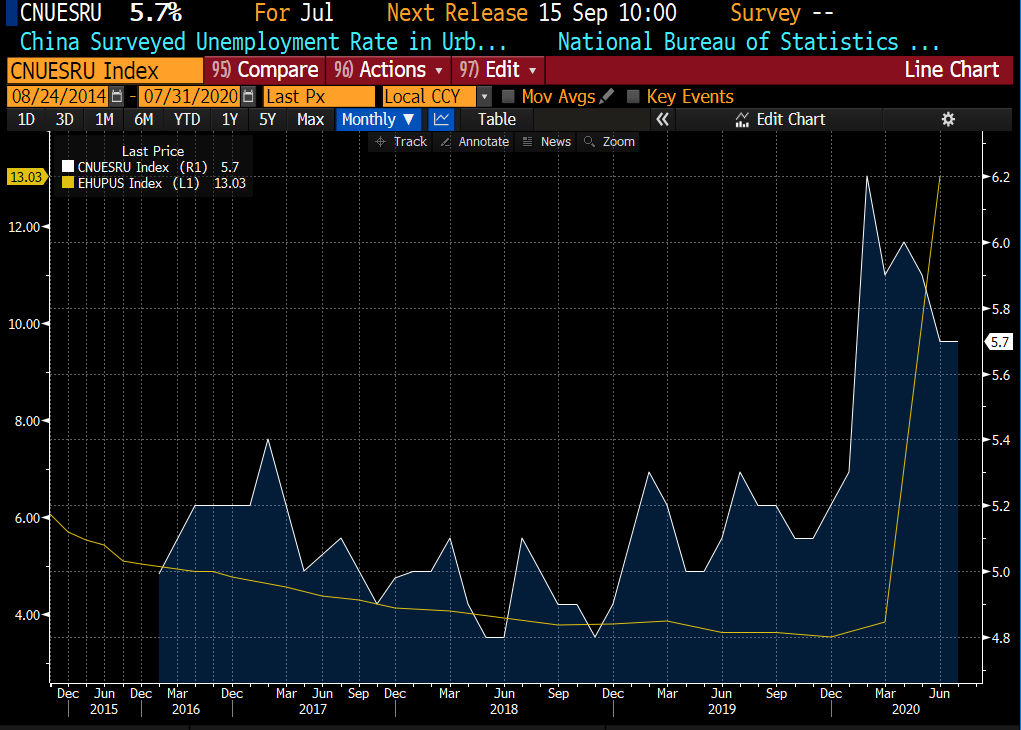
So Asian unemployment looks good but because Asia unemployment data is flawed (China looks esp good but it doesn& #39;t count migrant workers etc) & moreover support more supply side so jobless = not counted = no support = less income = less demand.
China vs US unemployment below.
China vs US unemployment below.
By just looking at the headline unemployment number, you are not seeing the income side of the equation. In the US, high continuing claims = high number of people accessing safety net created by fiscal support = income. Plus not forget deferment of rent/costs.
So? Retail sales.
So? Retail sales.
US retail sales vs China retail sales.
The latest figure shows the US July+2.7% vs a year earlier & that& #39;s w/ targeted lock-downs in many places that had a spike of virus.
Whereas China -1.1% even as activities normalize in the country. Why?
Well, income & supply-side support
The latest figure shows the US July+2.7% vs a year earlier & that& #39;s w/ targeted lock-downs in many places that had a spike of virus.
Whereas China -1.1% even as activities normalize in the country. Why?
Well, income & supply-side support
Meaning, the strength of China continues to be sectors that get government support & therefore the households that are not getting the support are tightening their purse strings.
And so it shows up here. And that& #39;s more telling that unemployment rate b/c it shows the income side
And so it shows up here. And that& #39;s more telling that unemployment rate b/c it shows the income side
If you think Americans are taking on more debt to consume, then it& #39;s not necessarily true. Of course that is true if you disaggregate the data. However, check this out:
Americans, seeing worsening economic reality, are saving more. US saving as a share of disposable income high!
Americans, seeing worsening economic reality, are saving more. US saving as a share of disposable income high!

 Read on Twitter





 https://abs.twimg.com/emoji/v2/... draggable="false" alt="🤷🏻♀️" title="Achselzuckende Frau (heller Hautton)" aria-label="Emoji: Achselzuckende Frau (heller Hautton)">Unlike Asia, US continuing claims = people getting paid not working = costs to gov but people still have income = demand-side support." title="Many people say, how could this be if US continuing claims =15.5 millions while US economic data continues to surprise on the upside??? https://abs.twimg.com/emoji/v2/... draggable="false" alt="🧐" title="Gesicht mit Monokel" aria-label="Emoji: Gesicht mit Monokel">https://abs.twimg.com/emoji/v2/... draggable="false" alt="🤷🏻♀️" title="Achselzuckende Frau (heller Hautton)" aria-label="Emoji: Achselzuckende Frau (heller Hautton)">Unlike Asia, US continuing claims = people getting paid not working = costs to gov but people still have income = demand-side support." class="img-responsive" style="max-width:100%;"/>
