Breaking down the state of the U.S. housing market since we now have a full V shape recovery on all data lines. Time to look at each sector https://www.housingwire.com/articles/are-existing-home-sales-showing-a-housing-bubble/">https://www.housingwire.com/articles/...
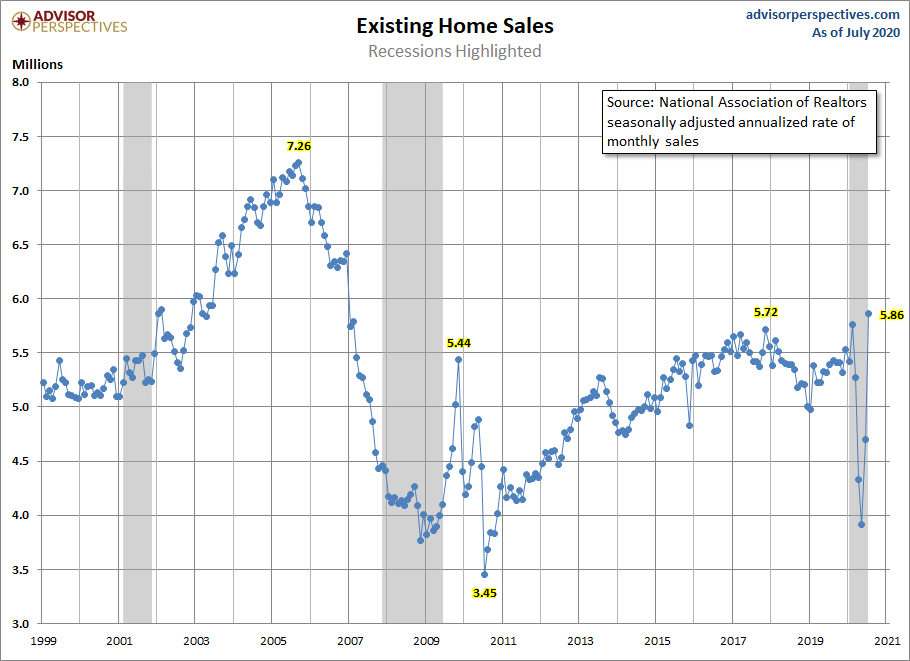
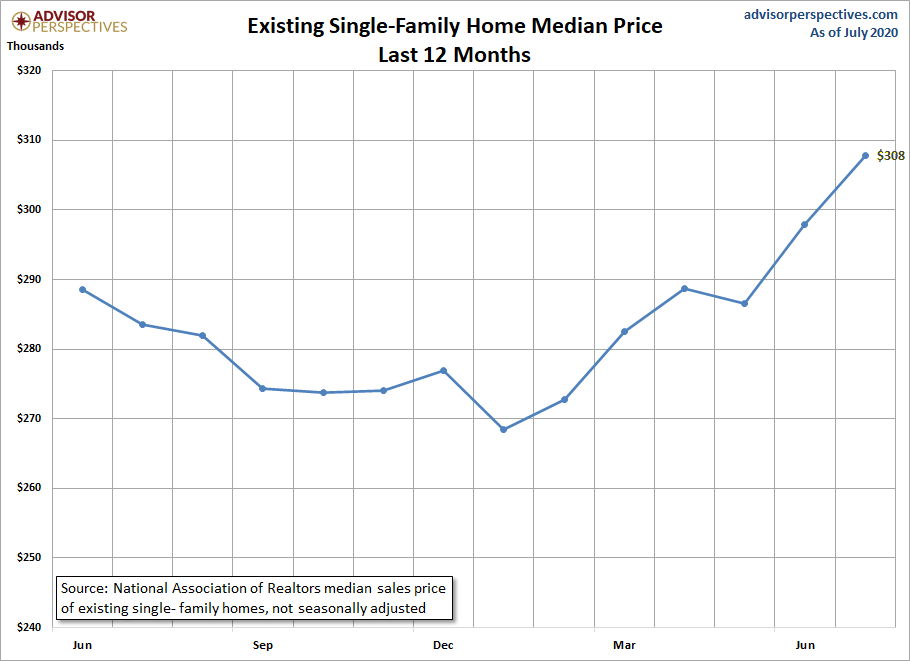
Obviously, that was an epic existing home sales print yesterday. However, don& #39;t forget housing broke out in February of this year. We just got back to that trend, still down YTD, but working our way again.
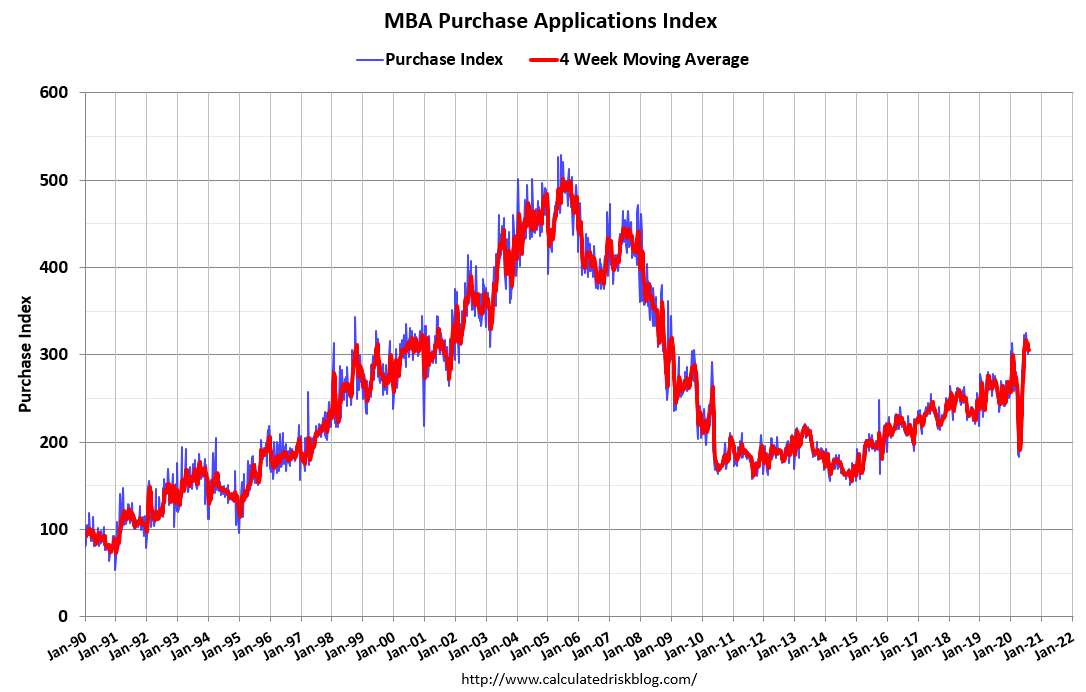
Existing Home Sales: Rule 1: Always focus on the YoY data from the MBA purchase application to get direction. A lot of terrible takes on housing over the last 5 years has come from people who don& #39;t track this. Right now, the previous 4 weeks are still showing 20% plus YoY growth
Purchase application data is a good barometer on-trend direction, and you need 15% plus moves either way to get some real movement.
The last 13 weeks have all showed YoY growth now. The last 4 weeks are the best YTD
+27%
+22%
+22%
+21%
+19%
+16%
+33%
+15%
+18%
+21%
+13%
+18%
+9%
The last 13 weeks have all showed YoY growth now. The last 4 weeks are the best YTD
+27%
+22%
+22%
+21%
+19%
+16%
+33%
+15%
+18%
+21%
+13%
+18%
+9%
Seasonality has kicked in here, and this data line looks out 30-90 days. So, we do have a shot this year to have positive total sales growth if this trend continues. Our best sales prints have all come in the fall and winter, excluding yesterday& #39;s report.
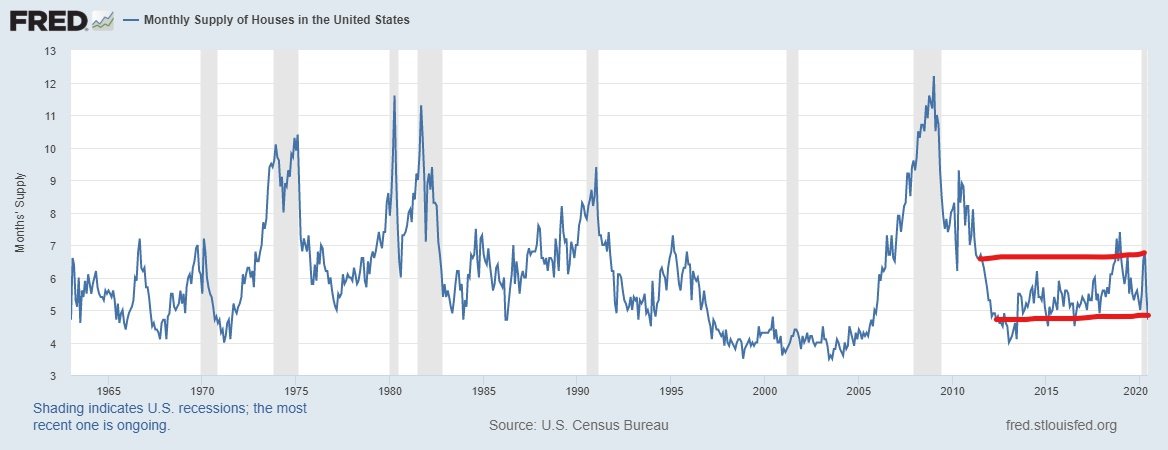
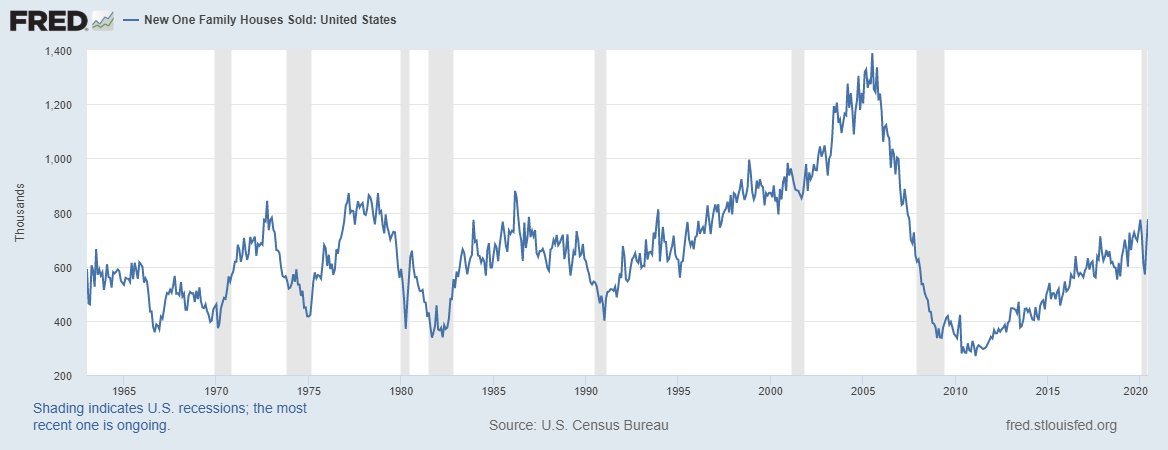
New home sales. For me, the most critical housing chart we have is the monthly supply of new homes. If they break above 6.5 months, growth in starts is gone—too much supply fo homes. We have had this now happen twice since the end of 2018. Both times we have recovered.
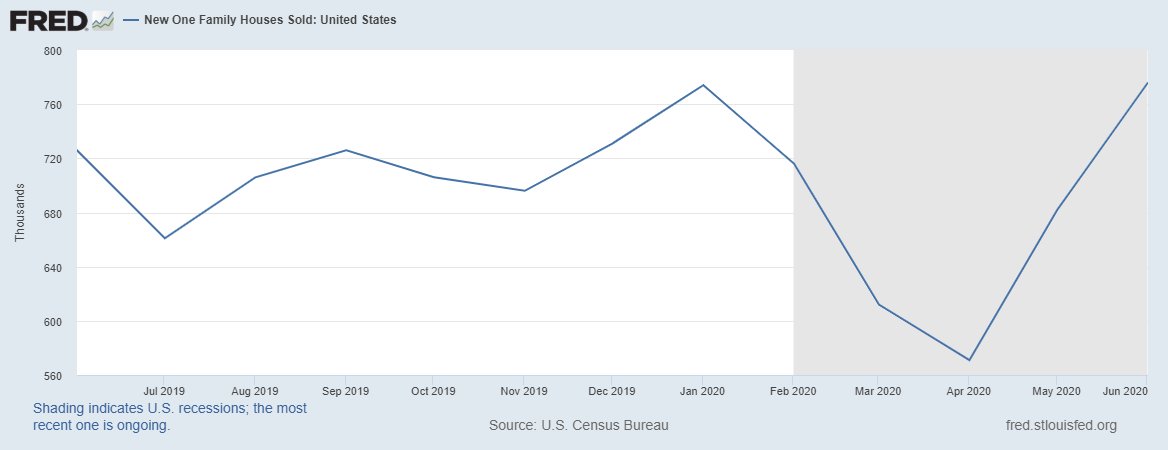
As we saw an inverse V shape recovery in monthly supply. That would only mean new home sales also had its V shape recovery as well. It did!
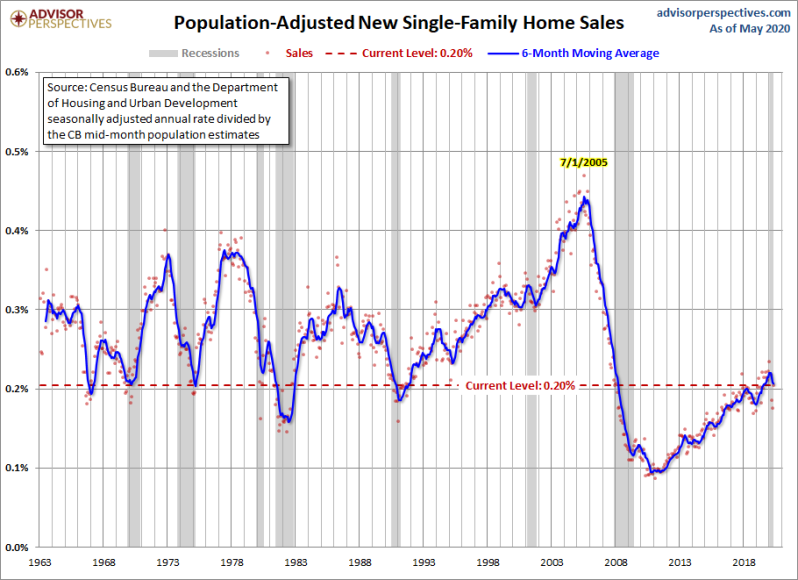
New home sales just came off its weakest sales recovery cycle ever recorded in history. So, on a historical basis, this sector is not overheating right now, but it has limits as these homes are more expensive than the bigger supplied and cheaper existing home sales marketplace.
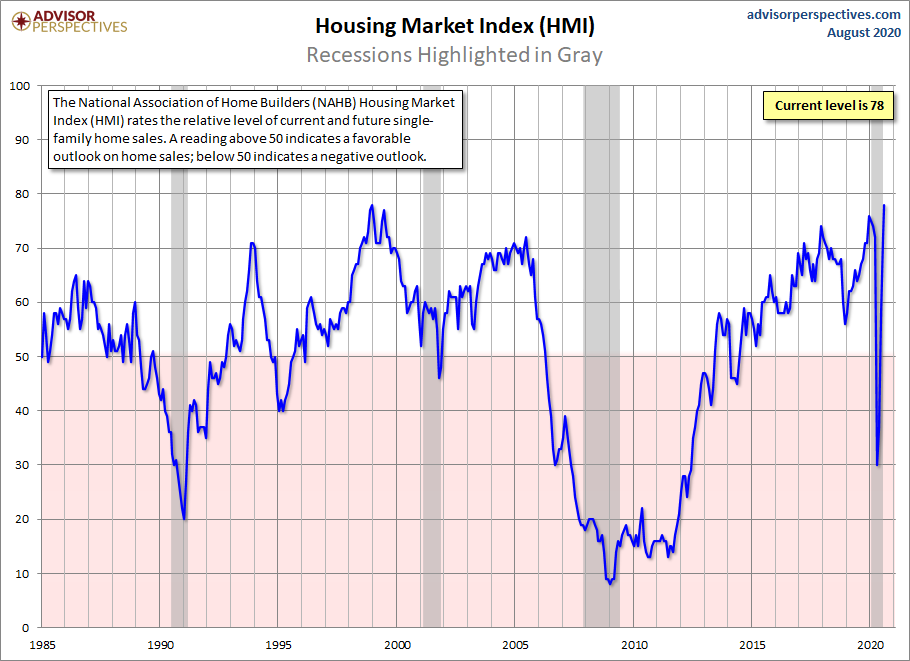
We don& #39;t have a low bar in the new homes sales market and its very rate sensitive. When rates get over 4.5%, this sector cools down. 4.75%-5% create a supply spike, which stopped the rate of growth in construction. Just keep an eye out for mortgage rates for this sector. HMI = V
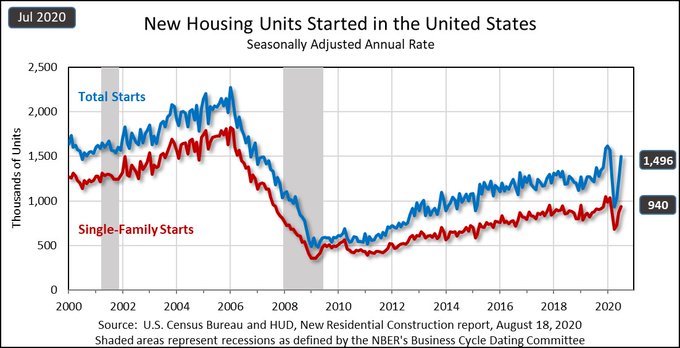
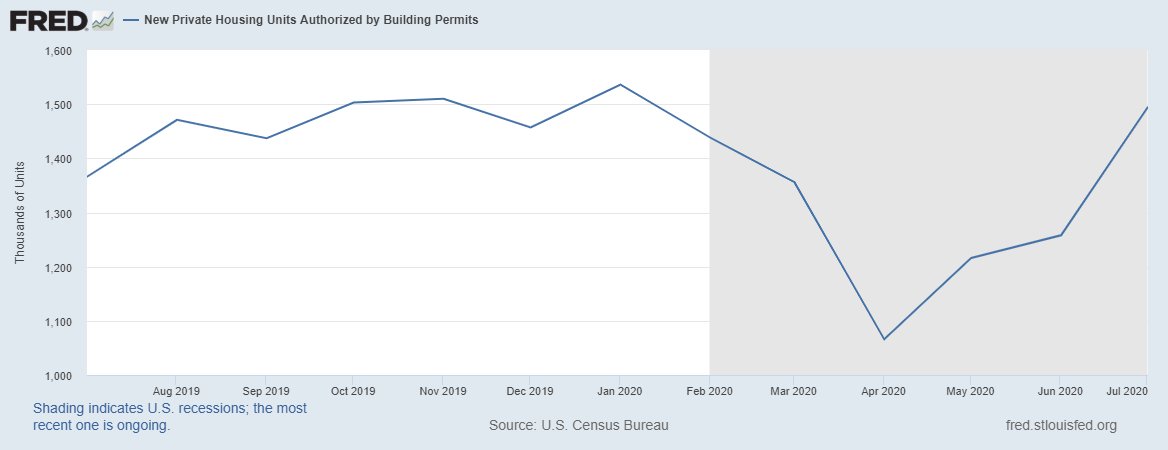
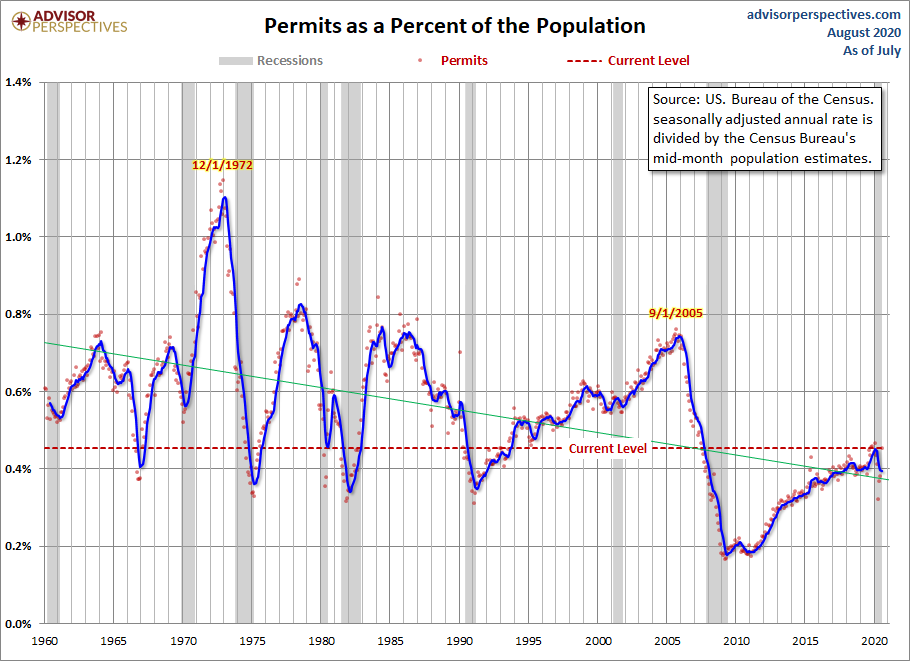
The best part of the monthly supply of new homes coming down is that housing starts are ready to get back to its slow and steady cycle. Just remember, 2019 growth was flat, but we had 40% YoY growth in February of this year. That comp was coming off weakness in early 2019.
Don& #39;t forget this bit of advice. Builders don& #39;t care about the existing home sales market, the NAR, or any housing pundit that says we need to build more homes. They only make off their demand curve for new home sales.
If you want more construction, you need more demand.
If you want more construction, you need more demand.
Unless you& #39;re advocating deficit financing from the federal government to build more homes at a loss. We all live with the limits of the new home sales demand market.
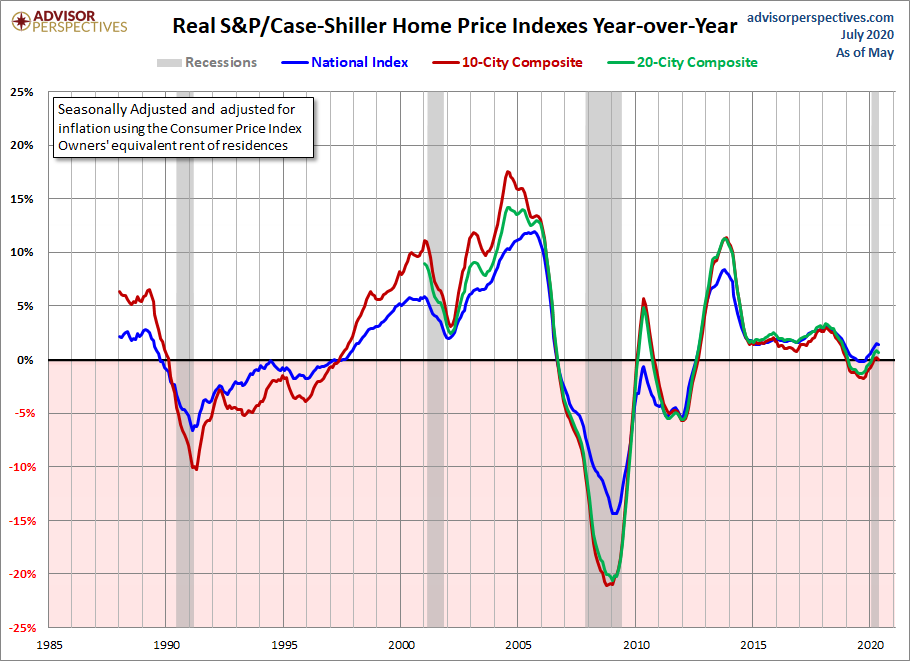
Prices, so far in 2020, we haven& #39;t seen the overheating market place that I was concerned about. However, I would advise keeping an eye on this. I believe now some of you can see why I cheered so much when we got negative real home price growth last year and the market was stable
Now that demand has picked up in the existing home sales market place. This is the time to focus on it. Economics is equilibrium, and that fear of years 2020-2024 having an overheated price market is real. Mortgage rates low, demographics solid, housing tenure at 10 years = setup

 Read on Twitter