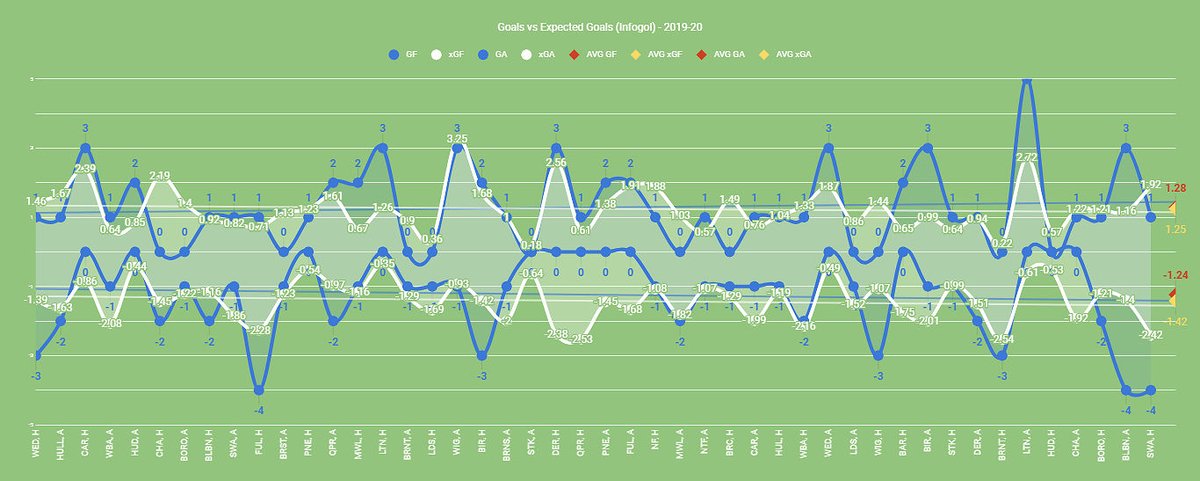
Here& #39;s how Infogol tracked xG over season. May be surprised to see both sides of ball outperformed xG. Not so surprising, tho, when remember xG happens by creating chances in 1st place. Over season, if look at trendlines, RDG made slightly fewer chances but slightly more of them.
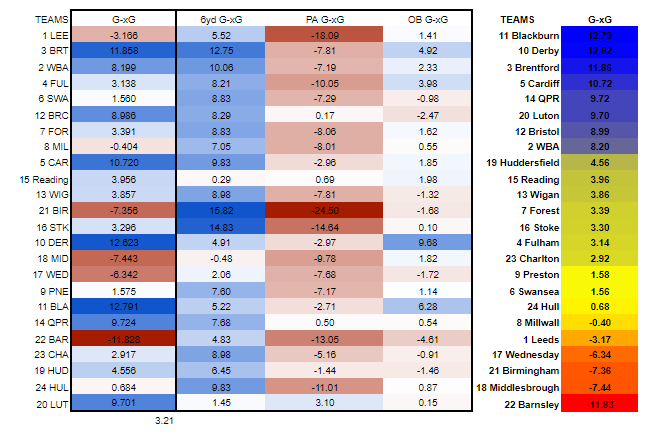
Part of that because Reading finally climbed into + inside 6yd box. (This is from very simplistic xG.) As late as end of Feb, Reading were the only neg inside the 6. End of season neg claimed by Boro.
That’s all w RDG averaging basically same # of shots per game inside the 6.
That’s all w RDG averaging basically same # of shots per game inside the 6.
Reading DEF has outperformed the x since at least Dec. In that 4 game win streak that crossed into 2020, the opponents averaged underperforming the x by 2 whole goals.
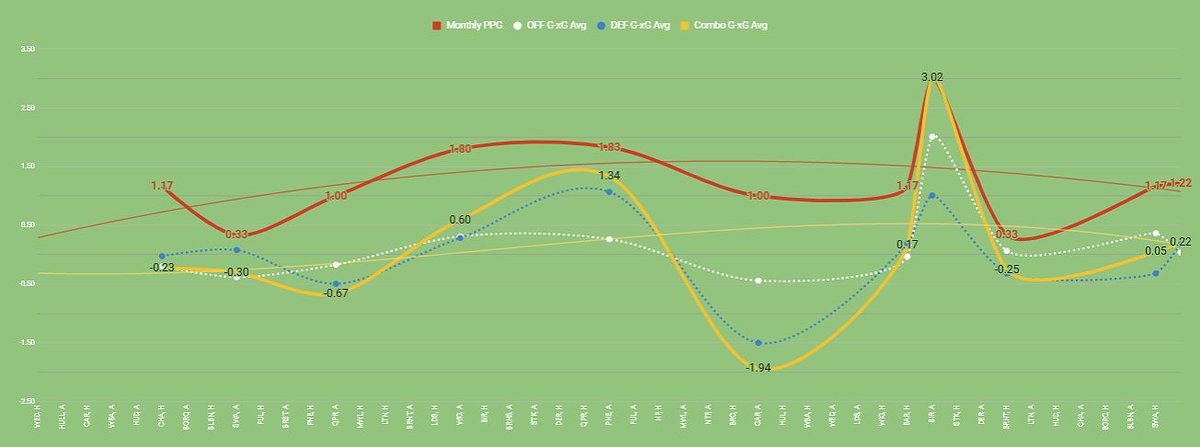
If you take out Virginia’s 2 games, the DEF even outperformed the while Gomes was in charge. (The finishing at the other end tho…) But the side dipped overall in October (thru both managers). You can see that here w PPG & Combo G/xG by month.
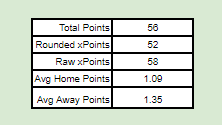
At far right are season avg.
At far right are season avg.
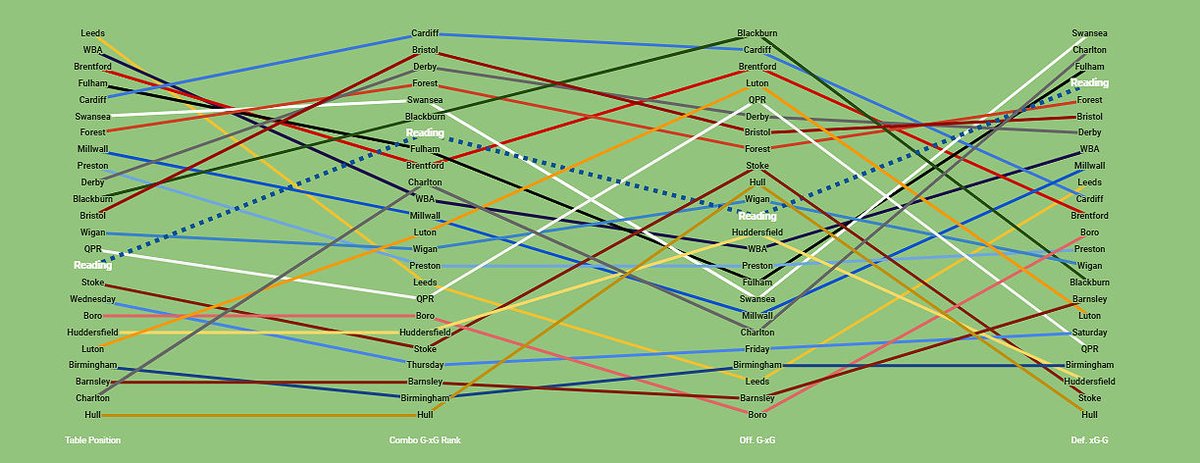
Using @experimental361& #39;s table, Reading’s DEF was good for 4th in the league compared to expectation, w the OFF mid-table.
But as mentioned before, that’s only measuring v chances, says nothing of # or freq of chances. Just look at Luton. They did well w chances they had, but...
But as mentioned before, that’s only measuring v chances, says nothing of # or freq of chances. Just look at Luton. They did well w chances they had, but...
...they didn’t have near enough chances.
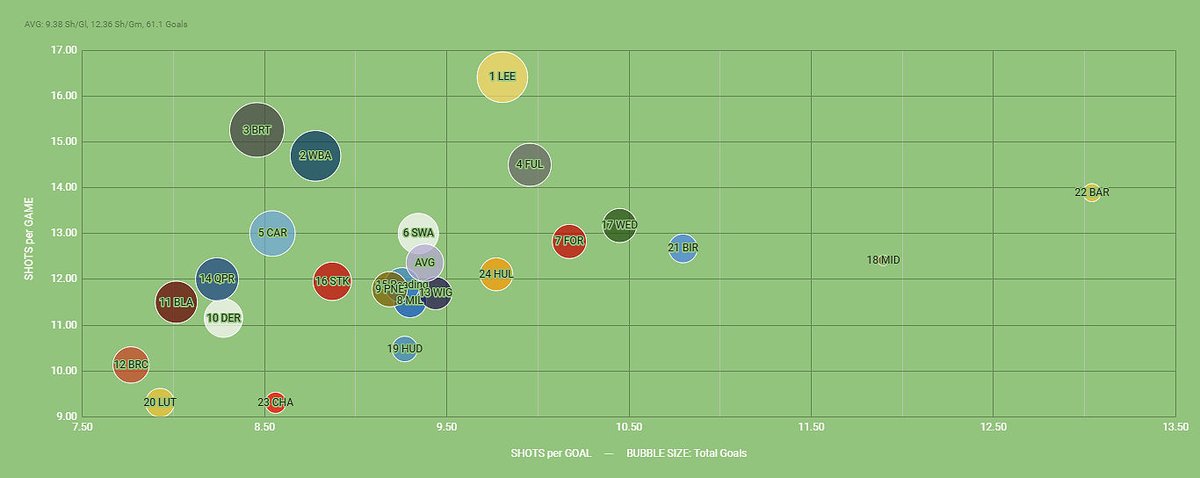
Here’s the league by number of shots & goals, w shots on target per game. Reading below average all around, while the top 6 teams in league all near top in getting shots, getting them on target, and then watching them go in.
Here’s the league by number of shots & goals, w shots on target per game. Reading below average all around, while the top 6 teams in league all near top in getting shots, getting them on target, and then watching them go in.
Can see that again here, where the top 6 convert shots into goals more often but just simply create more shots per game.
Well, maybe not simply. At least not for Reading and everyone else below average.
Well, maybe not simply. At least not for Reading and everyone else below average.
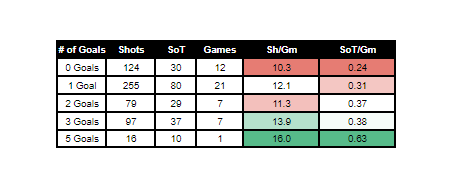
So I started wondering if it was hold true that the more shots RDG took, the more goals they scored.
For the most part it held true, though between 11 & 12, it could go either way. But if Reading get that 13th shot…
For the most part it held true, though between 11 & 12, it could go either way. But if Reading get that 13th shot…
Obviously it’s not _just_ a matter of shooting more, but considering Reading’s SoT% is higher than the league average, shooting more wouldn’t be unwelcome.
But, yes, the offense creating more & better shots should be the aim. (Well, goals are the aim but you know what I mean.)
But, yes, the offense creating more & better shots should be the aim. (Well, goals are the aim but you know what I mean.)
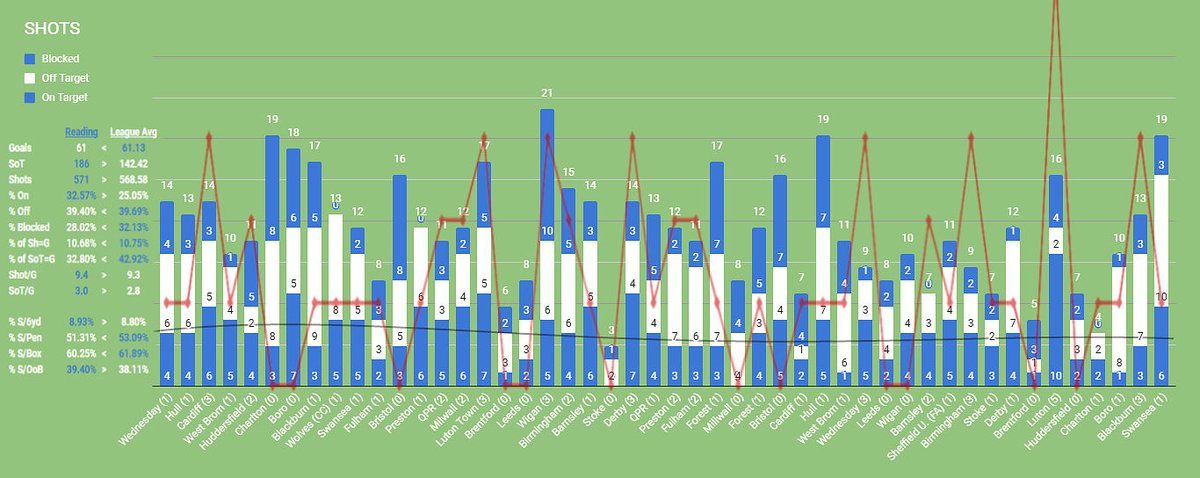
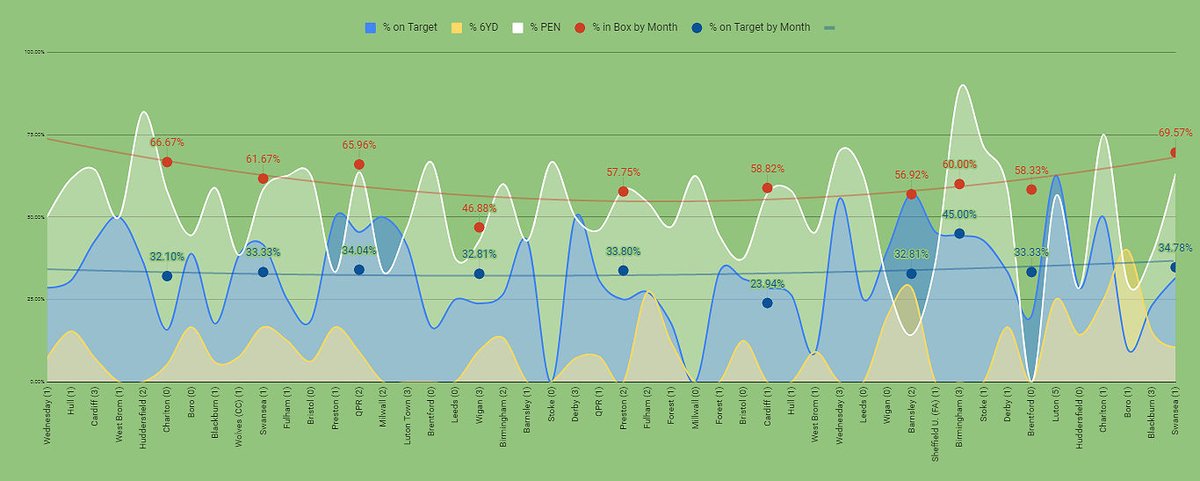
On Reading’s Sh/G over season, can see a few things: 1) RDG’s shots + shots on target have trended down over course of the season, which is not great. 2) RDG’s main deficiency compared w league seems to be not getting enough of their shots inside the penalty area.
The good news on that front is that RDG % of shots in the box started heading back up the last few months after a heavy dip in the middle when Bowen first took over.
The bad news is the heavy dip in the middle.
The bad news is the heavy dip in the middle.
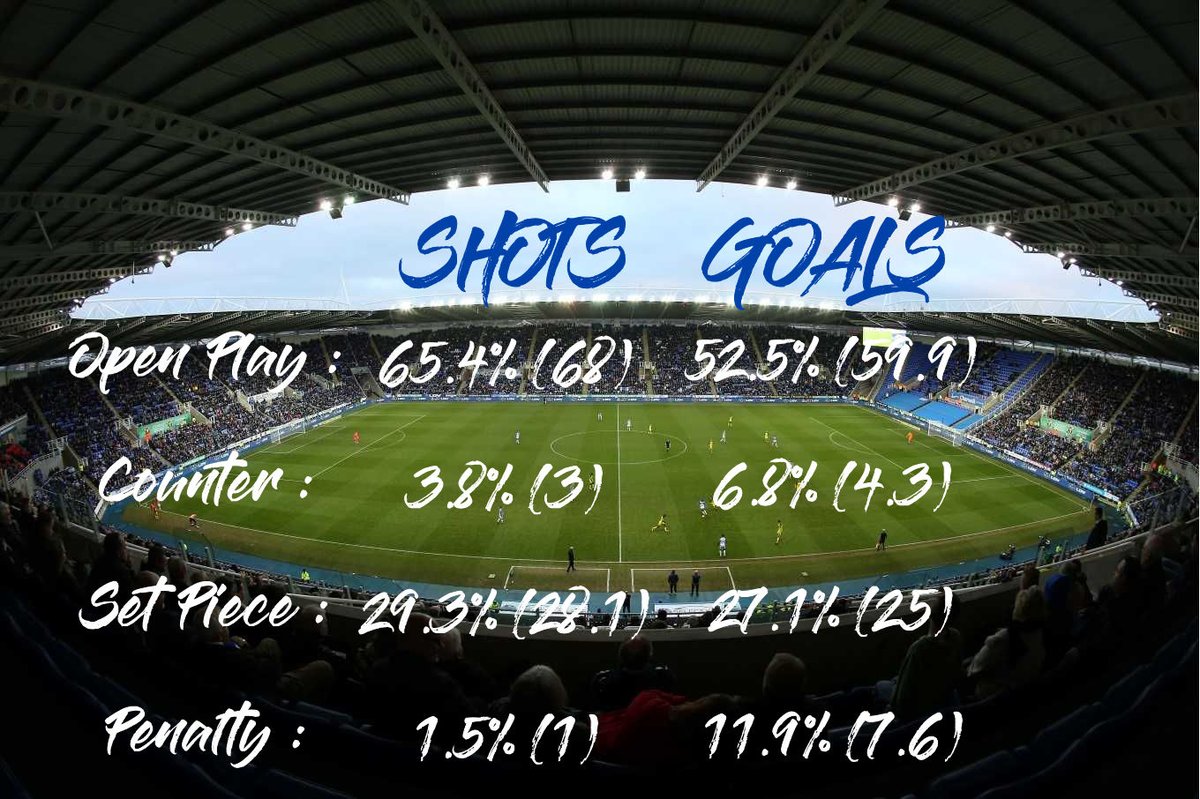
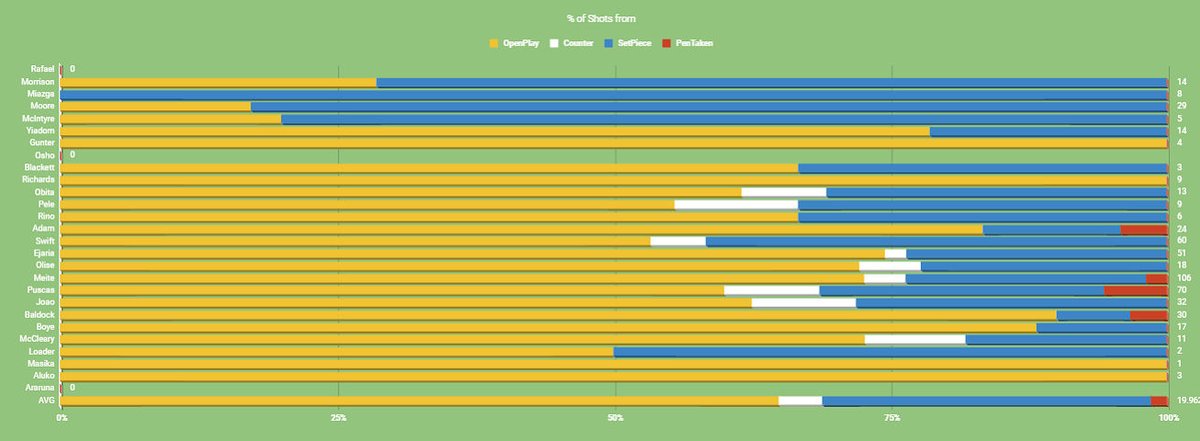
Looking away from locations and toward situational shots & goals, Reading underwhelmed getting them from Open Play. And when they did get them, they underwhelmed in finishing them.
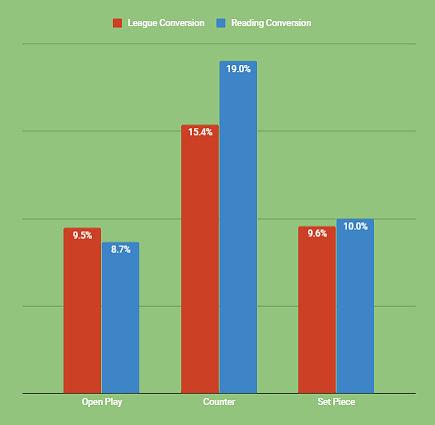
In other siss, RDG outdid league avg in conversion—including penalties, 87.5-82.8 (RDG was 7/8).
In other siss, RDG outdid league avg in conversion—including penalties, 87.5-82.8 (RDG was 7/8).
Basically amounts to Reading being down a goal in open play from league avg for every 100 shots & then trying to cobble that goal back together in the other 3 areas.
Just to draw even.
Just to draw even.
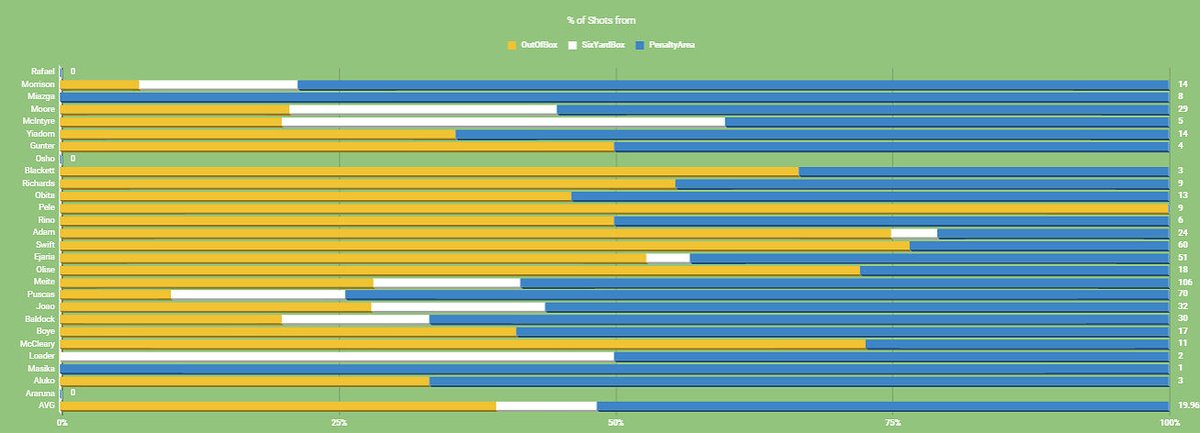
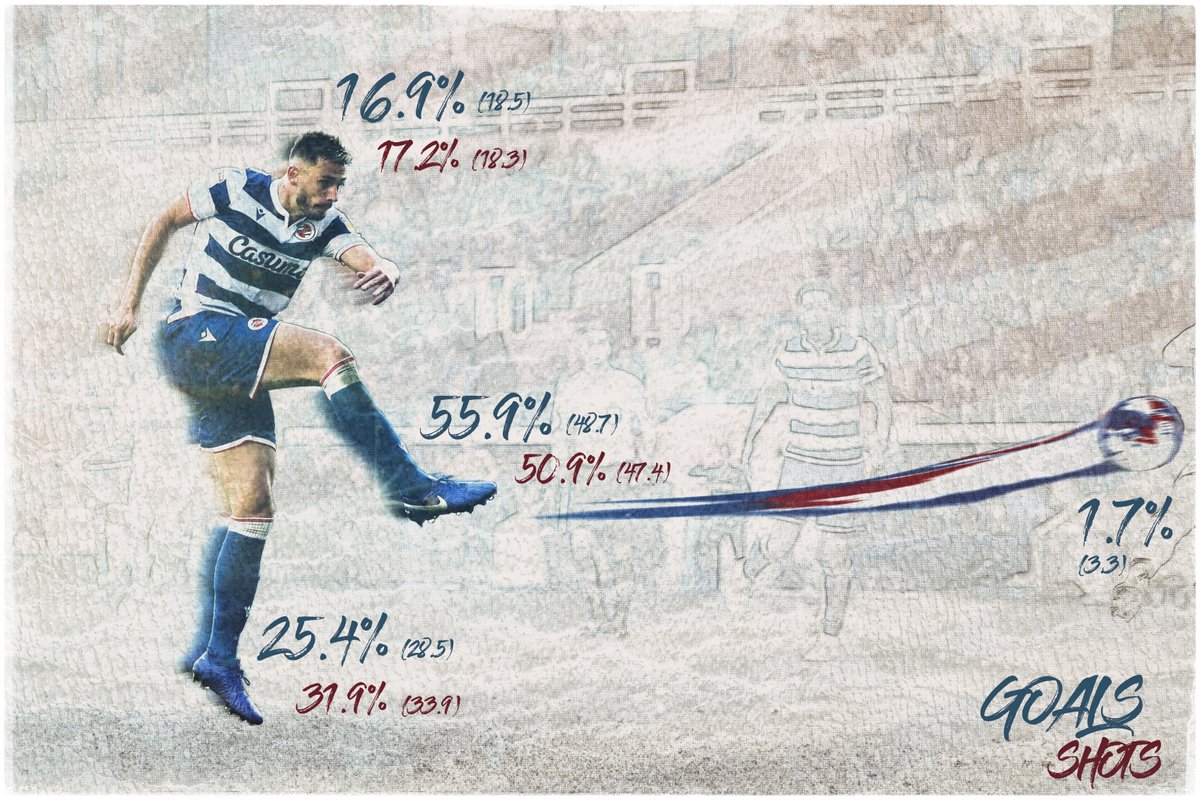
And here’s what body parts Reading shot with, modeled by Matt Miazga (because already had this on my computer). League avg in parentheses.
To right are Own Goals by other team. By league avg, we should’ve had another goal gifted to us by opponents.
(Leeds had 8 scored for them!)
To right are Own Goals by other team. By league avg, we should’ve had another goal gifted to us by opponents.
(Leeds had 8 scored for them!)
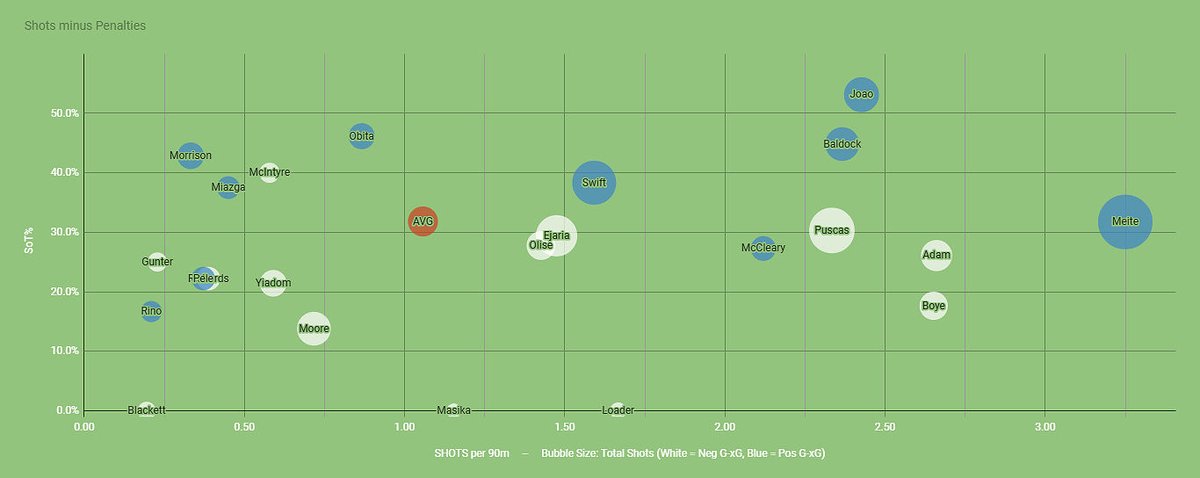
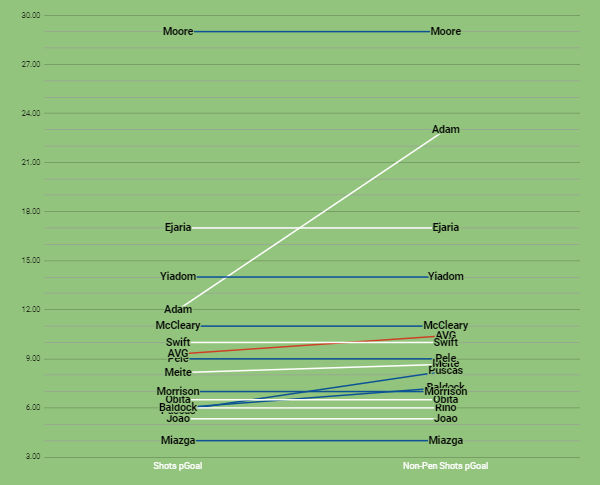
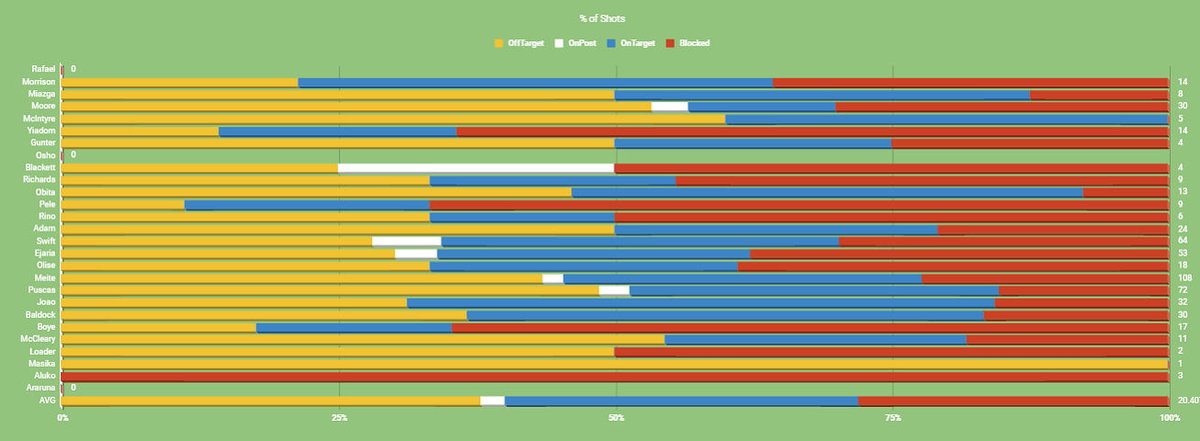
Back to the players taking Reading’s shots, here’s who’s took the most shots, most frequently, and put them on target the most (along w whether they were over/under water compared to their xG).
(All excludes penalties)
(All excludes penalties)
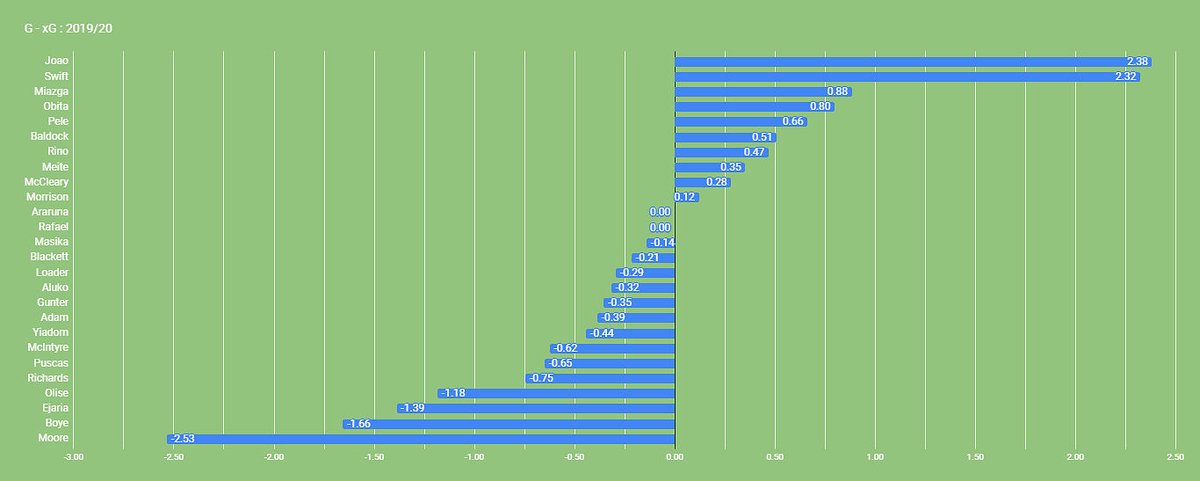
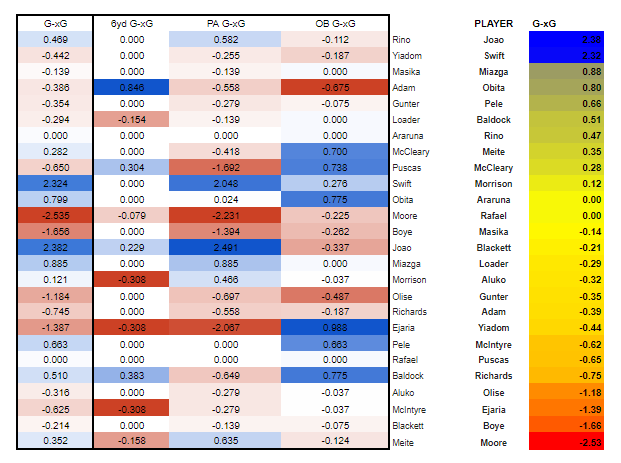
And here’s the G-xG chart (also minus pens).
All of this thread is basically, “Gah, I hope Lucas Joao can stay healthy.”
Puscas climbed up 1.1 from 1st time I did this in September. But still neg.
All of this thread is basically, “Gah, I hope Lucas Joao can stay healthy.”
Puscas climbed up 1.1 from 1st time I did this in September. But still neg.
You take away that he takes (and generally takes well, it must be said) penalties, his record dims a little.
I know, I know: Service. Confidence.
(We should’ve thrown Miazga up front!)
I know, I know: Service. Confidence.
(We should’ve thrown Miazga up front!)
And as I’ve been saying, more shots and in better positions.
But also, with Puscas, his off % is quite high compared to other main strikers. If add in blocked, he & Meite are probably about even.
But also, with Puscas, his off % is quite high compared to other main strikers. If add in blocked, he & Meite are probably about even.
And most of Puscas& #39;s struggles came in Reading’s struggle area—the pen area, which can see back on my simplistic xG model (no pens)—tho the worst 2 there actually Moore & Ejaria. So, yes, get him more service. Also, RDG need a 2nd season jump from him.
So, uh, anyway, in review: more shots, better shots, better shooting.
Simple!
Get on that, Bowen.
Simple!
Get on that, Bowen.
There’s the end of Part 3.
Positional comparisons next, along with something Pt/G/xG-related that I couldn’t get to before doing this one.
#URZ
Positional comparisons next, along with something Pt/G/xG-related that I couldn’t get to before doing this one.
#URZ

 Read on Twitter